
Abstract
Plant species that show gregarious spatial distribution and endemism to the Atlantic Forest, such as Dorstenia elata, are particularly sensitive to the effects of genetic diversity loss. In the present study, we aimed to quantify the genetic diversity in native populations of this species in an Atlantic Forest remnant. The sample included three aggregates of individuals, and molecular characterization was performed with twelve ISSR primers. Intrapopulation analyses were based on the calculation of the Shannon index; total expected heterozygosity and the matrix of distances between pairs of individuals were also calculated. The obtained grouping dendrogram evinced the formation of two groups. Interpopulation investigations were based on the analysis of molecular variance and the estimate of historical gene flow. The results demonstrate that one group comprised the genotypes from two subpopulations, and the other contained exclusively the genotypes of a third subpopulation. The greatest genetic variability was observed within rather than among populations, indicating that the geographical distance and the road that divides the studied populations are not causing loss of genetic diversity.
Key words
Caiapiá; ISSR; Moraceae
Resumo
Espécies de plantas que mostram padrão gregário de distribuição e endemismo na Floresta Atlântica, como Dorstenia elata, são particularmente sensíveis aos efeitos da perda da diversidade genética. Considerando isso, objetivou-se com este trabalho quantificar a diversidade genética em populações nativas dessa espécie em um remanescente da Mata Atlântica. A amostra incluiu três subpopulações de indivíduos e a caracterização molecular foi realizada com doze primers ISSR. As análises intrapopulacionais foram baseadas no cálculo do índice de Shannon; a heterozigosidade total esperada e a matriz de distâncias entre pares de indivíduos também foram calculadas. O dendrograma de agrupamento obtido evidenciou a formação de dois grupos. As investigações interpopulacionais foram baseadas na análise de variância molecular e na estimativa do fluxo gênico. Os resultados demonstram que um grupo compreendeu os genótipos de duas subpopulações, e o outro continha exclusivamente os genótipos de uma terceira subpopulação. A maior variabilidade genética foi observada dentro e não entre populações, indicando que a distância geográfica e a estrada que divide as populações estudadas não estão causando perda de diversidade genética.
Palavras-chave
Caiapiá; ISSR; Moraceae
Introduction
The Atlantic Forest is among the phytogeographical domains facing the most threat and containing the greatest species richness in the world (Myers et al. 2000Myers N, Mittermeier RA, Mittermeier CG, Fonseca GAB & Kent J (2000) Biodiversity hotspots for conservation priorities. Nature 403: 853-858.; Goldenberg et al. 2020Goldenberg R, Reginato M & Michelangeli FA (2020) Miconia lucenea (Melastomatacea), a new species from montane Atlantic Forest in Espírito Santo, Brazil. PeerJ 8: e8752. ), being greatly impacted by anthropic activities. Indeed, human action has been modifying the structure of tropical forests, causing reduction in the density of species and affecting reproduction, pollination, and gene flow distribution between and within natural populations due to the increasing level of spatial isolation between them (Sebbenn et al. 2011Sebbenn AM, Carvalho ACM, Freitas MLM, Moraes SMB, Gaino APSC, Silva JM, Jolivet C & Moraes MLT (2011) Low levels of realized seed and pollen gene flow and strong spatial genetic structure in a small, isolated and fragmented population of the tropical tree Copaifera langsdorffii Desf. Heredity 106: 134-145.). Knowledge about the alterations on genetic diversity of native species from the Atlantic Forest has greatly advanced in the last two decades (Guidugli et al. 2010Guidugli MC, Accoroni KAG, Mestriner MA, Contel EPB, Martinez CA & Alzate-Marin AL (2010) Genetic characterization of 12 heterologous microsatellite markers for the giant tropical tree Cariniana legalis (Lecythidaceae) Genetic Molecular Biology 33: 131-134. ; Sheu et al. 2017Sheu Y, Cunha-Machado AS & Gontijo ABPL (2017) Genetic diversity of Bromeliaceae species from the Atlantic Forest. Genetics and Molecular Research 16: 1-8.; Paschoa et al. 2018Paschoa RP, Christ JA, Valente CS, Ferreira MFS, Miranda FD, Garbin ML & Carrijo TT (2018) Genetic diversity of populations of the dioecious Myrsine coriacea (Primulaceae) in the Atlantic Forest. Acta Botanica Brasilica 32: 376-385.), but is still insufficient for various groups of plants.
The suppression of forest fragments, may lead to loss of genetic diversity due to shrinkage of populations (Viegas et al. 2011Viegas MP, Silva CLSP, Moreira JP, Cardin LT, Azevedo VCR, Ciampi AY, Freitas MLM, Moraes MLT, Sebbenn AM (2011) Diversidade genética e tamanho efetivo de duas populações de Myracroduron rundeuva Fr. All. sob conservação ex situ. Revista Árvore 4: 769-779.). This process also leads to increase in genetic differentiation between populations, with crossings occurring between related individuals; thus, the natural evolution of the species is compromised and their capacity to adapt to environmental changes is reduced (Young & Boyle 2000Young AG & Boyle TJ (2000) Forest fragmentation. In: Young A, Boshier D & Boyle T (eds.) Forest conservation genetics: principles and practice. CSIRO Publishing, Melbourne. Pp. 123-135.). This scenario is particularly relevant for plant species endemic to the Atlantic Forest with local gregarious individual distribution or preferentially occurring in specific phytophysiognomies, such as the ombrophilous or semi-deciduous forests, as is the case of most Dorstenia L. species.
Dorstenia is the second largest genus of the family Moraceae, comprising more than one hundred species (Berg & Hijiman 1999Berg CC & Hijman MEE (1999) The genus Dorstenia (Moraceae). Ilicifolia 2: 1-211.) distributed in the Americas, Asia and Africa. Its representatives can be easily recognized by their herbaceous to sub-shrubby and development of inflorescences of coenanthium type (São José & Romaniuc-Neto 2016). Of the 42 species occurring in Brazil, 34 are found in the Atlantic Forest (BFG 2018BFG - The Brazil Flora Group (2018) Brazilian Flora 2020: innovation and collaboration to meet Target 1 of the Global Strategy for Plant Conservation (GSPC). Rodriguésia 69: 1513-1527.), often occupying the herbaceous stratum of forest fragments (Luber et al. 2016uber J, Tuler AC, Torres F, Christ JA, Guidoni-Martins KG, Zanetti M, Holunder RK, Manhães VC, Zorzanelli JPF, Mendonça ES, Garbin ML & Carrijo TT (2016) List of angiosperm species in an Atlantic Forest fragment reveals collection gaps in Espírito Santo state, Brazil. Check List 12: 1835. ). It has been reported that the inflorescences are visited by small insects (Berg 2001Berg CC (2001) Moreae, Artocarpeae and Dorstenia (Moraceae) with introductions to the family and Ficus and with additions and corrections to Flora Neotropica monograph 7. Flora Neotropica Monograph 83. New York Botanical Garden, New York. 348p.; Araújo 2008Araújo LM (2008) Biologia reprodutiva de espécies raras e ameaçadas de extinção de Dorstenia L. (Moraceae). Tese de Doutorado. Universidade Federal de Viçosa, Viçosa. 110p.) and the fruits are dispersed by gravity, close to the parent plants (Berg 2001Berg CC (2001) Moreae, Artocarpeae and Dorstenia (Moraceae) with introductions to the family and Ficus and with additions and corrections to Flora Neotropica monograph 7. Flora Neotropica Monograph 83. New York Botanical Garden, New York. 348p.). Yet, a knowledge gap exists regarding how the biological characteristics of Dorstenia species, in addition to the fragmentation of their natural environments in the Atlantic Forest, are influencing the genetic variability of their populations.
Studies related to genetic diversity in natural plant populations allow quantifying the distribution of the genetic variability in time and space (Ângelo et al. 2006Ângelo PCS, Chaves FCM, Bizzo HR, Xavier JJBN, Cruz JC & Lira MPS (2006) Genetic diversity in sacaca (Croton cajucara Benth.) accessed by RAPD markers. Revista Brasileira de Plantas Medicinais 8: 18-22.). Molecular markers enable the rapid and accurate identification of genetic diversity in a population, and have become efficient tools for conservation studies in plants (Pádua et al. 2016Pádua JAR, Brandão MM & Carvalho D (2016) Spatial genetic structure in natural populations of the overexploited tree Eremanthus erythropappus (DC.) MacLeish (Asteraceae). Biochemical Systematics and Ecology 66: 307-311.). Inter-simple sequence repeat (ISSR) markers are based on DNA amplification via polymerase chain reaction (PCR), and have been widely used in population genetics studies of various species (Trindade et al. 2012Trindade H, Sena I, Gonçalves S & Romano A (2012) Genetic diversity of wild populations of Tuberaria major (Cistaceae), an endangered species to the Algarve region (Portugal), using ISSR markers. Biochemical Systematics and Ecology 45: 49- 56.). As dominant markers, they do not differentiate between heterozygous and dominant homozygous individuals; still, they have the advantage of analyzing multiple loci in a single reaction (Goulão & Oliveira 2001Goulão L & Oliveira CM (2001) Molecular characterization of cultivars of apple (Malus x domestica Borkh.) using microsatellite (SSR and ISSR) markers. Euphytica 122: 81-89.), are widely reproducible and do not require previous knowledge about the genome of the studied species. The present work aimed to characterize the genetic diversity and structure of Dorstenia elata Hook. in an Atlantic Forest remnant.
Material and Methods
Sampling and study area
Dorstenia elata is an autogamous and autochorous species, endemic to the Atlantic forest (Judd et al. 2002Judd WS, Campbell CS, Kellog EA & Stevens PF (2002) Plant systematics: a phylogenetic approach. Sinauer Associates Inc. Publishers, Sunderland. 576p.). The studied was conducted in an Atlantic Forest remnant located to the south of the state of Espírito Santo, Brazil (22°35’54”S, 41°10’53”W; Fig. 1). The area of the study comprises a Lowland Ombrophilous Forest, with mean annual precipitation of 1,200 mm (Oliveira-Filho et al. 2005Oliveira-Filho AT, Tameirão-Neto E, Carvalho WAC, Werneck M, Brima AE, Vidal CV, Rezende SC & Pereira JAA (2005) Análise florística do compartimento arbóreo de áreas de Floresta Atlântica sensu lato na região das Bacias do Leste (Bahia, Minas Gerais, Espírito Santo e Rio de Janeiro). Rodriguésia 56: 185-235.), and elevation ranging between 100 m and 800 m (Luber et al. 2016). Three clusters of individuals from the species were studied, here designated as Local 1 (n = 22 specimens), Local 2 (n = 21) and Local 3 (n = 21), for a total of 64 individuals. There was a distance of 260 meters between Local 1 and 2, 450 meters between Local 2 and 3, and 710 meters between the Local 1 and 3. There is a road between Local 2 and 3. This sample represents the total or near-total of individuals existing in each local studied. Leaf samples from healthy specimens were collected and stored in pre-labeled paper bags containing silica.

a-c. Location map of the study area – a. municipality of Castelo, highlighting the area of study; b. state of Espírito Santo, highlighting the municipality of Castelo; c. map of Brazil, highlighting the state of Espírito Santo.
DNA extraction and ISSR analysis
The DNA extraction was performed according to protocol of Doyle & Doyle (1990)Doyle J & Doyle J (1990) Isolation of plant DNA from fresh tissue. Focus 12: 13-15. , with some modifications proposed by the Agronomic Institute of Campinas (IAC). First, approximately 200 mg of leaves were macerated in liquid nitrogen, and the obtained powder was transferred to labeled 2 mL microtubes. In quick succession, 700 μL of extraction buffer were added and the tubes were shaken on a vortex device. Another 700 μL of buffer were subsequently added to each tube, followed by another agitation round to achieve complete homogenization. The tubes were then incubated in water bath at 65 °C for 40 min, being shaken every 10 min. Next, the tubes were centrifuged at 12,000 rpm for 10 minutes, resulting in the formation of two phases. The supernatant was transferred to fresh 2 mL tubes, and 660 μL of chloroform: isoamyl alcohol (24:1) were added to each tube. The tubes were agitated for 5 minutes through manual inversion, and again centrifuged at 12,000 rpm for 12 min. The resulting supernatant was transferred to new 1.5 mL tubes, and 600 μL of cold isopropyl alcohol were added. Subsequently, a new centrifugation was performed for 15 min at 12,000 rpm. The formed precipitate was washed three times with 500 μL of 70% ethanol. The alcohol was discarded, and the pellet was kept at room temperature for 15 min to dry. At last, the DNA was resuspended in TE buffer (10 mM Tris, 1 mM EDTA) containing RNAse (10 μg.mL-1) and incubated at 37 °C. The DNA concentration and quality were estimated in a NanoDrop 2000c spectrophotometer.
A total of 25 ISSR primers were used in the molecular analyses. The amplification reactions were performed in PCR plates with a final volume of 20 μL per sample, each containing 20 ng of DNA; 0.25 μmol.L-1 of each dNTP; 0.2 μmol.L-1 of primer; 10 mmol.L-1 of Tris-HCl (pH 8.5); 2.4 mmol.L-1 of MgCl2; and 0.2 U of Taq DNA polymerase (Fermentas®). The amplifications were carried out in a VeritiTM thermocycler (Applied Biosystems). The program used to amplify the fragments consisted of the following steps: Initial denaturation at 94 °C for 5 minutes; 35 cycles, each comprising denaturation at 94 °C for 45 seconds, annealing at 52 °C for 45 seconds and extension at 72 °C for 90 seconds; a final extension at 72 °C for 7 minutes; and cooling at 4 °C. The amplification products were separated via electrophoresis in 2.5% agarose gel at 100 V for 4 hours. Subsequently, the fragments were stained with ethidium bromide (0.25 μg/mL), exposed to ultraviolet light, and photographed using a Biorad® Gel Doc XR photodocumentation system. All analyses were carried out at the Laboratory of Biochemistry and Molecular Biology at the Centro de Ciências Agrárias e Engeharias (CCAE) - Universidade Federal do Espírito Santo (UFES).
Data analysis
The amplified products were evaluated by the presence (1) or absence (0) of polymorphic bands for each subpopulation in a binary matrix. The Jaccard index was used to calculate the genetic dissimilarity among the individuals. The genetic dissimilarity mean was used to analyze the 64 individuals by Unweighted Pair-Group Method with Arithmetic Mean (UPGMA). The cutoff was defined using the coefficient of Mojema (1977)Mojema R (1977) Hierarchical grouping methods and stopping rules: an evaluation. The Computer Journal 20: 359-363.. The cophenetic correlation was done to verify the reliability of the data between the matrices of dissimilarity and the graphic grouping data. All the above analyses were performed with the program GENES (Cruz 2016Cruz CD (2016) Genes software - extended and integrated with the R, Matlab and Selegen. Acta Scientiarum 38: 547-552.).
To estimate the variance within and among populations, an analysis of molecular variance (AMOVA) was carried out (Excoffier et al. 1992Excoffier L, Smouse PE & Quattro JM (1992) Analysis of molecular variance inferred from metric distances among DNA haplotypes: application to human mitochondrial DNA restriction data. Genetics 131: 479-491.) using the program Arlequin version 3.11. The Shannon index was estimated with the program POPGENE version 1.32 (Yeh et al. 1999Yeh F, Yang R & Boyle T (1999) Popgene Version 1.32 Microsoft Windows-based freeware for populations genetic analysis. University of Alberta, Edmonton. Available at <https://sites.ualberta.ca/~fyeh/popgene.html>.
https://sites.ualberta.ca/~fyeh/popgene....
). Parameters for dominant diploid data were used, with the statistics of genetic variation for each subpopulation calculated according to Nei (1987)Nei M (1987) Molecular evolutionary genetics. Columbia University Press, New York. 505p.. In addition, an analysis of gene diversity was performed in the populations by Nei’s method (1987), and the values for total heterozygosity (HT), mean genetic diversity (HS) and gene flow (Nm) were estimated. The Bayesian grouping was achieved with the software Structure (Pritchard et al. 2000Pritchard JK, Stephens M & Donnelly P (2000) Inference of population structure using multilocus genotype data. Genetics 155: 945-959.). The program was executed for 10,000 interactions in order to test the population subdivision from k = 1 to k = 6, and thus verify any possible subdivision. Twenty runs were performed for each k value. The number of genetic groups was estimated by the delta K (DK) value (Evanno et al. 2005Evanno G, Regnaut S & Goudet J (2005) Detecting the number of clusters of individuals using the software Structure: a simulation study. Molecular Ecology 14: 2611-2620. ) using the software Structure Harvester (Earl & von Holdt 2012Earl DA & von Holdt BM (2012) Structure Harvester: a website and program for visualizing structure output and implementing the Evanno method. Conservation Genetic Resource 4: 359-361. ).
Results
Intrapopulation diversity
Of the 25 ISSR primers tested to evaluate the genetic diversity in Dorstenia elata (Tab. 1), the twelve most polymorphic ones were selected. The twelve used primers allowed obtaining 119 amplified fragments. The number of fragments per primer varied from 3 (UBC 811 - sample local 1) to 13 (UBC 808 - sample local 3), with a mean number of 7.9 fragments. According to Jaccard’s arithmetic complement in the dissimilarity matrix, the individuals 12 (sample local 1) × 52 (sample local 3) were the most divergent (Cluster Diameter- CD = 0.86957), and 35 (sample local 2) × 36 (sample local 2) were the closest (CD = 0.07843). The cophenetic correlation coefficient (CCC) demonstrated an association of 87.15% between the distances obtained on the dissimilarity matrix (Jaccard’s complement) and the cophenetic matrix. The fragments obtained in this study by means of ISSR markers were also employed to construct a dendrogram based on the UPGMA grouping, using the genetic distances between the pairs of individuals (Fig. 1). Two distinct groups can be observed, the first containing the subpopulations 1 and 2 and the second comprising the subpopulation 3. The Shannon index varied from 0.456 to 0.6931 among the populations, with a mean of 0.5106 (Tab. 2).
Shannon Index of the three subpopulations and final mean value for the three subpopulations of Dorstenia elata from Atlantic Forest fragment of Espírito Santo, Brazil.
Genetic differentiation among populations
Through AMOVA, the genetic variation was partitioned into two levels: within populations and among populations (Tab. 3). The value for genetic differentiation among populations (ΦST) was 0.4247, indicating remarkably high differentiation. Accordingly, 57.52% of the variation was attributed to diversity within the populations, and the remaining 42.48% to diversity among populations. Nei’s genetic diversity (1987) was 0.2467 (GST = 0.24) among the populations; thus, it can be inferred that the sampled variability contributed with 24% to the total heterozygosity, and therefore 76% of the genetic variability is distributed within the populations. The dendrogram obtained from the genetic distances among the subpopulations is presented in Figure 2.
Analysis of molecular variance among the three subpopulations of Dorstenia elata from Atlantic Forest fragment of Espírito Santo, Brazil.

Dendrogram obtained through UPGMA method based on the genetic distances expressed by the complement of Jaccard’s coefficient for the three subpopulations of Dorstenia elata from Atlantic Forest fragment of Espírito Santo, Brazil. Pink = Group 1; blue = Group 2 (Programa Genes - Cruz 2016Cruz CD (2016) Genes software - extended and integrated with the R, Matlab and Selegen. Acta Scientiarum 38: 547-552.).
Partitioning of the genetic variation of the populations was also verified by grouping of individuals in Bayesian clusters. The verified genetic markers defined the correct number of groups, based on the rate of change in Ln(k), ΔK statistics, indicating convergence for two Bayesian groups (K = 2) (Fig. 3). Overall, the genetic characteristics obtained with the molecular markers ISSR demonstrated that the two genetic groups occurred in the different proportion in the three aggregates; subpopulations 1 and 2 are represented mainly by the color red, while subpopulation 3 is represented by the color green, with few components of the red genetic group. (Fig. 4). However, there was no formation of a specific group for each locality.
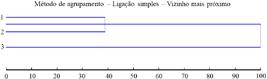
Analysis of hierarchical grouping by the simple linkage - nearest neighbor method, based on the rate of change in DK value for the three subpopulations of Dorstenia elata from Atlantic Forest fragment of Espírito Santo, Brazil.

Bar graph showing the two genetic groups identified by the analysis (k = 2). Red = Group 1; green = Group 2. The numbers 1, 2 and 3 correspond to the aggregates of individuals from each collected subpopulation.
Discussion
Intrapopulation diversity
The number of polymorphic fragments generated by the primers in this study can be considered sufficient for the evaluation of genetic diversity in the species, as the obtained CCC = 0.87 indicates good adjustment between the dissimilarity matrix and the generated dendrogram. According to Vaz Patto et al. (2004)Vaz Patto MC, Satovic Z, Pêgo S & Fevereiro P (2004) Assessing the genetic diversity of Portuguese maize germoplasm using microsatellite markers. Euphytica 137: 63- 72., values above 0.56 reflect adequate concordance between the matrices, meaning that the value obtained here was satisfactory. Therefore, it could be inferred that subpopulations 1 and 2 present higher similarity, which indicates greater gene flow between them. In turn, the most distant individuals were identified among specimens from the subpopulations 1 and 3, that are distant 710 meters from each other, demonstrating lower similarity between them, and consequently lower gene flow.
Studying the genetic diversity in two natural populations of candeia [Eremanthus erythropappus (DC.) MacLeish] by means of RAPD marker, Estopa et al. (2006)Estopa RA, Souza AM, Moura COM, Botrel MCG, Mendonça EG & Carvalho D (2006) Diversidade genética em populações naturais de candeia [Eremanthus erythropappus (DC.) MacLeish]. Scientia Florestalis 70: 97-106. demonstrated that the genetic distance can be influenced by the geographical distance, i.e. it can be associated to the distribution of individuals in the areas by reason of the dispersal mode. In the present study, the geographical distance influenced the crossing of individuals among the aggregates, suggesting that the closer the subpopulations are geographically, the smaller the genetic distance between them.
The populations sampled in areas that can be more affected by anthropic activity (SubPop 1 and 2), as they are easily accessible, presented lower values of genetic diversity (Shannon index of 0.3169 and 0.3466, respectively) when compared to SubPop 3 (Shannon index = 0.4841) (Tab. 2).
Genetic differentiation among populations
The pollination of Dorstenia is entomophilic, mainly accomplished by flies or wasps (Berg 2001Berg CC (2001) Moreae, Artocarpeae and Dorstenia (Moraceae) with introductions to the family and Ficus and with additions and corrections to Flora Neotropica monograph 7. Flora Neotropica Monograph 83. New York Botanical Garden, New York. 348p.), and the dispersal of diaspores is autochoric. Therefore, this study suggests that pollination may be more responsive than fruit dispersal in D. elata concerning the variability among the studied natural populations. Pollination appears to be the agent responsible for the connection between populations, given the impossibility of long-distance dispersal of the diaspores. These results indicate the importance of the connectivity between the forest fragments to maintain the genetic variability in this species.
Through the GST analyses (Fig. 3), it was possible to demonstrate the separation of the individuals in two groups, one comprising the subpopulations 1 and 2 and the other containing the subpopulation 3. Therefore, the geographical distance may be influencing the distribution of individuals in the study area.
According to Wright (1951)Wright S (1951) The genetical structure of populations. Annual of Eugenics 15: 313- 354., values of FST corresponding to GST from 0.00 to 0.05 indicate low genetic differentiation; values from 0.051 to 0.15 express moderate genetic differentiation; and values above 0.15 point to high genetic differentiation. The values of genetic differentiation found in the present work can be considered high enough to infer the occurrence of differentiation among populations.
Mathematically, the statistics ΦST is equivalent to the value of GST, being applicable to different levels of hierarchical classification, such as populations within a geographical region or subpopulations within populations, as seen here. Despite the difference in values found in the two analyses, both show that the greater part of the genetic variability is concentrated within the subpopulations.
The historical gene flow estimated among the populations of D. elata was 1.5271, considered to be low. When gene flow among populations or subpopulations exceeds four migrants per generation, homogenization of the alleles occurs, and the populations thus function as panmictic. The results of the present work show that the gene flow was not sufficient to counteract the effects of genetic drift, which may be related to the isolation of the subpopulations because of forest fragmentation.
The genetic divergence obtained through the estimates of GST for the subpopulations of D. elata suggests the existence of significant genetic drift, since the obtained value (11.8%) was superior to that found in species with allogamous reproductive system (Loveless & Hamrick 1984Loveless MD & Hamrick JL (1984) Ecological determinants of genetic structure in plant populations. Annual Review of Ecology, Evolution, and Systematics 15: 65-95.; Moraes & Derbyshire 2002Moraes PLR & Derbyshire MTVC (2002) Estrutura genética de populações naturais de Cryptocarya aschersoniana Mez (Lauraceae) através de marcadores isoenzimáticos. Biota Neotropica 2: 1-19.). This may be due to the low rates of gene flow among the subpopulations, which may thus fit the scenario where genetic drift overcomes the effects of gene flow.
The results from the analysis of genetic variation partitioning are in agreement with the assessment of genetic dissimilarity, which was calculated using the UPGMA method (Fig. 2) as well as Nei’s genetic distance, obtained by the simple linkage method (Fig. 3). According to Zanella et al. (2012)Zanella CM, Janke A, Palma-Silva C, Kaltchuk-Santos E, Pinheiro FG, Paggi GM, Soares LES, Goetze M, Buttow MV & Bered F (2012) Genetics, evolution and conservation of Bromeliaceae. Genetics and Molecular Biology 35: 1020-1026., the combination of spatial distribution of the individuals and reproduction system may influence the levels of diversity, the homogenization of the populations, and hence increase the divergence among them. Overall, the obtained results suggest high distinction among the three populations based on the genetic differentiation value of ΦST = 0.4247, possibly indicating a state of isolation among them.
ISSR markers proved to be suitable for analysis of genetic diversity in D. elata, identifying high levels of intrapopulation polymorphism. The genetic diversity estimated by the indices of Shannon and Nei presented elevated values, which may be related to the good conservation status of the species in the sampled areas. The genetic differentiation among the populations is remarkably high, probably indicating very low historical gene flow among the sampled areas. Gene flow is present within the populations and contributes to the maintenance of the genetic diversity and preservation of the species in its habitat.
Acknowledgements
We would like to thank the Coordenação de Aperfeiçoamento de Pessoal de Nível Superior - Brasil (CAPES) - Finance Code 001, for scholarship granted to L.A.R. Martins and R.M. Lorenzoni. We further thank the Conselho Nacional de Desenvolvimento Científico e Tecnológico (CNPq), for the productivity fellowships to T.C.B. Soares and T.T. Carrijo (“Bolsa de Produtividade em Pequisa”), and for the scholarship granted to R.M. Pereira Júnior. T.T. Carrijo is also thanks to FAPES, for a research grant (“Taxa de Pesquisa”).
References
- Ângelo PCS, Chaves FCM, Bizzo HR, Xavier JJBN, Cruz JC & Lira MPS (2006) Genetic diversity in sacaca (Croton cajucara Benth.) accessed by RAPD markers. Revista Brasileira de Plantas Medicinais 8: 18-22.
- Araújo LM (2008) Biologia reprodutiva de espécies raras e ameaçadas de extinção de Dorstenia L. (Moraceae). Tese de Doutorado. Universidade Federal de Viçosa, Viçosa. 110p.
- Berg CC (2001) Moreae, Artocarpeae and Dorstenia (Moraceae) with introductions to the family and Ficus and with additions and corrections to Flora Neotropica monograph 7. Flora Neotropica Monograph 83. New York Botanical Garden, New York. 348p.
- Berg CC & Hijman MEE (1999) The genus Dorstenia (Moraceae). Ilicifolia 2: 1-211.
- BFG - The Brazil Flora Group (2018) Brazilian Flora 2020: innovation and collaboration to meet Target 1 of the Global Strategy for Plant Conservation (GSPC). Rodriguésia 69: 1513-1527.
- Cruz CD (2016) Genes software - extended and integrated with the R, Matlab and Selegen. Acta Scientiarum 38: 547-552.
- Doyle J & Doyle J (1990) Isolation of plant DNA from fresh tissue. Focus 12: 13-15.
- Earl DA & von Holdt BM (2012) Structure Harvester: a website and program for visualizing structure output and implementing the Evanno method. Conservation Genetic Resource 4: 359-361.
- Estopa RA, Souza AM, Moura COM, Botrel MCG, Mendonça EG & Carvalho D (2006) Diversidade genética em populações naturais de candeia [Eremanthus erythropappus (DC.) MacLeish]. Scientia Florestalis 70: 97-106.
- Evanno G, Regnaut S & Goudet J (2005) Detecting the number of clusters of individuals using the software Structure: a simulation study. Molecular Ecology 14: 2611-2620.
- Excoffier L, Smouse PE & Quattro JM (1992) Analysis of molecular variance inferred from metric distances among DNA haplotypes: application to human mitochondrial DNA restriction data. Genetics 131: 479-491.
- Goldenberg R, Reginato M & Michelangeli FA (2020) Miconia lucenea (Melastomatacea), a new species from montane Atlantic Forest in Espírito Santo, Brazil. PeerJ 8: e8752.
- Goulão L & Oliveira CM (2001) Molecular characterization of cultivars of apple (Malus x domestica Borkh.) using microsatellite (SSR and ISSR) markers. Euphytica 122: 81-89.
- Guidugli MC, Accoroni KAG, Mestriner MA, Contel EPB, Martinez CA & Alzate-Marin AL (2010) Genetic characterization of 12 heterologous microsatellite markers for the giant tropical tree Cariniana legalis (Lecythidaceae) Genetic Molecular Biology 33: 131-134.
- Judd WS, Campbell CS, Kellog EA & Stevens PF (2002) Plant systematics: a phylogenetic approach. Sinauer Associates Inc. Publishers, Sunderland. 576p.
- Loveless MD & Hamrick JL (1984) Ecological determinants of genetic structure in plant populations. Annual Review of Ecology, Evolution, and Systematics 15: 65-95.
- uber J, Tuler AC, Torres F, Christ JA, Guidoni-Martins KG, Zanetti M, Holunder RK, Manhães VC, Zorzanelli JPF, Mendonça ES, Garbin ML & Carrijo TT (2016) List of angiosperm species in an Atlantic Forest fragment reveals collection gaps in Espírito Santo state, Brazil. Check List 12: 1835.
- Mojema R (1977) Hierarchical grouping methods and stopping rules: an evaluation. The Computer Journal 20: 359-363.
- Moraes PLR & Derbyshire MTVC (2002) Estrutura genética de populações naturais de Cryptocarya aschersoniana Mez (Lauraceae) através de marcadores isoenzimáticos. Biota Neotropica 2: 1-19.
- Myers N, Mittermeier RA, Mittermeier CG, Fonseca GAB & Kent J (2000) Biodiversity hotspots for conservation priorities. Nature 403: 853-858.
- Nei M (1987) Molecular evolutionary genetics. Columbia University Press, New York. 505p.
- Oliveira-Filho AT, Tameirão-Neto E, Carvalho WAC, Werneck M, Brima AE, Vidal CV, Rezende SC & Pereira JAA (2005) Análise florística do compartimento arbóreo de áreas de Floresta Atlântica sensu lato na região das Bacias do Leste (Bahia, Minas Gerais, Espírito Santo e Rio de Janeiro). Rodriguésia 56: 185-235.
- Pádua JAR, Brandão MM & Carvalho D (2016) Spatial genetic structure in natural populations of the overexploited tree Eremanthus erythropappus (DC.) MacLeish (Asteraceae). Biochemical Systematics and Ecology 66: 307-311.
- Paschoa RP, Christ JA, Valente CS, Ferreira MFS, Miranda FD, Garbin ML & Carrijo TT (2018) Genetic diversity of populations of the dioecious Myrsine coriacea (Primulaceae) in the Atlantic Forest. Acta Botanica Brasilica 32: 376-385.
- Pritchard JK, Stephens M & Donnelly P (2000) Inference of population structure using multilocus genotype data. Genetics 155: 945-959.
- Sao-Jose PA & Romaniuc-neto S (2016) Diversidade de Dorstenia L. (Moraceae) do estado de São Paulo, Brasil. Hoehnea [online] 43: 247-264.
- Sebbenn AM, Carvalho ACM, Freitas MLM, Moraes SMB, Gaino APSC, Silva JM, Jolivet C & Moraes MLT (2011) Low levels of realized seed and pollen gene flow and strong spatial genetic structure in a small, isolated and fragmented population of the tropical tree Copaifera langsdorffii Desf. Heredity 106: 134-145.
- Sheu Y, Cunha-Machado AS & Gontijo ABPL (2017) Genetic diversity of Bromeliaceae species from the Atlantic Forest. Genetics and Molecular Research 16: 1-8.
- Trindade H, Sena I, Gonçalves S & Romano A (2012) Genetic diversity of wild populations of Tuberaria major (Cistaceae), an endangered species to the Algarve region (Portugal), using ISSR markers. Biochemical Systematics and Ecology 45: 49- 56.
- Vaz Patto MC, Satovic Z, Pêgo S & Fevereiro P (2004) Assessing the genetic diversity of Portuguese maize germoplasm using microsatellite markers. Euphytica 137: 63- 72.
- Viegas MP, Silva CLSP, Moreira JP, Cardin LT, Azevedo VCR, Ciampi AY, Freitas MLM, Moraes MLT, Sebbenn AM (2011) Diversidade genética e tamanho efetivo de duas populações de Myracroduron rundeuva Fr. All. sob conservação ex situ Revista Árvore 4: 769-779.
- Wright S (1951) The genetical structure of populations. Annual of Eugenics 15: 313- 354.
- Yeh F, Yang R & Boyle T (1999) Popgene Version 1.32 Microsoft Windows-based freeware for populations genetic analysis. University of Alberta, Edmonton. Available at <https://sites.ualberta.ca/~fyeh/popgene.html>.
» https://sites.ualberta.ca/~fyeh/popgene.html - Young AG & Boyle TJ (2000) Forest fragmentation. In: Young A, Boshier D & Boyle T (eds.) Forest conservation genetics: principles and practice. CSIRO Publishing, Melbourne. Pp. 123-135.
- Zanella CM, Janke A, Palma-Silva C, Kaltchuk-Santos E, Pinheiro FG, Paggi GM, Soares LES, Goetze M, Buttow MV & Bered F (2012) Genetics, evolution and conservation of Bromeliaceae. Genetics and Molecular Biology 35: 1020-1026.
Edited by
Publication Dates
-
Publication in this collection
27 Sept 2021 -
Date of issue
2021
History
-
Received
22 May 2020 -
Accepted
28 Sept 2020


