Abstract
The aerial growth dynamics of the shoots of the widespread turfgrass Paspalum vaginatum was studied. With the aim of identifying quantitative differential features between two genotypes, plants were cultivated outdoors in pots during two consecutive summers. Axes of different branching order were marked for periodical observation to quantify internode production rate, axis production rate, covering rate and reproductive effort. The genotypes differed significantly in the following quantitative features: plagiotropic vs. orthotropic axes proportion, internode production rate, flowering vs. vegetative tiller ratio, vegetative cover and spatial distribution of the canopy. Knowledge of these features may help to understand the great plasticity and adaptability of this species to multiple environmental conditions.
Key words:
meristem allocation; morphology; phenotypic plasticity; plant architecture; seashore paspalum
Resumo
Foi estudada a dinâmica do crescimento dos caules aéreos de Paspalum vaginatum, uma gramínea de ampla distribuição. Com o objetivo de identificar características diferenciais quantitativas entre dois genótipos, as plantas foram cultivadas ao ar livre em vasos durante dois verões consecutivos. Os eixos de diferentes ramificações foram marcados para observação periódica para quantificar a taxa de produção de entrenós, taxa de crescimento do eixo principal, taxa de cobertura e esforço reprodutivo. Os genótipos diferiram significativamente nas seguintes características quantitativas: proporção de eixos plagiotrópicos vs. ortotrópicos, taxa de produção de entrenós, proporção de eixos reprodutivos vs. vegetativos, cobertura vegetal e distribuição espacial do canópia. O conhecimento dessas características pode ajudar a compreender a grande plasticidade e adaptabilidade desta espécie a múltiplas condições ambientais.
Palavras-chave:
alocação de meristemas; morfologia plasticidade arquitetura da planta; seashore paspalum
Introduction
In Poaceae, branching types are relatively varied in terms of the growing direction of the stems and their subsequent orientation relative to the ground. This characteristic seems to be correlated with the ecological behavior of the species (Serebryakova 1969Serebryakova TI (1969) Vetvlenie i Kutsenie v Semeistve Poaceae. Botanicheskii Zhurnal 54: 858-871.), e.g. stolons and rhizomes of many herbs that allow adaptation to different environments, even extremely unfavorable ones. The capacity of these species to subsist and take advantage of the environment resources is directly related to the architecture of the plant, the position of their buds and the storage of nutrients (Bell & Tomlinson 1980Bell AD & Tomlinson PB (1980) Adaptive architecture in rhizomatous plants. Botanical Journal of the Linnean Society 80: 125-160.). Studies in vegetal architecture try to understand the form of the plant and the nature and distribution of their parts, and to explain the actual plant form as a trade-off between the endogenous development processes and those resulting from environmental effects (Barthélémy & Caraglio 2007Barthélémy D & Caraglio Y (2007) Plant architecture: a dynamic, multilevel and comprehensive approach to plant form, structure and ontogeny. Annals of Botany 99: 375-407.). The architecture of a grass lawn is continually changing and is a function of the tiller morphology and distribution within the tiller population. Quantification of tiller features and tiller production provides useful information for understanding these architectural changes in the grass sward (Mitchell & Moser 2000Mitchell RB & Moser LE (2000) Developmental morphology and tiller dynamics of warm-season grass swards. In: Moore KJ &Anderson BE (eds.) Native warm-season grasses. Research Trends and Issues. CSSA Special Publication 30. CSSA/ASA, Madison. Pp 49-66.).
Paspalum vaginatum Sw. is a perennial warm-season grass with large stolons and rhizomes that is distributed in tropical and subtropical regions worldwide, between 30-35º N-S latitude (Burkart et al. 1990Burkart SE, León RJC & Movia CP (1990) Inventario fitosociológico del pastizal de la Depresión del Salado (Prov. Bs. As.) en un área representativa de sus principales ambientes. Darwiniana 30: 27-69.; Zuloaga & Morrone 2005Zuloaga FO & Morrone O (2005) Revisión de las especies de Paspalum para América del Sur Austral (Argentina, Bolivia, Sur del Brasil, Chile, Paraguay y Uruguay). Monographs in Systematic Botany. Vol. 102. Missouri Botanical Garden Press, Saint Louis. 297p.). Commonly known as seashore paspalum, it plays important ecological and utilitarian roles such as dune stabilization, erosion control, lawn in sport fields and animal forage. Moreover, it is a well-known turfgrass primarily recommended for coastal golf courses because of its tolerance to multiple stress factors such as salinity, drought and waterlogging, its ability to tolerate ranges of water sources and soil pH, its efficiency for nutrient uptake (Duncan & Carrow 2000Duncan RR & Carrow RN (2000) Seashore Paspalum. The environmental turfgrass. Ann Arbor Press, Chelsea. Pp. 281.) and its wide tolerance to freezing stress events (Fabbri et al. 2016aFabbri LT, Ploschuk EL, López MV, Insausti P & Rua GH (2016a) Freeze tolerance differs between two ecotypes of Paspalum vaginatum ( Poaceae ). Acta Botanica Brasilica 30: 152-156.). It is also highly efficient to colonise open spaces and to form dense populations in saline environments where other species may not grow (Anderson & Ehringer 2000Anderson J & Ehringer NJ (2000) Ecological uses for Paspalum vaginatum (Swartz) seashore paspalum. In: Cannizzaro PJ (ed.) Proceedings of the 27th annual conference of ecosystem restoration and creation. Hillsborough Community College, Tampa. Pp. 10-13.). Its vegetative features are strongly responsible for the invasive nature of P. vaginatum when it is introduced into natural ecosystems, where it affects biodiversity by reducing the establishment of other species (Campos et al. 2004Campos JA, Herrera M, Biurrun I & Loidi J (2004) The role of alien plants in the natural coastal vegetation in central-northern Spain. Biodiversity and Conservation 13: 2275-2293.; Riefner & Columbus 2008Riefner RE & Columbus JT (2008) Paspalum vaginatum (Poaceae), a new threat to wetland diversity in southern California. Journal of the Botanical Research Institute of Texas 2: 743-759.; Riefner et al. 2010Riefner RE, Denham SS & Columbus JT (2010) Paspalum pubiflorum and P. quadrifarium (Poaceae) new to California, with a key and notes on invasive species. Journal of the Botanical Research Institute of Texas 4: 761-770.).
In a detailed architectural analysis of two accessions of P. vaginatum, a wild genotype and a commercial cultivar (Fabbri et al. 2016bFabbri LT, Perreta MG & Rua GH (2016b) Spatial structure and development of Paspalum vaginatum (Poaceae): an architectural approach. Australian Journal of Botany 64: 153-159.), showed that qualitative morphological characters were constant regardless the genotype. They share similar architectural pattern as they produce stems with different orientation: orthotropic, plagiotropic stoloniferous and plagiotropic rhizomatous. In this paper, some quantitative morphological traits were analysed comparatively on the same accessions of P. vaginatum mentioned in the previous study. We predicted that under similar environmental conditions, it is possible to differentiate P. vaginatum genotypes by comparing different combinations of shoot production that may determine different canopy heights and different clump production.
Materials and Methods
Plants from two accessions of P. vaginatum were cultivated during two consecutive growing periods, 2006-2007 and 2007-2008, in the experimental garden of the Facultad de Agronomía, Universidad de Buenos Aires, Argentina (34°35'S, 58°29'W): (1) a wild genotype (Wg) from the Flooding Pampa grassland (Argentina: Prov. Buenos Aires, Pila; BAA 26686, 26689) and (2) a commercial cultivar (Cc) originated in Florida (USA; BAA 26687, 26690) by clonation of a natural mutant, and patented as Sea Isle 2000 by the University of Georgia Research Foundation.
Plants were obtained by vegetative division of one individual (genet) of each genotype, taking advantage of the characteristic clonal growth of this species (Rua & Gróttola 1997Rua GH & Gróttola MC (1997) Growth form models within the genus Paspalum L. (Poaceae, Paniceae). Flora 192: 65-80.). Details about collection place and propagation method are provided in Fabbri et al. (2016b)Fabbri LT, Perreta MG & Rua GH (2016b) Spatial structure and development of Paspalum vaginatum (Poaceae): an architectural approach. Australian Journal of Botany 64: 153-159..
Sixteen plants from each genotype were cultivated in plastic pots (12 cm diameter × 12 cm depth) filled with a mixture of organic soil and sand (9:1 v/v). After 7 days of establishment in a greenhouse (with natural sunlight as light source and temperature of 16.2 ±5 ºC), plants were exposed outdoors and transferred to containers. Each container (58 cm × 38.5 cm × 30 cm depth) was filled with the same substrate used in the small pots. To obtain a fast covering, two plants were placed in each container and were watered daily to field capacity.
Axes of sequential branching order (A1, A2, A3, A4, and A5 axes) arising from the proximal axillary buds of the long-internode zone (Fig. 1) were selected and marked with plastic cords of different colors (Fig. 2a). Internode and branch production were recorded every 7-10 days and data per container were obtained from at least four replicates per axis of different branching order. Observations of aerial axis production were scored from the initial stage, when they grew in small pots, until the stolons completely covered the surface of the containers. After the growing period, all plants were removed from the containers, and their axes were separated by water pressure and carefully washed to allow observation. The same procedure was repeated the following year using eight plants per accession. Due to breakage and partial loss of many axes during the manipulation process, it was not possible to study the rhizome growth system.
Aerial branching system of Paspalum vaginatum with axes of consecutive order (A1, A2, A3, A4, A5) showing the placement of clumps (C) and flowering units (FU). (Redrawn from Fabbri et al. 2016bFabbri LT, Perreta MG & Rua GH (2016b) Spatial structure and development of Paspalum vaginatum (Poaceae): an architectural approach. Australian Journal of Botany 64: 153-159.).
a. Plagiotropic axis with several orthotropic axillary branches. Arrows point to plastic cords used to trace axis growth. Scale bar = 1 cm. b. Definition of layers to estimate coverage frequency in a canopy of Paspalum vaginatum.
The first growing period (gp1) began the fourth week of November (spring in the Southern Hemisphere) and data of eight replications (containers) were scored at eleven dates until final February. The second growing period (gp2) began the second week of December, and data of four replications were obtained at eight dates until final February. The maximum daily temperatures averaged over 27°C during both experimental periods. The gp1 was characterised by high rainfall frequency with peaks of 140 and 170 mm and low values of vapour pressure deficit (VPD < 1 kPa), while the gp2 registered low rainfall frequency with ± 40 mm as the maximun rainfall and high evaporative demand (VPD = 2 kPa).
To compare growth patterns between the genotypes, number of internodes and orthotropic versus plagiotropic stem production were registered at all dates. At the end of the growing season a set of characters was recorded: (a) length of the 15 proximal internodes in A2 and A3 axes, (b) length of the 10 proximal internodes in A4 axes, (c) number of axillary and apical reproductive shoots and (d) total production of aerial shoots (vegetative + reproductive). These data were used for estimate reproductive effort, defined as the proportion of reproductive structures (Weiner 2004Weiner J (2004) Allocation, plasticity and allometry in plants. Perspectives in Plant Ecology, Evolution and Systematics 6: 207-215.).
Vertical distribution of the plant cover was estimated by the point-quadrat method (Greig-Smith 1983Greig-Smith P (1983) Quantitative plant ecology. University of California Press, Berkeley. Pp. 359.; Insausti et al. 1999Insausti P, Chaneton EJ & Soriano A (1999) Flooding reverted grazing effects on plant community structure in mesocosms of lowland grassland. Oikos 84: 266-276.) using a wooden frame supporting 10 steel rods 60 cm long sharpened to a point and spaced every 5 cm. Measurements were taken in eight containers per genotype in the gp1 and four containers in the gp2. Thirty sampling points were systematically arranged in six rows in a 25 × 20 cm grid located at the centre of each container to avoid border effects. Pins were lowered vertically through the canopy and the height of every contact with the foliage was recorded. The total number of hits was used to provide the cover estimation of both genotypes. To characterise vertical foliage arrangement, hits for each genotype were grouped into five height layers above-ground: 0-1 cm, 1-3 cm, 3-7 cm, 7-14 cm and 14-20 cm (Fig. 2b). This methodology was also used to estimate both the total coverage through the totality of hits per container and the reproductive stem production.
Data were statistically analysed using Infostat (Di Rienzo et al. 2015Di Rienzo JA, Casanoves F, Balzarini MG, Gonzalez L, Tablada M & Robledo CW (2015) InfoStat. Available at <http://www.infostat.com.ar/>. Access on December 2017.
http://www.infostat.com.ar/...
) and SAS (SAS 1990SAS (1990) SAS/STAT Software: users's guide. Version 6. Vol. 2. SAS Institute, Cary.). The proportion between orthotropic and total axis production was analysed with Wilson'score interval by an inference table for binomial proportions (Wilson 1927Wilson EB (1927) Probable inference, the law of succession, and statistical inference. Journal of the American Statistical Association 22: 209-212.). Second order polynomial curves were fitted to observed cumulative numbers of internodes of A2 and A3 shoots by means of a first order autoregressive model, with genotype and time as fixed effects on the gp1,, with genotype and time as fixed effects and pot (occupied by a pair of target plants) as a random effect on the gp2, because that year each plant shared a pot with another. Analysis was implemented with SAS Proc MIXED (Littell et al. 1996Littell RC, Milliken GA, Stroup WW & Wolfinger R (1996) SAS system for mixed models. SAS Institute, Cary.).
Logistic regression (SAS 1990SAS (1990) SAS/STAT Software: users's guide. Version 6. Vol. 2. SAS Institute, Cary.) was used to analyse the reproductive effort, estimated as the ratio between axillary flowering-units versus total plagiotropic axes, the apical flowering-unit production (apical flowering axes versus total plagiotropic and orthotropic axes), the clump proportion in relation to the total number of axillary shoots (registered at the end of the growth period), and the vertical distribution of the canopy. The vegetative and reproductive biomass estimation and internode length were analysed by mean comparison using Student's t (Di Rienzo et al. 2015Di Rienzo JA, Casanoves F, Balzarini MG, Gonzalez L, Tablada M & Robledo CW (2015) InfoStat. Available at <http://www.infostat.com.ar/>. Access on December 2017.
http://www.infostat.com.ar/...
).
Results
Production of orthotropic flowering axes
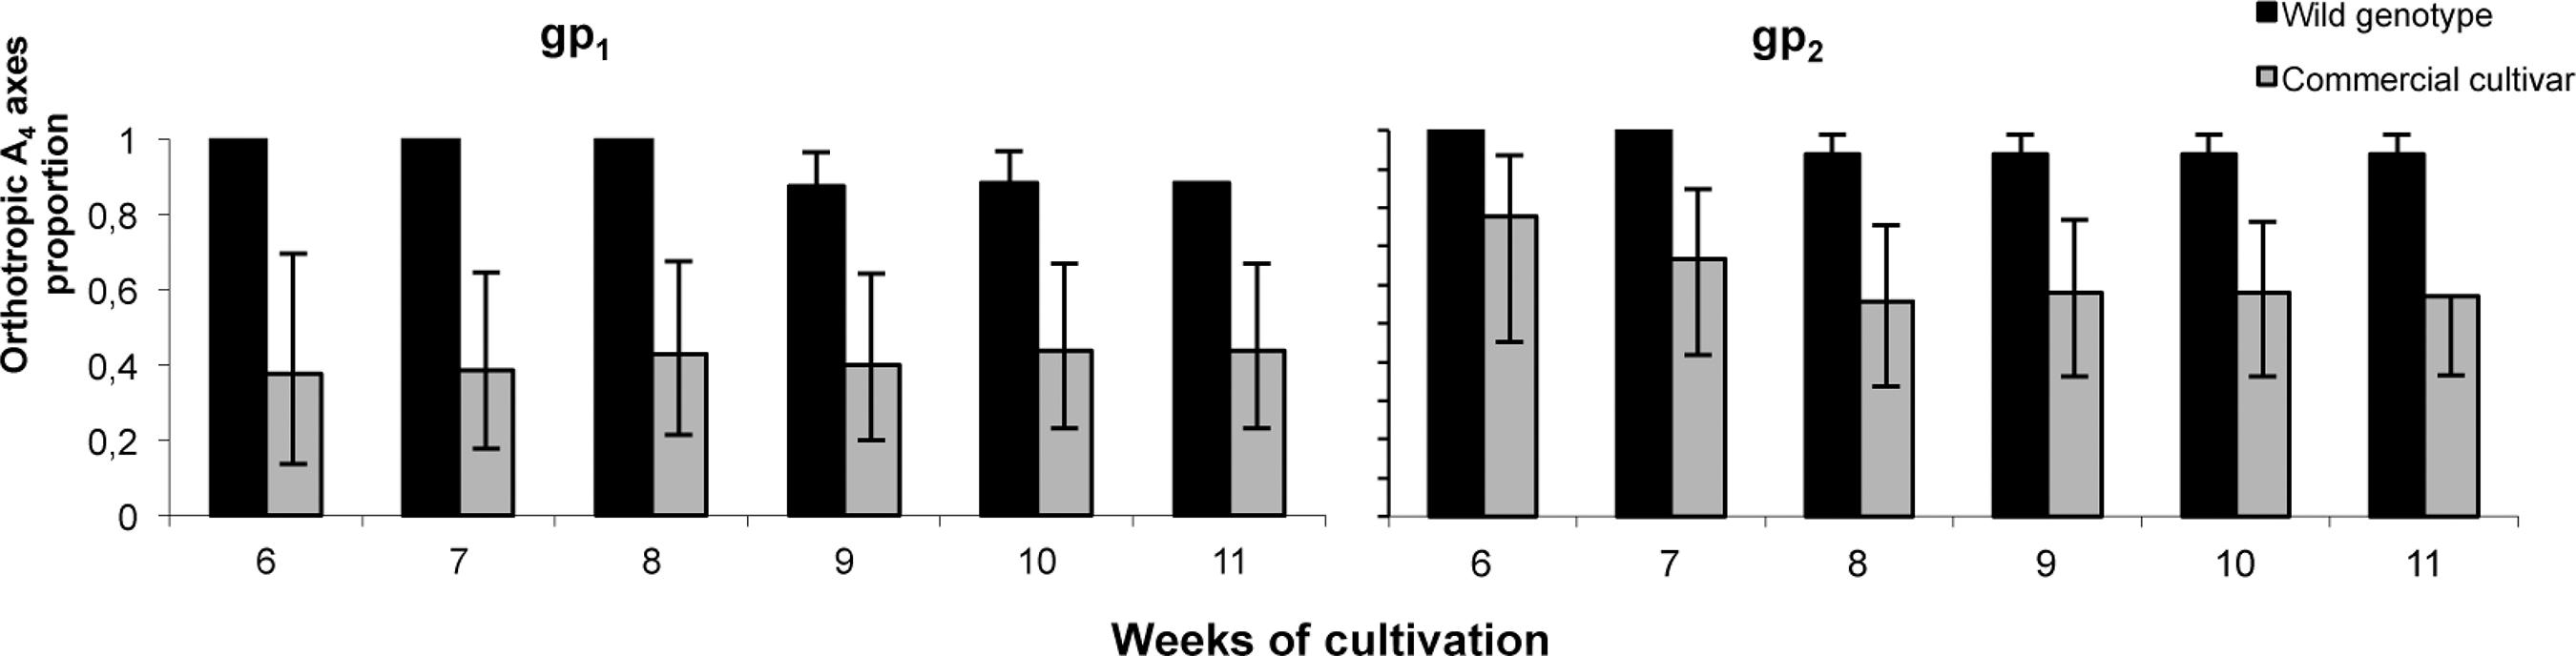
Production of A2, A3 and A4 orthotropic axes starts either in the third or in the fourth week, according to the genotype (Cc and Wg respectively). From the sixth week to the end of both growing periods, Wg showed a tendency to produce higher proportion of orthotropic A4 branches than Cc in relation to the total stems of the same branching order (Fig. 3).
Proportion of orthotropic versus total axillary A4 branches (n = 16) at different times during two growing periods (gp1 and gp2). Vertical lines indicate maximum and minimum intervals for a binomial proportion.
The ratio between axillary floriferous axes and total branch production from the plagiotropic axes was different according to the branching order of axes, the genotype, and the growing period (Fig. 4a). A2 axes bore scarce flowering axes and showed no significant differences in both growing periods (pgp1 = 0.2930; pgp2 = 0.8050), but this ratio was significantly higher in A3 plagiotropic axes of Wg during both growing periods (p < 0.0001). In the gp1, A4 axes of Cc were mostly plagiotropic, produced flowering units from their axillary branches and showed significant differences (p < 0.0001) with those of Wg. On the gp2, A4 axes showed no significant differences between genotypes (p = 0.4583) in the axillary flowering-shoot production. These A4 axes were orthotropic and flowered at their apex rather than in their axillary branches (A5 axes).
a. flowering shoot proportion over total axillary shoots produced along plagiotropic axes of different branching orders at the end of two growing periods (gp1 and gp2); b. proportion of apical flowering units (FU) over total aerial shoots at the end of two growing period (gp1 and gp2). Data for A5 axes in the gp1 are missing because they were accidentally broken. Stars show significant differences between genotypes (P ≤ 0.05, n = 4).
Apical flowering-unit production was rare on A2, scarce on A3 axes and very profuse on A4 and A5 axes that remained orthotropic until the end of each growing period (Fig. 4b). In gp1, the apical flowering-unit production was similar in both genotypes (p = 05735 for A3 and p = 0.4257 for A4). In gp2 instead, apical flowering of Wg A4 axes significantly exceeded that of Cc (p = 0.0012).
Internodes
No significant differences were found in the length of the proximal region (comprising 15 internodes in A2 and A3 axes and 10 internodes in A4 axes), neither in gp1 (p = 0.8395, p = 0.539 and p = 0.1122 for A2, A3, A4 respectively) nor in gp2 (p = 0.1057, p = 0.7388 and p = 0.2157 for A2, A3, A4 respectively) (Fig. 5a).
Internodes in axes of different branching orders - a. average length of the proximal region, comprising 15 internodes on axes A2 and A3 and 10 internodes on axes A4. Vertical bars indicate means and lines indicate SD; b. cumulative number of internodes produced over time of A2 and A3 shoots. The second growing period (gp2) began two weeks later than the first one (gp1) (P ≤ 0.05, n = 8).
At gp1, there were no significant differences between the estimated growth curves of internode production of the Wg and Cc shoots (p = 0.3946). At gp2, estimated growth curves differed significantly between Wg and Cc shoots (p = 0.0002); the estimated curve was significantly steeper and attained higher numbers of internodes for Cc than for Wg (Fig. 5b).
Plant cover: vertical distribution and total coverage
Plant cover showed differences in vertical distribution according to the genotypes, the canopy layers and the growing periods (Fig. 6). In gp1, the first and second layers were similarly covered by both genotypes (80-90% of the area), but in gp2 the basal coverage was significantly greater in Cc than in Wg (p = 0.0005, p = 0.0006). As it was mentioned above, in the gp2 Cc produced a high proportion of A2, A3 and A4 orthotropic axes (Fig. 3) that immediately became plagiotropic generating a greater coverage than Wg in the lower layers (first and second). In the upper layers, coverage was higher in Wg than in Cc in both gp1 (p < 0.0001) and gp2 (p = 0.0001, p < 0.0001, p = 0.0033 on the third, fourth and fifth layers respectively).
Vertical distribution of plant cover in two growing periods (gp1 and gp2) - Horizontal bars represent the percentage of hits within each canopy layer for each clone. The y-axis represents the layers corresponding to five intervals of above ground foliage height: 1 (0-1 cm), 2 (1-3 cm), 3 (3-7 cm), 4 (7-14 cm) and 5 (14-20 cm). Total number of sampling points per container: 30. Stars show significant differences between genotypes (P ≤ 0.05, n = 8 in gp1, n = 4 in gp2).
Vegetative coverage and reproductive biomass estimations were significantly different between genotypes. While both clones produced higher coverage in gp2 than in gp1, Wg was the genotype with more vegetative (pgp1 = 0.0009, pgp2 = 0.0446; Fig. 7a) and reproductive coverage (pgp1 = 0.0028, pgp2 = 0.0007; Fig. 7b).
Clump production
Clump production did not show any defined distribution pattern along the axes and was not correlated with any order of branching despite a slight tendency of occurrence on A2 and A3 plagiotropic axes. Therefore we evaluated the production of daughter clumps per pot independently of axis branching order. In gp1, Wg produced a significantly higher number of clumps than Cc (p = 0.0049), while in gp2 no significant differences were detected between genotypes (p = 0.1597) (Fig. 7c).
Discussion
According to our prediction, the genotypes differed in their quantitative variables at least in some traits during both growth cycles. Some distinctive features were detected through consecutive weeks while others were only significantly different at the end of the growing season.
Wg surpassed Cc at one or both growing periods in most of the measured characters: total coverage (Fig. 7a), coverage in the upper layers (Fig. 6), orthotropic axis production (Fig. 3), and reproductive axis production (Fig. 7b). Conversely, Cc surpassed Wg at gp2, in internode production (Fig. 5b) and coverage in the basal layers (Fig. 6).
Coverage variations measured between layers and year of cultivation were correlated with changes in the internode production, flowering axes and clump production. In clonal plants, different organs may play a reproductive function so that resources may be partitioned towards different fates (Weiner 2004Weiner J (2004) Allocation, plasticity and allometry in plants. Perspectives in Plant Ecology, Evolution and Systematics 6: 207-215.). Each axillary meristem may follow three different developmental paths: it can remain quiescent or inactive (I-meristem), it can produce a reproductive shoot (R-meristem), or it can produce a vegetative shoot (V-meristem) which in turn will carry more I, V or R-meristems (Bonser & Aarssen 2003Bonser SP & Aarssen LW (2003) Allometry and development in herbaceous plants: functional responses of meristem allocation to light and nutrient availability. American Journal of Botany 90: 404-412.). During gp1, both genotypes covered similarly the basal layers and developed V, R and I-meristems. During gp2, both genotypes grew profusely in their upper layers with more development of V and/or R-meristems than I-meristems, but Cc kept the allocation pattern towards V-meristems in the basal layers, R meristems in the higher layers, and doubled resource allocation towards V-meristems in the middle layer (Fig. 6). The higher number of internodes produced by Cc respect to Wg in A2 and A3 axes on the gp2 (Fig. 5b) resulted in a higher number of axillary meristems that could explain the greater spatial coverage of Cc in the basal and middle layers on that year. Furthermore, in gp2 Wg reduced 15% the coverage in the first layer, allocated a great proportion of resources to V-meristems from the second up to the fourth layer (with 80 to 95% coverage) and to R-meristem in the fifth layer (Fig. 6). The specific adjustments could partly compensate for the reductions in plant growth and biomass (Sultan 2000Sultan SE (2000) Phenotypic plasticity for plant development, function and life history. Trends in Plant Science 5: 537-542.), such as those occurred in the Wg canopy layers. The profuse coverage produced by Wg in the upper layers on both growing periods consisted of a high production of orthotropic A4 and A5 floriferous axes. At the end of both growing periods the reproductive effort was greater in Wg than in Cc plants (Fig. 7b). Wg produced a higher number of axillary flowering shoots from the A3 axes than Cc (Fig. 4a), resulting in a greater proportion of resources to R-meristems at the apex of the A4 orthotropic axes. This trend was increased at the gp2, showing a significant difference in Wg plants respect to Cc in the proportion of apical flowering unit production on the A4 axes (Fig. 4b). Since differences in plant height were not correlated with the length of the proximal internodes (Fig. 5a), they could be better explained by a higher intensity of internode growth in the distal floriferous A4 and A5 axes of Wg (not measured in this experiment). Resources in Cc were differentially partitioned towards V-meristems in A3 and A4 plagiotropic axes and to R-meristems in orthotropic A5 axes (Fig. 4a,b).
a. total vegetative coverage. Bars represent the average number of hits through the whole canopy. Total number of sampling points per container: 30. Vertical bars represent means and lines indicate the SD; b. reproductive coverage. Bars represent the percentage of hits on flowering units (FU) over the total number of hits. Number of sampling points per container: 30; c. clump production. Bars represent the percentage of clump-forming shoots over the total number of axillary shoots. Stars show significant differences between genotypes (P ≤ 0.05, n = 8 in gp1, n = 4 in gp2).
Clumps were originated from successive tillering from the peripheral regions of stoloniferous axes (Fig. 1). Such tillers produced branches of successive branching order to form ramet aggregations that would eventually act as propagules. Clump production of Wg was similar in both growing periods, whereas Cc behaved differently according to the growing cycle. During gp1, Cc spent resources mainly on V-meristems, achieving high rates of coverage in the two basal layers (Fig. 6) with low clump production. Instead, during gp2 it changed its allocation pattern and increased clump production with I-meristems (Fig.7c). The capacity of allocating resources differentially is one of the most interesting traits associated with morphological and physiological specialization in clonal plants, and this function can take place in a few weeks (Roiloa et al. 2007Roiloa SR, Alpert P, Tharayil N, Hancock G & Bhowmik PC (2007) Greater capacity for division of labour in clones of Fragaria chiloensis from patchier habitats. Journal of Ecology 95: 397-405., 2014Roiloa SR, Rodriguez-Echeverria S, Lopez-Otero A, Retuerto R & Freitas H (2014) Adaptive plasticity to heterogeneous environments increases capacity for division of labor in the clonal invader Carpobrotus edulis (Aizoaceae). American Journal of Botany 101: 1301-1308.). It is more evident in genotypes from different habitats that assume particular strategies in their allocation patterns in response to different selection pressures (Weiner 2004Weiner J (2004) Allocation, plasticity and allometry in plants. Perspectives in Plant Ecology, Evolution and Systematics 6: 207-215.).
Allocation patterns may be affected by seasonally stressful environments and changes in the bud bank make vegetative regeneration sensitive to timing of disturbance. Just as climatic factors may contribute to activate vegetative propagation and favour the persistence of plants (Klimešová & Klimeš 2007Klimešová J & Klimeš L (2007) Bud banks and their role in vegetative regeneration - A literature review and proposal for simple classification and assessment. Perspectives in Plant Ecology, Evolution and Systematics 8: 115-129. ), genetic differences related to photoperiodic responses may notably influence flowering rates (Saxena et al. 2014Saxena P, Huang B, Bonos SA & Meyer WA (2014) Photoperiod and temperature effects on rhizome production and tillering rate in tall fescue [Lolium arundinaceum (Schreb.) Darby.]. Crop Science 54: 1205.). The observed changes in growth patterns and biomass allocation are plastic responses coincident with those observed in many plant species worldwide affected by global change drivers (Matesanz et al. 2010Matesanz S, Gianoli E & Valladares F (2010) Global change and the evolution of phenotypic plasticity in plants. Annals of the New York Academy of Sciences 1206: 35-55.). It is to be noted that, in this experiment, there were notable climatic differences between both growing periods where the gp2 was distinguished by a severe drought. Plants are constantly facing rapid changes in evaporative demand and soil water content, which affect their water status and growth (Caldeira et al. 2014Caldeira CF, Bosio M, Parent B & Jeanguenin L (2014) A hydraulic model is compatible with rapid changes in leaf elongation under fluctuating evaporative demand and soil water status. Plant Physiology 164: 1718-1730.), as it has been mentioned for different crop species growing in environments with varied evaporative demand (Vadez et al. 2014Vadez V, Kholova J, Medina S, Kakkera A & Anderberg H (2014) Transpiration efficiency: new insights into an old story. Journal of Experimental Botany 65: 6141-6153.; Kholová et al. 2016Kholová J, Zindy P, Malayee S, Baddam R, Murugesan T, Kaliamoorthy S, Hash CT, Votrubová O, Soukup A, Kočová M, Niang M & Vadez V (2016) Component traits of plant water use are modulated by vapour pressure deficit in pearl millet (Pennisetum glaucum (L.) R.Br.). Functional Plant Biology 43: 423-437.).
Both studied genotypes are characterized by a great aboveground cover density, profuse flowering and an efficient exploration system through stolon and rhizome production. At both growing periods, Wg reached greater vertical coverage and reproductive effort than Cc. In addition, the environmental constraints occurred at the initial weeks of gp2 and did not negatively impact on the biomass production, so that both genotypes kept the same differences registered on gp1 (Fig. 7a-b). Wg plants, originated from a seasonally stressful environment, showed high efficiency in their allocation pattern, with balanced resource translocation to different meristems, great use of the space, both horizontally and vertically, and profuse flowering. Cc plants, instead, behaved differently. Selected for cultivation in sports environments such as golf courses, Cc expressed great ability to grow abundantly, produced a high number of ramets and prioritized vegetative propagation to flowering. Although the cloned plants came from a single individual from each genotype and it was not possible to include other individuals of the wild genotype in this study, the results showed that, in spite of the complexity of the branching system of this grass, it was possible to obtain quantitative data from different morphological characters at different times of two growing periods. A reduction in the characters to be measured would make it possible to include more replicates and/or individuals.
Although the different allocation strategy expressed by the genotypes in both growing periods could be read as a plastic response to the environment, it has still to be tested with further experiments whether a high evaporative demand could cause those changes as recorded in other Paspalum species (Insausti et al. 2001Insausti P, Grimoldi AA, Chaneton EJ & Vasellati MV (2001) Flooding induces a suite of adaptive plastic responses in the grass Paspalum dilatatum. New Phytologist 152: 291-300.; Ribeiro et al. 2006Ribeiro RV, Lyra GB, Santiago AV, Pereira AR, Machado EC & Oliveira RF (2006) Diurnal and seasonal patterns of leaf gas exchange in bahiagrass (Paspalum notatum Flügge) growing in a subtropical climate. Grass and Forage Science 61: 293-303.). Adaptive biomass allocation may contribute to different abilities to grow in changing habitats but there is not always a linear relationship between traits and fitness. The observed plastic responses could be the result of both passive plasticity as a consequence of resource limitation and active plasticity as a consequence of changes in allocation (van Kleunen & Fisher 2005van Kleunen M & Fischer M (2005) Constraints on the evolution of adaptive phenotypic plasticity in plants. New Phytologist 166: 49-60.), so that costs of plasticity are necessary to be evaluated. Such information is relevant for the selection of stress tolerant turfgrass genoytpes/cultivars with competition abilities suitable for different environments of the world.
Since only aerial shoots were studied it was not possible to determine if the observed differences in resource allocation had an underground counterpart. A further experiment would be necessary to quantify aboveground vs. underground biomass with the aim of studying the bud bank demography as an important predictive tool for behavior studies.
A better understanding of the ecology and growth dynamics of this grass, remarkable by its extraordinary plasticity and adaptability to multiple ecological conditions, would also assist in the formulation of management strategies, not just when it is used as a turfgrass, but also when it is applied for erosion control in land rehabilitation programs.
-
Editor de área: Dr. Pedro Viana
Acknowledgements
We thank JJ Valla and the staff of the 'Lucien Hauman' Botanical Garden for looking after material under cultivation. Material of P. vaginatum Sea Isle 2000 was made available thanks to the collaboration of A Lavista Llanos and Vivero 'La Amistad' of Edin SA (Argentina: Prov. Buenos Aires, Gral. Rodríguez). We are also grateful to Liliana Ortiz for technical assistance. This investigation was supported by the grant UBACyT G432 from the Universidad de Buenos Aires, Argentina.
References
- Anderson J & Ehringer NJ (2000) Ecological uses for Paspalum vaginatum (Swartz) seashore paspalum. In: Cannizzaro PJ (ed.) Proceedings of the 27th annual conference of ecosystem restoration and creation. Hillsborough Community College, Tampa. Pp. 10-13.
- Barthélémy D & Caraglio Y (2007) Plant architecture: a dynamic, multilevel and comprehensive approach to plant form, structure and ontogeny. Annals of Botany 99: 375-407.
- Bell AD & Tomlinson PB (1980) Adaptive architecture in rhizomatous plants. Botanical Journal of the Linnean Society 80: 125-160.
- Bonser SP & Aarssen LW (2003) Allometry and development in herbaceous plants: functional responses of meristem allocation to light and nutrient availability. American Journal of Botany 90: 404-412.
- Burkart SE, León RJC & Movia CP (1990) Inventario fitosociológico del pastizal de la Depresión del Salado (Prov. Bs. As.) en un área representativa de sus principales ambientes. Darwiniana 30: 27-69.
- Caldeira CF, Bosio M, Parent B & Jeanguenin L (2014) A hydraulic model is compatible with rapid changes in leaf elongation under fluctuating evaporative demand and soil water status. Plant Physiology 164: 1718-1730.
- Campos JA, Herrera M, Biurrun I & Loidi J (2004) The role of alien plants in the natural coastal vegetation in central-northern Spain. Biodiversity and Conservation 13: 2275-2293.
- Di Rienzo JA, Casanoves F, Balzarini MG, Gonzalez L, Tablada M & Robledo CW (2015) InfoStat. Available at <http://www.infostat.com.ar/>. Access on December 2017.
» http://www.infostat.com.ar/ - Duncan RR & Carrow RN (2000) Seashore Paspalum. The environmental turfgrass. Ann Arbor Press, Chelsea. Pp. 281.
- Fabbri LT, Ploschuk EL, López MV, Insausti P & Rua GH (2016a) Freeze tolerance differs between two ecotypes of Paspalum vaginatum ( Poaceae ). Acta Botanica Brasilica 30: 152-156.
- Fabbri LT, Perreta MG & Rua GH (2016b) Spatial structure and development of Paspalum vaginatum (Poaceae): an architectural approach. Australian Journal of Botany 64: 153-159.
- Greig-Smith P (1983) Quantitative plant ecology. University of California Press, Berkeley. Pp. 359.
- Insausti P, Chaneton EJ & Soriano A (1999) Flooding reverted grazing effects on plant community structure in mesocosms of lowland grassland. Oikos 84: 266-276.
- Insausti P, Grimoldi AA, Chaneton EJ & Vasellati MV (2001) Flooding induces a suite of adaptive plastic responses in the grass Paspalum dilatatum New Phytologist 152: 291-300.
- Kholová J, Zindy P, Malayee S, Baddam R, Murugesan T, Kaliamoorthy S, Hash CT, Votrubová O, Soukup A, Kočová M, Niang M & Vadez V (2016) Component traits of plant water use are modulated by vapour pressure deficit in pearl millet (Pennisetum glaucum (L.) R.Br.). Functional Plant Biology 43: 423-437.
- van Kleunen M & Fischer M (2005) Constraints on the evolution of adaptive phenotypic plasticity in plants. New Phytologist 166: 49-60.
- Klimešová J & Klimeš L (2007) Bud banks and their role in vegetative regeneration - A literature review and proposal for simple classification and assessment. Perspectives in Plant Ecology, Evolution and Systematics 8: 115-129.
- Littell RC, Milliken GA, Stroup WW & Wolfinger R (1996) SAS system for mixed models. SAS Institute, Cary.
- Matesanz S, Gianoli E & Valladares F (2010) Global change and the evolution of phenotypic plasticity in plants. Annals of the New York Academy of Sciences 1206: 35-55.
- Mitchell RB & Moser LE (2000) Developmental morphology and tiller dynamics of warm-season grass swards. In: Moore KJ &Anderson BE (eds.) Native warm-season grasses. Research Trends and Issues. CSSA Special Publication 30. CSSA/ASA, Madison. Pp 49-66.
- Ribeiro RV, Lyra GB, Santiago AV, Pereira AR, Machado EC & Oliveira RF (2006) Diurnal and seasonal patterns of leaf gas exchange in bahiagrass (Paspalum notatum Flügge) growing in a subtropical climate. Grass and Forage Science 61: 293-303.
- Riefner RE & Columbus JT (2008) Paspalum vaginatum (Poaceae), a new threat to wetland diversity in southern California. Journal of the Botanical Research Institute of Texas 2: 743-759.
- Riefner RE, Denham SS & Columbus JT (2010) Paspalum pubiflorum and P. quadrifarium (Poaceae) new to California, with a key and notes on invasive species. Journal of the Botanical Research Institute of Texas 4: 761-770.
- Roiloa SR, Alpert P, Tharayil N, Hancock G & Bhowmik PC (2007) Greater capacity for division of labour in clones of Fragaria chiloensis from patchier habitats. Journal of Ecology 95: 397-405.
- Roiloa SR, Rodriguez-Echeverria S, Lopez-Otero A, Retuerto R & Freitas H (2014) Adaptive plasticity to heterogeneous environments increases capacity for division of labor in the clonal invader Carpobrotus edulis (Aizoaceae). American Journal of Botany 101: 1301-1308.
- Rua GH & Gróttola MC (1997) Growth form models within the genus Paspalum L. (Poaceae, Paniceae). Flora 192: 65-80.
- SAS (1990) SAS/STAT Software: users's guide. Version 6. Vol. 2. SAS Institute, Cary.
- Saxena P, Huang B, Bonos SA & Meyer WA (2014) Photoperiod and temperature effects on rhizome production and tillering rate in tall fescue [Lolium arundinaceum (Schreb.) Darby.]. Crop Science 54: 1205.
- Serebryakova TI (1969) Vetvlenie i Kutsenie v Semeistve Poaceae. Botanicheskii Zhurnal 54: 858-871.
- Sultan SE (2000) Phenotypic plasticity for plant development, function and life history. Trends in Plant Science 5: 537-542.
- Vadez V, Kholova J, Medina S, Kakkera A & Anderberg H (2014) Transpiration efficiency: new insights into an old story. Journal of Experimental Botany 65: 6141-6153.
- Weiner J (2004) Allocation, plasticity and allometry in plants. Perspectives in Plant Ecology, Evolution and Systematics 6: 207-215.
- Wilson EB (1927) Probable inference, the law of succession, and statistical inference. Journal of the American Statistical Association 22: 209-212.
- Zuloaga FO & Morrone O (2005) Revisión de las especies de Paspalum para América del Sur Austral (Argentina, Bolivia, Sur del Brasil, Chile, Paraguay y Uruguay). Monographs in Systematic Botany. Vol. 102. Missouri Botanical Garden Press, Saint Louis. 297p.
Publication Dates
-
Publication in this collection
20 Dec 2019 -
Date of issue
2019
History
-
Received
26 Dec 2017 -
Accepted
10 May 2018