 Path analysis under varying degrees of multicollinearity identifies key traits for indirect grain yield selection in common bean
ABSTRACT:
Path analysis of agronomic traits has been conducted under varying degrees of multicollinearity, which can hinder the effectiveness of indirect selection for high grain yield in common bean (Phaseolus vulgaris L.). This study aimed to examine the outcomes of path analysis for multiple agronomic traits across different degrees of multicollinearity and to identify the most promising traits for the indirect selection of common bean cultivars with high grain yields. A total of 25 common bean cultivars were evaluated for multiple agronomic traits in four experiments. Path analysis was carried out under three levels of multicollinearity: severe, moderate to strong, and weak. Significant effects of cultivar, environment, and genotype × environment interaction were observed for all traits, facilitating the use of indirect selection. Under conditions of severe or moderate to strong multicollinearity, high regression coefficients and/or coefficients with signs contrary to the anticipated direction of selection were observed, resulting in interpretative errors in path analysis. Conversely, under weak multicollinearity, the regression coefficients were more consistent with the biological phenomena under investigation in terms of both magnitude and sign. This alignment enhances the ability to identify promising agronomic traits for indirect selection. Therefore, path analysis under weak multicollinearity helps choose the most effective agronomic traits for indirect grain yield selection in common bean programs. It is recommended that indirect selection targets the highest numbers of grains per pod and pods per plant in the development of new common bean cultivars aimed at achieving high grain yields.
Keywords:
Phaseolus vulgaris L; multicollinearity diagnostics; indirect selection
Introduction
The common bean (Phaseolus vulgaris L.) is widely cultivated across various countries, primarily for its dry grains, which are known for their high quality and nutritional properties (Meenu et al., 2023). Consequently, enhancing the grain yield of this legume has a direct impact on the food and nutritional security of several nations.
Grain yield in common beans is primarily governed by quantitative inheritance (Blair et al., 2012), resulting in modest yield increases among new lines developed by breeding programs in recent decades (Lemos et al., 2020; Ribeiro et al., 2024). Given the complex nature of this trait, indirect selection through correlation and path analyses has become a widely employed strategy to identify promising traits for enhancing grain yield in common beans (Al-Ballat and Al-Araby, 2019; Pedro et al., 2022; Demessie et al., 2024).
Path analysis entails the breakdown of the decomposition of the correlation coefficient into its direct and indirect effects (Cruz et al., 2012). This makes is especially beneficial in the context of indirect selection. Several studies have detailed agronomic traits suitable for indirect selection aimed at enhancing grain yield in common bean (Al-Ballat and Al-Araby, 2019; Yuliawati et al., 2021; Contreras-Rojas et al., 2024). However, these studies do not indicate whether multicollinearity diagnostics were conducted prior to path analysis.
The highest positive direct effects on grain yield in common bean genotypes were observed for number of pods per plant and number of seeds per plant, under conditions of moderate to strong multicollinearity (Cabral et al., 2011) and for number of pods per plant and number of seeds per pod under weak multicollinearity (Pedro et al., 2022). Consequently, the degree of multicollinearity may influence the identification of traits suitable for indirect selection.
No prior studies on path analysis concerning agronomic traits under varying degrees of multicollinearity have been identified in the existing literature on common beans. We hypothesize that the degree of multicollinearity applied in path analysis will affect both the magnitude and sign of the regression coefficients obtained. Path analysis under weak multicollinearity can hinder the effectiveness of selection promising agronomic traits for enhancing grain yields. This study aimed to evaluate the results of path analysis for multiple agronomic traits across different degrees of multicollinearity and to identify the most promising traits for the indirect selection of common bean cultivars with enhanced grain yield.
Materials and Methods
Study site
Four experiments were conducted in Santa Maria, situated in the central depression of Rio Grande do Sul State (RS), Brazil (29°42’ S, 53°49’ W, altitude 95 m). The municipality records annual averages of 1777.9 mm of precipitation with a minimum and maximum temperature of 14.9 °C and 25.4 °C, respectively (INMET, 2021). The region has a humid subtropical climate with hot summers (Alvares et al., 2013).
All experiments took place in an area that belongs to the Universidade Federal de Santa Maria (UFSM). The soil in the region is classified as Alitic Argisol (Hapludalf), and the experiment was carried out during spring (years 2019, 2020, and 2021) and summer (2021). During the spring, sowing occurred in Oct, aligning with the rainy season and the preferred timing for cultivating common beans in Rio Grande do Sul State. In the summer, sowing took place in Feb, during the dry season, which features the lowest accumulated precipitation during the vegetative growth of common bean plants. The experiments carried out during the rainy seasons of 2019, 2020, and 2021, as well as the dry season of 2021, represented the environmental variability experienced across different years and growing seasons in the region.
Experimental design and treatments
A randomized block design with three replicates was employed in the four experiments. Each experimental plot comprised four rows, each 4 m long, with a spacing of 0.5 m between rows, resulting in 8 m2 total plot area. The usable area for the plots included the two central rows (4 m2) to avoid any intermixing of cultivars.
The evaluated treatments included 25 common bean cultivars. Among these, two cultivars, BRS MG Realce and Iraí, belong to the Andean gene pool and feature large cranberry grains (with a cream seed coat and red streaks), each with a 100-grain mass ≥ 40 g. Ten cultivars present carioca grains: IPR Siriri, IPR Tangará, IAC Milênio, BRS MG Pioneiro, Fepagro Garapiá, Pérola, IAC Imperador, IPR Juriti, SCS 205 Riqueza, and BRS Estilo. Additionally, 13 cultivars were showcasing black grains: IPR Uirapurú, IAC Netuno, BRS Esplendor, IPR Tuiuiú, BRS Valente, BRS Esteio, Fepagro 26, Guapo Brilhante, IPR Graúna, BRS Expedito, IPR Tiziu, Fepagro Triunfo, and BRS Campeiro. Both carioca and black common bean cultivars originate from the Mesoamerican gene pool and feature small to medium-sized grains (with a 100-grain mass of 20.4 to 26.1 g). This selection illustrates a random sampling of common bean cultivars registered for cultivation in Rio Grande do Sul State and highlights the genetic diversity obtained through Brazilian common bean breeding programs over the past 40 years.
Experiment management
The soil was prepared according to conventional methods to simulate the common bean cultivation practices typically used in the region. Soil samples were collected each winter to analyze their chemical composition and determine the necessary amounts of fertilizer for each experiment.
Preventive treatments against fungal and insect pests were applied to the common bean seeds using Maxim® (fludioxonil and metalaxyl-M) and Cruiser® 350 FS (thiamethoxam), respectively. Insect pest control on the shoots was achieved exclusively with Engeo™ Pleno (thiamethoxam and lambda-cyhalothrin). To mitigate weed competition, weeding was performed in conjunction with the application of herbicides Dual Gold® (S-metolachlor) and Basagran® (bentazon). The dosage of each pesticide was determined following the manufacturer's recommendations specific to the common bean crop, including the timing and frequency of applications. Additionally, sprinkler irrigation was utilized during periods of prolonged water deficit.
Data collection
Plant architecture was qualitatively assessed in the field at the maturity stage (R9) within the usable plot area. A scoring scale from 1 to 9 was employed, defined as follows: lodging (1 = upright plants; 9 = prostrate plants) and general adaptation score (1 = plants that remained upright, displayed a large number of pods, and showed no signs of disease; 9 = completely fallen plants with few pods and evident disease symptoms on the pods).
Five quantitative traits related to plant architecture were determined in a sample of ten competitive plants, which were randomly harvested at the R9 growth stage within the usable plot. These traits included the height of the first pod insertion, the height of the last pod insertion, and the overall plant height, all measured with a graduated ruler. Additionally, the epicotyl and hypocotyl diameters were recorded at 1 cm above and 1 cm below the cotyledonary node, respectively, using a digital caliper.
Production-related traits were evaluated in the same ten plants, including the number of pods per plant, the number of grains per plant, and the number of grains per pod. The 100-grain mass and the grain yield were quantified within the usable plot, with grain moisture standardized to 13 %. The 100-grain mass was obtained by averaging the weight of three random samples of 100 grains per replicate. Grain yield was estimated based on the total weight of harvested grains from both the usable plot and ten plants, and the results were converted to kg ha–1. Due to the heterogeneous final plant stand among the experimental plots, it was necessary to correct the grain yield data in all experiments. This adjustment employed the Covariance method-ideal stand (Zij), as recommended by Vencovsky and Cruz (1991), to minimize experimental error by the following equation:
in which Yij is the observed grain yield in the plot; b is the residual regression coefficient of Yij on Xij; Xij is the observed plant stand in the plot; and H is the stand deemed ideal.
Statistical analyses
Tests for randomness, normality, and homoscedasticity of the errors were conducted to ensure adherence to model assumptions (Steel et al., 1997; Sprent and Smeeton, 2007). Subsequently, individual analyses of variance were carried out for each experiment. These statistical procedures, along with additional analyses employed in this research, were executed using Genes software (Cruz, 2016).
A combined analysis of variance was performed after ensuring homogeneous variances for all traits across the four experiments. The statistical model employed was:
in which Yijk is the response variable referring to cultivar i, in block k and environment j; m is the overall mean; B/Ejk is the block k within environment i; Ci is the effect of cultivar i; Ej is the effect of environment j; CEij is the interaction between cultivar i and environment j; and Eijk is the experimental error.
In this analysis, only the mean and the cultivar source of variation were treated as fixed effects. In all analyses of variance, both individual and combined, significant differences were identified using the F-test at a 5 % probability level.
Multicollinearity diagnostics were performed using the phenotypic correlation matrix derived from the combined analysis of variance. The classification of multicollinearity was based on criteria proposed by Montgomery et al. (2021).
Path analysis was implemented using the phenotypic correlation coefficients obtained from a combined analysis of variance. In this analysis, grain yield was considered as the dependent (main) variable, while other traits served as explanatory variables. Path analyses were conducted under different degrees of multicollinearity:
-
1) severe (all traits; condition number – CN > 1000)
-
2) moderate to strong (after excluding traits until 100 < CN < 1000)
-
3) weak (after excluding traits until CN < 100).
The selection of traits for elimination adhered to the guidelines established by Cruz et al. (2012), i.e., focusing on traits that are highly correlated, possess the highest variance inflation factor, and those of the greater weight in the last eigenvectors. This approach effectively identified the variables that contributed the most to pronounced multicollinearity issues. Pearson's linear correlation coefficients were calculated from the phenotypic correlation matrix from the combined analysis of variance, ensuring weak multicollinearity. The significance of these coefficients was assessed using the Student's t-test at a 5 % probability level.
Results
The experimental errors showed a random distribution among the experimental units and were normally distributed, which is essential for validating the hypothesis tests. Consequently, the assumptions of randomness and normality were satisfied in all experiments.
The assumption of homoscedasticity was not satisfied for the general adaptation score and the height of the first pod insertion. To address this for these two traits, it was necessary to adjust the degrees of freedom for the error and the genotype × environment interaction to achieve homogeneous residual variances. Following this adjustment, the ratio of the highest to the lowest residual mean squares was less than seven for all evaluated traits, which allowed for the execution of a combined analysis of variance.
The effects of cultivar, environment, and genotype × environment interaction were significant for all traits (Table 1). As a result, the common bean cultivars exhibited significant differences across the 12 agronomic traits, and the four environments (experiments) showing considerable variation, particularly regarding meteorological conditions and the occurrence of diseases and insect pests. Additionally, the agronomic performance of the common bean cultivars was inconsistent across the growing environments.
Combined analysis of variance containing the degrees of freedom (DF), mean squares, mean, coefficient of experimental variation (CEV), and selective accuracy (SA) for the traits of lodging (LDG), as well as general adaptation score (GAS), the height of the first pod insertion (HFPI), height of the last pod insertion (HLPI), plant height (PH), epicotyl diameter (ED), hypocotyl diameter (HD), number of pods per plant (NPP), number of grains per plant (NGP), number of grains per pod (NGPOD), 100-grain mass (100G), and grain yield (GY) determined in 25 common bean cultivars evaluated across four experiments from 2019 to 2021.
When path analysis was conducted using the complete dataset (12 agronomic traits), a CN of 3,467.88 was obtained, indicating severe multicollinearity (Table 2). Furthermore, a high coefficient of determination (R2 = 0.80) and a low residual variable effect (0.44) were recorded. In this context, the traits such as the number of grains per pod (3.93), the number of pods per plant (3.26), the 100-grain mass (0.82), and hypocotyl diameter (0.68) exhibited high positive direct effects on grain yield. In contrast, the number of grains per plant (–3.80), epicotyl diameter (–0.57), and plant height (–0.50) demonstrated substantial negative direct effects on grain yield, which was unexpected.
Path analysis under severe multicollinearity considering the direct (DE) and indirect (ID) effects obtained from the traits lodging (LDG), general adaptation score (GAS), height of the first pod insertion (HFPI), height of the last pod insertion (HLPI), plant height (PH), epicotyl diameter (ED), hypocotyl diameter (HD), number of pods per plant (NPP), number of grains per plant (NGP), number of grains per pod (NGPOD), and 100-grain mass (100G) on grain yield (GY) determined in 25 common bean cultivars evaluated across four experiments from 2019 to 2021.
Under conditions of moderate to strong multicollinearity, which was achieved by excluding the traits of plant height, hypocotyl diameter, and the number of grains per plant, the CN in path analysis was reduced to 108.91 (Table 3). The R2 value remained high (R2 = 0.70), while the residual variable effect value increased to 0.54. In this condition, the largest positive direct effects on grain yield were identified for the number of grains per pod (0.94), the number of pods per plant (0.69), the 100-grain mass (0.38), and lodging (0.24). However, the direct effect of lodging on grain yield was unfavorable for selection purposes. Notably, no trait exhibited a pronounced direct negative effect on grain yield.
Path analysis under moderate to strong multicollinearity considering the direct (DE) and indirect (ID) effects obtained from the traits lodging (LDG), general adaptation score (GAS), height of the first pod insertion (HFPI), height of the last pod insertion (HLPI), epicotyl diameter (ED), number of pods per plant (NPP), number of grains per pod (NGPOD), and 100-grain mass (100G) on grain yield (GY) determined in 25 common bean cultivars evaluated across four experiments from 2019 to 2021.
Applying weak multicollinearity while excluding the traits of plant height, hypocotyl diameter, the number of grains per plant, and the general adaptation score, the path analysis revealed a CN = 74.16 (Table 4). The R2 and the residual variable effect values under weak multicollinearity were very similar to those observed with moderate to strong multicollinearity. Notably, the traits of number of grains per pod (1.08), number of pods per plant (0.72), and the 100-grain mass (0.49) exhibited the greatest positive direct effects, thereby supporting selection efforts for enhanced grain yield in common bean (Table 4, Figure 1). These three traits also demonstrated correlation with grain yield (Table 5).
Path analysis under weak multicollinearity considering the direct (DE) and indirect (ID) effects obtained from the traits lodging (LDG), height of the first pod insertion (HFPI), height of the last pod insertion (HLPI), epicotyl diameter (ED), number of pods per plant (NPP), number of grains per pod (NGPOD), and 100-grain mass (100G) on grain yield (GY) determined in 25 common bean cultivars evaluated across four experiments from 2019 to 2021.
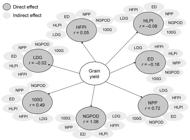
Causal diagram of path analysis under weak multicollinearity considering the direct and indirect effects obtained from the traits lodging (LDG), height of the first pod insertion (HFPI), height of the last pod insertion (HLPI), epicotyl diameter (ED), number of pods per plant (NPP), number of grains per pod (NGPOD), and 100-grain mass (100G) on grain yield determined in 25 common bean cultivars evaluated across four experiments from 2019 to 2021.
Pearson's correlation coefficients obtained under weak multicollinearity from the traits of lodging (LDG), height of the first pod insertion (HFPI), height of the last pod insertion (HLPI), epicotyl diameter (ED), number of pods per plant (NPP), number of grains per pod (NGPOD), and 100-grain mass (100G) on grain yield (GY) determined in 25 common bean cultivars evaluated across four experiments from 2019 to 2021.
Predominantly negative and low-magnitude indirect effects on grain yield were observed through the number of grains per pod and the number of pods per plant (Table 4). However, the greatest negative indirect effect was identified through the 100-grain mass, as this trait exhibited a negative correlation with both the number of grains per pod and the number of pods per plant (Table 5).
Regarding the other agronomic traits, both low-magnitude positive or negative direct effects on grain yield were observed (Table 4, Figure 1). Additionally, the analysis showed non-significant correlation coefficients between grain yield and the traits of lodging, the height of the first pod insertion, the height of the last pod insertion, and epicotyl diameter (Table 5).
Discussion
The presence of genetic variability for agronomic traits enables breeding programs to achieve gains through selection. A genetic gain of 1.50 % per year in grain yield was observed in common bean lines developed for cultivation in southern Brazil during the 2000s and 2010s (Ribeiro et al., 2024). This enhancement in grain yield resulted from reduced lodging, as well as an increase in the growth cycle, the heights of insertion for both the first and last pods, and the 100-grain mass, which were implemented in the common bean breeding process.
In the present study, the common bean cultivars demonstrated a wide genetic diversity regarding agronomic traits, confirming that cultivated common bean genotypes exhibit differences across various traits (Delfini et al., 2017; Pedro et al., 2022; Contreras-Rojas et al., 2024). When genetic variability is present, it is possible to perform direct selection (based on the phenotype of the primary trait) and indirect selection (based on the phenotype of secondary traits). However, direct selection for grain yield may be less effective, as this trait is quantitatively inherited in common bean (Blair et al., 2012). In these instances, correlation and path analyses are valuable tools for identifying promising secondary traits that can enhance grain yield through indirect selection.
Significant genotype × environment interactions were identified for the 12 traits analyzed in this study, highlighting the variability in agronomic traits among common bean genotypes grown in different environments. A similar pattern has been observed in evaluations of agronomic performance among common bean genotypes in multi-environment experiments (Delfini et al., 2017; Ribeiro and Maziero, 2023; Demessie et al., 2024). When genotype × environment interactions occur in agronomic traits, it may be necessary to identify secondary traits for indirect selection in each growing environment. This variability presents challenges for implementing such selection in common bean breeding programs. To enhance the efficiency of indirect selection for grain yield in common beans, it is advisable to conduct Pearson's linear correlation analysis using data from at least three different experiments (Ribeiro and Maziero, 2023).
In the context of path analysis, there are no established references regarding the number of experiments required to assess the direct and indirect effects of agronomic traits on grain yield in common bean. This study performed path analysis using the phenotypic correlation matrix derived from a combined analysis of variance, which was based on data from 12 agronomic traits evaluated across four experiments. Consequently, the interpretation of the results from this path analysis is expected to be more precise in identifying key agronomic traits that could be utilized for indirect selection for high grain yield in common bean genotypes. However, it is important to note that these results are specific to the cultivars and environments analyzed and may not be sufficient to generalize the selection of agronomic traits.
Furthermore, the accuracy in interpreting the direct and indirect effects of the explanatory variables on the primary variable is likely to improve when multicollinearity diagnostics are conducted prior to path analysis. This enhancement occurs because severe (CN > 1000) or moderate to strong (100 < CN < 1000) multicollinearity among explanatory variables hinders the assessment of their effects on the response of the primary variable (Cruz et al., 2012). To date, no studies have been identified that evaluate the impact of varying degrees of multicollinearity on path analysis for agronomic traits in common bean.
Under conditions of severe multicollinearity, a minimal residual variable effect was observed in path analysis for the evaluated agronomic traits. A similar finding was noted in studies involving multiple agronomic traits in common bean experiments, although there was no mention of multicollinearity diagnostics (Al-Ballat and Al-Araby, 2019; Yuliawati et al, 2021; Contreras-Rojas et al., 2024). In the present study, we obtained very high direct effects (≥ 3.26) with unexpected algebraic signs, indicating that the high degree of multicollinearity led to regression coefficient estimates that were inconsistent with the biological phenomena under investigation. This misinterpretation of results can lead to errors in identifying secondary traits suitable for indirect selection. Consequently, relying on path analysis results obtained under severe multicollinearity may result in low efficiency and repeatability in defining agronomic traits for indirect selection aimed at enhancing grain yield in common bean.
In the path analysis with moderate to strong multicollinearity, a greater residual variable effect and a high R2 value were observed, which collectively indicate that the explanatory variables sufficiently explain the variations in the primary variable. This result is supported by the CN value obtained, which was close to the threshold distinguishing weak multicollinearity (CN < 100), as outlined by Montgomery et al. (2021).
When path analysis was conducted with near-weak multicollinearity, the estimates of the direct effects of various production components on grain yield in common bean aligned with expectations (Cabral et al., 2011). However, this finding was not replicated in the present study, as a direct effect was observed with a sign contrary to the selection objectives. The positive direct effect of lodging on grain yield indicates that selecting plants with higher lodging scores could lead to prostrate architecture, which is not favorable for the objectives of current breeding programs. This is because common bean cultivars exhibiting prostrate architecture make management and harvesting more challenging, as the increased contact between plants and pods with the soil can directly lead to reduced grain yield.
Consequently, even when path analysis is conducted in the presence of moderate to strong multicollinearity, it remains possible to observe regression coefficient estimates that result in misleading interpretations regarding the relationships among variables. In such instances, disregarding the effects of multicollinearity may generate inconsistent results, ultimately undermining the efficiency of indirect selection for high grain yield in common bean.
The exclusion of highly correlated traits, such as plant height, hypocotyl diameter, the number of grains per plant, and the general adaptation score, prior to implementing path analysis, resulted in weak multicollinearity (CN = 74.16). This approach effectively addressed multicollinearity issues in the path analysis of agronomic traits relevant to the breeding of common bean (Cabral et al., 2011; Pedro et al., 2022) and soybean (Glycine max L.) (Del Conte et al., 2020). The findings indicate that the prior exclusion of these highly correlated traits successfully mitigated the multicollinearity problems that had previously hindered the straightforward interpretation of regression coefficient values between the explanatory variables and the primary variable in path analysis.
In the presence of weak multicollinearity, a high R2 value, and a greater residual variable effect were recorded, indicating that the seven remaining agronomic traits sufficiently explained the variations in grain yield among common bean cultivars. Similarly, path analysis under weak multicollinearity revealed an R2 value greater than that attributed to the residual variable effect, based on the study examining the relationship between eight explanatory variables on grain yield in common bean genotypes (Pedro et al., 2022). This implies that a select few agronomic traits can play a critical role in enhancing grain yield in common beans.
In path analysis involving weak multicollinearity, the regression coefficient estimates were obtained with magnitudes and signs that were more coherent and consistent with the biological phenomenon being studied. In this context, three traits exhibited the greatest direct positive effects on grain yield: the number of grains per pod, the number of pods per plant, and the 100-grain mass. Previous studies utilizing path analysis have identified the following traits as having the greatest direct positive effects on grain yield in common bean: the number of grains per plant and the 100-grain mass (Gonçalves et al., 2017); the number of pods per plant and the 100-grain mass (Oliveira et al., 2018); plant height and the number of pods per plant (Al-Ballat and Al-Araby, 2019); and the number of pods per plant and the number of grains per pod (Pedro et al., 2022). The discrepancies in these findings can be attributed to the genetic diversity among the evaluated genotypes, the number of traits analyzed, the degree of multicollinearity among the explanatory variables, the number of experiments conducted, and the environmental influences on the expression of these traits.
In the present study, the cultivar IPR Uirapurú demonstrated superior grain yield, accompanied by higher values in the number of grains per pod, the number of pods per plant, and the 100-grain mass compared to the evaluated Mesoamerican common bean cultivars. The increase of these three key explanatory variables contributed to a significant increase in grain yield. These findings suggest that the number of grains per pod, the number of pods per plant, and the 100-grain mass are the most effective traits for indirect selection of grain yield within the common bean program.
Moreover, the traits related to the number of grains per pod and the number of pods per plant demonstrated a positive correlation with grain yield (r ≥ 0.45). Additionally, the traits showing the strongest correlation and positive direct effects of high magnitude on grain yield were the number of pods per plant and the number of grains per pod (Pedro et al., 2022). These findings suggest that indirect selection for higher values of the number of grains per pod and the number of pods per plant may be an effective strategy for enhancing grain yield in common bean genotypes.
The 100-grain mass demonstrated the third largest positive direct effect on grain yield; however, the correlation between these two traits was negative. This suggests that a decrease in the 100-grain mass could lead to an increase in grain yield. The finding can explain by the fact that 92 % of the evaluated common bean cultivars assessed in the present study belong to the Mesoamerican gene pool, which typically exhibits a lower 100-grain mass compared to those from the Andean gene pool. An indeterminate growth habit characterizes Mesoamerican common bean cultivars, with either short (type II) or long (type III) guides, and their flowering period ranges from 15 to 30 days (Dawo et al., 2007). Conversely, the Andean common bean cultivars (BRS MG Realce and Iraí) exhibit a determinate growth habit (type I) and are characterized by a short flowering period that lasts from five to six days. The short duration of the flowering period in these cultivars may have contributed to a reduction in grain yield due to the adverse impacts of the La Niña climate phenomenon, which was prevalent during this research. La Niña is known for causing below-average annual precipitation in the southern region of Brazil (Matzenauer et al., 2018). Moreover, high temperatures (≥ 28 °C) recorded during the reproductive period of the plants across all experiments conducted during the rainy season further exacerbated the situation by causing flower and pod abortion, thereby leading to the observed decrease in grain yield. In contrast, common bean cultivars of types II and III, which have a more extended flowering period, were less impacted by the effects of the La Niña phenomenon. As a result, they demonstrated a smaller decrease in grain yield compared to the type I cultivar. The higher grain yield of these cultivars, which have a lower 100-grain mass (types II and III), directly influenced the relationship between these two traits.
The indirect effects related to the number of grains per pod and the number of pods per plant were primarily negative and of low magnitude. However, a strong negative influence was observed indirectly through the 100-grain mass via the number of grains per pod and the number of pods per plant on grain yield. This occurs because the 100-grain mass has a negative correlation with both the number of grains per pod and the number of pods per plant, which aligns with previous research on common bean genotypes (Ribeiro and Maziero, 2023). In this context, pursuing indirect selection for an increased number of grains per pod and a larger number of pods per plant offers potential for developing new common bean cultivars with high grain yield, even if they exhibit a lower 100-grain mass. Thus, caution is advised when implementing indirect selection for high grain yield to ensure that new common bean cultivars of different grain types possess a 100-grain mass that meets market demands.
In the present study, path analysis of agronomic traits that exhibited severe or moderate to strong multicollinearity resulted in high regression coefficients with signs contrary to the desired direction of selection, leading to misinterpretations of cause and effect. To prevent errors associated with multicollinearity, breeders must identify and eliminate highly correlated traits prior to conducting path analysis.
In contrast, under conditions of weak multicollinearity, the regression coefficients more closely reflected the magnitude and sign of the biological phenomena being studied. This alignment facilitated a more precise interpretation of the relationships between the explanatory variables and the primary variable. As a result, it enhanced the accuracy of identifying promising agronomic traits for indirect selection aimed at achieving high yields in common bean. Consequently, it is advisable to focus on indirect selection that prioritizes the highest number of grains per pod and the greatest number of pods per plant to develop new common bean cultivars with high grain yields.
However, conducting path analysis using a dataset from four environments limits the application of indirect selection within the common bean breeding program. To address this constraint, it is essential to determine the minimum number of experiments required for path analysis regarding agronomic traits. This approach will enhance the selection of traits that are more efficient in promoting increases in grain yield among common bean genotypes.
Data availability statement
All data generated or analyzed during this study are included in this published article.
Acknowledgments
The authors thank the Coordenação de Aperfeiçoamento de Pessoal de Nível Superior (CAPES) and the Conselho Nacional de Desenvolvimento Científico e Tecnológico (CNPq) for financial support and scholarships.
References
-
Al-Ballat A, Al-Araby AA. 2019. Correlation and path coefficient analysis for seed yield and some of its traits in common bean (Phaseolus vulgaris L.). Egyptian Journal Horticulture 46: 41-51. https://doi.org/10.21608/ejoh.2018.6481.1088
» https://doi.org/10.21608/ejoh.2018.6481.1088 -
Alvares CA, Stape JL, Sentelhas PC, Gonçalves JLM, Sparovek G. 2013. Köppen's climate classification map for Brazil. Meteorologische Zeitschrift 22: 711-728. https://doi.org/10.1127/0941-2948/2013/0507
» https://doi.org/10.1127/0941-2948/2013/0507 -
Blair MW, Galeano CH, Tovar E, Torres MCM, Castrillón AV, Beebe SE, et al. 2012. Development of a Mesoamerican intra-gene pool genetic map for quantitative trait loci detection in a drought tolerant x susceptible common bean (Phaseolus vulgaris L.) cross. Molecular Breeding 29: 71-88. https://doi.org/10.1007/s11032-010-9527-9
» https://doi.org/10.1007/s11032-010-9527-9 -
Cabral PDS, Soares TCB, Lima ABP, Soares YZB, Silva JA. 2011. Path analysis of grain yield of common bean (Phaseolus vulgaris L.) and its components. Revista Ciência Agronômica 42: 132-138 (in Portuguese, with abstract in English). https://doi.org/10.1590/S1806-66902011000100017
» https://doi.org/10.1590/S1806-66902011000100017 -
Contreras-Rojas M, Guzmán DGG, Mercado SAS, Salazar-Villareal FA. 2024. Path analysis of yield and yield components in snap bean (Phaseolus vulgaris L.) genotypes. Euphytica 220: 36. https://doi.org/10.1007/s10681-024-03298-2
» https://doi.org/10.1007/s10681-024-03298-2 -
Cruz CD. 2016. Genes software-extended and integrated with the R, Matlab and Selegen. Acta Scientiarum Agronomy 38: 547-552. https://doi.org/10.4025/actasciagron.v38i4.32629
» https://doi.org/10.4025/actasciagron.v38i4.32629 - Cruz CD, Carneiro PCS, Regazzi, AJ. 2012. Modelos biométricos aplicados ao melhoramento genético. 4ed. Editora UFV, Viçosa, MG, Brazil (in Portuguese).
-
Dawo MI, Sanders FE, Pilbeam DJ. 2007. Yield, yield components and plant architecture in the F3 generation of common bean (Phaseolus vulgaris L.) derived from a cross between the determinate cultivar ‘Prelude’ and an indeterminate landrace. Euphytica 156: 77-87. https://doi.org/10.1007/s10681-007-9354-1
» https://doi.org/10.1007/s10681-007-9354-1 -
Del Conte MV, Carneiro PCS, Resende MDV, Silva FL, Peternelli LA. 2020. Overcoming collinearity in path analysis of soybean [Glycine max (L.) Merr.] grain oil content. PLos ONE 15: e0233290. https://doi.org/10.1371/journal.pone.0233290
» https://doi.org/10.1371/journal.pone.0233290 -
Delfini J, Moda-Cirino V, Ruas CF, Santos Neto J, Ruas PM, Buratto JS, et al. 2017. Distinctness of Brazilian common bean cultivars with carioca and black grain by means of morphoagronomic and molecular descriptors. PLoS ONE 12: e0188798. https://doi.org/10.1371/journal.pone.0188798
» https://doi.org/10.1371/journal.pone.0188798 -
Demessie F, Gebresilassie W, Garedew W, Shifaraw G. 2024. Evaluation of common bean (Phaseolus vulgaris L) cultivars for yield and yield-related traits at Sekoru District, south western Ethiopia. American Journal of Applied Scientific Research 10: 1-16. https://doi.org/10.11648/j.ajasr.20241001.11
» https://doi.org/10.11648/j.ajasr.20241001.11 -
Gonçalves DL, Barelli MAA, Oliveira TC, Santos PRJ, Silva CR, Poletine JP, et al. 2017. Genetic correlation and path analysis of common bean collected from Carceres Mato Grosso State, Brazil. Ciência Rural 47: e20160815. https://doi.org/10.1590/0103-8478cr20160815
» https://doi.org/10.1590/0103-8478cr20160815 -
Instituto Nacional de Meteorologia [INMET]. 2021. Normais climatológicas do Brasil (1991-2020). INMET, Brasília, DF, Brazil. Available at: https://portal.inmet.gov.br/uploads/normais/NORMAISCLIMATOLOGICAS.pdf [Accessed Nov 24, 2024] (in Portuguese).
» https://portal.inmet.gov.br/uploads/normais/NORMAISCLIMATOLOGICAS.pdf -
Lemos RC, Abreu AFB, Souza EA, Santos JB, Ramalho MAP. 2020. A half century of a bean program in the South and Alto Paranaíba regions of Minas Gerais. Crop Breeding and Applied Biotechnology 20: e295420211. https://doi.org/10.1590/1984-70332020v20n2c27
» https://doi.org/10.1590/1984-70332020v20n2c27 -
Matzenauer R, Radin B, Maluf JRT. 2018. O fenômeno ENOS e o regime de chuvas no Rio Grande do Sul. Agrometeoros 25: 323-331 (in Portuguese). http://dx.doi.org/10.31062/agrom.v25i2.25510
» http://dx.doi.org/10.31062/agrom.v25i2.25510 -
Meenu M, Chen P, Mradula M, Chang SKC, Xu B. 2023. New insights into chemical compositions and health-promoting effects of black beans (Phaseolus vulgaris L.). Food Frontiers 4: 1019-1038. https://doi.org/10.1002/fft2.246
» https://doi.org/10.1002/fft2.246 - Montgomery DC, Peck EA, Vining GG. 2021. Introduction to Linear Regression Analysis. 5ed. Wiley, New York, NY, USA.
-
Oliveira JT, Ribeiro IS, Roque CG, Montanari R, Gava R, Teodoro PE. 2018. Contribution of morphological traits for grain yield in common bean. Bioscience Journal 34: 351-356. https://doi.org/10.14393/BJ-v34n2a2018-39701
» https://doi.org/10.14393/BJ-v34n2a2018-39701 -
Pedro C, Donça MCB, Somueque SI, Dique JEL, Bambo EC, Colial HV, et al. 2022. Variability, similarity network and genotypic path analysis of common bean yield traits. Functional Plant Breeding Journal 4: 13-22. http://dx.doi.org/10.35418/2526-4117/v4n2a2
» http://dx.doi.org/10.35418/2526-4117/v4n2a2 -
Ribeiro ND, Maziero SM. 2023. Environmental variability in indirect selection for grain yield in common bean lines. Scientia Agricola 80: e20220082. https://doi.org/10.1590/1678-992X-2022-0082
» https://doi.org/10.1590/1678-992X-2022-0082 -
Ribeiro ND, Santos GG, Andrade FF. 2024. Enhancing agronomic performance through genetic improvement of key traits in newly developed common bean cultivars cultivated in southern Brazil. Euphytica 220: 1. https://doi.org/10.1007/s10681-023-03261-7
» https://doi.org/10.1007/s10681-023-03261-7 - Sprent P, Smeeton NC. 2007. Applied Nonparametric Statistical Methods. 4ed. Chapman & Hall, New York, NY, USA.
- Steel RGD, Torrie J, Dickey D. 1997. Principles and Procedures of Statistics: A Biometrical Approach. 3ed. McGraw Hill, New York, NY, USA.
- Vencovsky R, Cruz CD. 1991. Comparison of methods for adjustment of plot yields with unequal stand. I. Simulated data. Pesquisa Agropecuária Brasileira 26: 647-657 (in Portuguese, with abstract in English).
-
Yuliawati, Yulianti N, Indriani RD. 2021. Genetic variability, heritability and relationships of yield and yield contributing characters in introduction kidney beans. Indonesian Journal of Applied Research 2: 50-58. https://doi.org/10.30997/ijar.v2i1.77
» https://doi.org/10.30997/ijar.v2i1.77
Edited by
- Edited by: