 Ultrasound-based prediction of canopy height and biomass in bermudagrass pastures: accuracy across distances and growth stages
ABSTRACT:
Ultrasound is a novel, indirect method that generates data instantly by continuously measuring canopy height, thereby eliminating the need for point-to-point measurements. These data are used to estimate canopy height, which is subsequently applied to calculate forage mass. The aim of this study was to calibrate the ultrasonic device to estimate canopy height and forage mass for ‘Tifton 85’ Bermudagrass under grazing management. A randomized complete block design with four replicates was used. Treatments were four distances between the ultrasonic device and the ground (50, 100, 150, and 200 cm). Canopy heights were evaluated at 7, 14, 21, and 28 days after a standardization cut. The experiment was conducted during the summer growing season in Selvíria, in the state of Mato Grosso do Sul, Brazil. The ultrasound device showed a high correlation, independent of the distance from the ground at which it was used (r = 0.91 to 0.94). However, when the correlation was analyzed for regrowth days, the highest correlation was at 21 and 28 days (r = 0.63). Forage mass was linearly adjusted with canopy heights for both methods, although greater precision and a lower coefficient of variation (CV) were observed with the ultrasound device at 200 cm from the ground (R2 = 0.86 vs 0.69, CV = 9.22 vs 14.1). The ultrasound device offers greater precision and accuracy than traditional direct methods, making it a useful tool for assisting managers in real time at both small and large scales.
Keywords:
Cynodon; indirect method; precision agriculture; sward; ultrasound
Introduction
Land accounts for approximately 38 % of the total global land surface, with two-thirds covered by meadows and pastures for grazing livestock (FAO, 2024). Thus, livestock has received considerable attention in recent years because animal feed production competes with human food production for land and other resources, as livestock consumes a third of all cereals produced and uses about 40 % of global arable land (FAO, 2018). In contrast, about 86 % of animal feed globally is inedible to humans, yet it is converted into valuable animal products for human consumption, making a significant contribution to global food and nutrition security (FAO, 2018).
One of the main challenges in livestock farming is how to best increase productivity, given the many inefficiencies in current forage management, especially the lack of monitoring and control of forage mass. This is critical in tropical climates, where rapid growth and senescence require precise strategies to optimize forage yield (Rodrigues et al., 2024). One of the most effective strategies that supports management decisions in pastoral systems is defining adequate stocking rates ('t Mannetje, 2000; Lantinga et al., 2004). Improved forage use efficiency may reduce the need for pasture area and allow land to be reallocated for other uses, such as food production for human.
Several methods are available to estimate forage mass. Direct methods involve cutting, weighing, and drying forage from a known area. Indirect methods require minimal or no removal and rely on tools or sensors. These quicker, less labor-intensive approaches are useful in large pastures or when data are needed immediately (Lantinga et al., 2004).
There are several indirect methods, including visual estimation, compressed or uncompressed canopy height measurements, and electronic tools (Hutchings et al., 1990; Lantinga et al., 2004; Fricke et al., 2011). However, the ultrasonic method offers potential advantages over other indirect approaches, as it can operate above the canopy without physical contact with the forage and provides continuous measurements without requiring point-to-point sampling. This study aimed to calibrate an ultrasonic device to estimate the canopy height and forage mass accumulation for ‘Tifton 85’ Bermudagrass [Cynodon dactylon (L.) Pers.] using regression models and to compare it with the traditional method.
Materials and Methods
Experimental site
The experiment was conducted at the Universidade Estadual Paulista (UNESP) experimental farm in Selvíria, in the state of Mato Grosso do Sul, Brazil, from 08 Dec 2020 to 20 Mar 2021. The biome is classified as Brazilian savannah with low altitude (20°21’00.4" S, 51°24’24.3" W, altitude 335 m), and the soil in the area was classified as a typical Dystroferric Red Latosol (FAO, 2006). According to Köppen's classification, the climate of the region is categorized as Aw climate (tropical humid), characterized by rainy summers and dry winters, with an average, minimum, and maximum air temperature of 25.2, 19.6 and 31.8 °C and accumulated rainfall of 1,274 mm (FEIS, 2025).
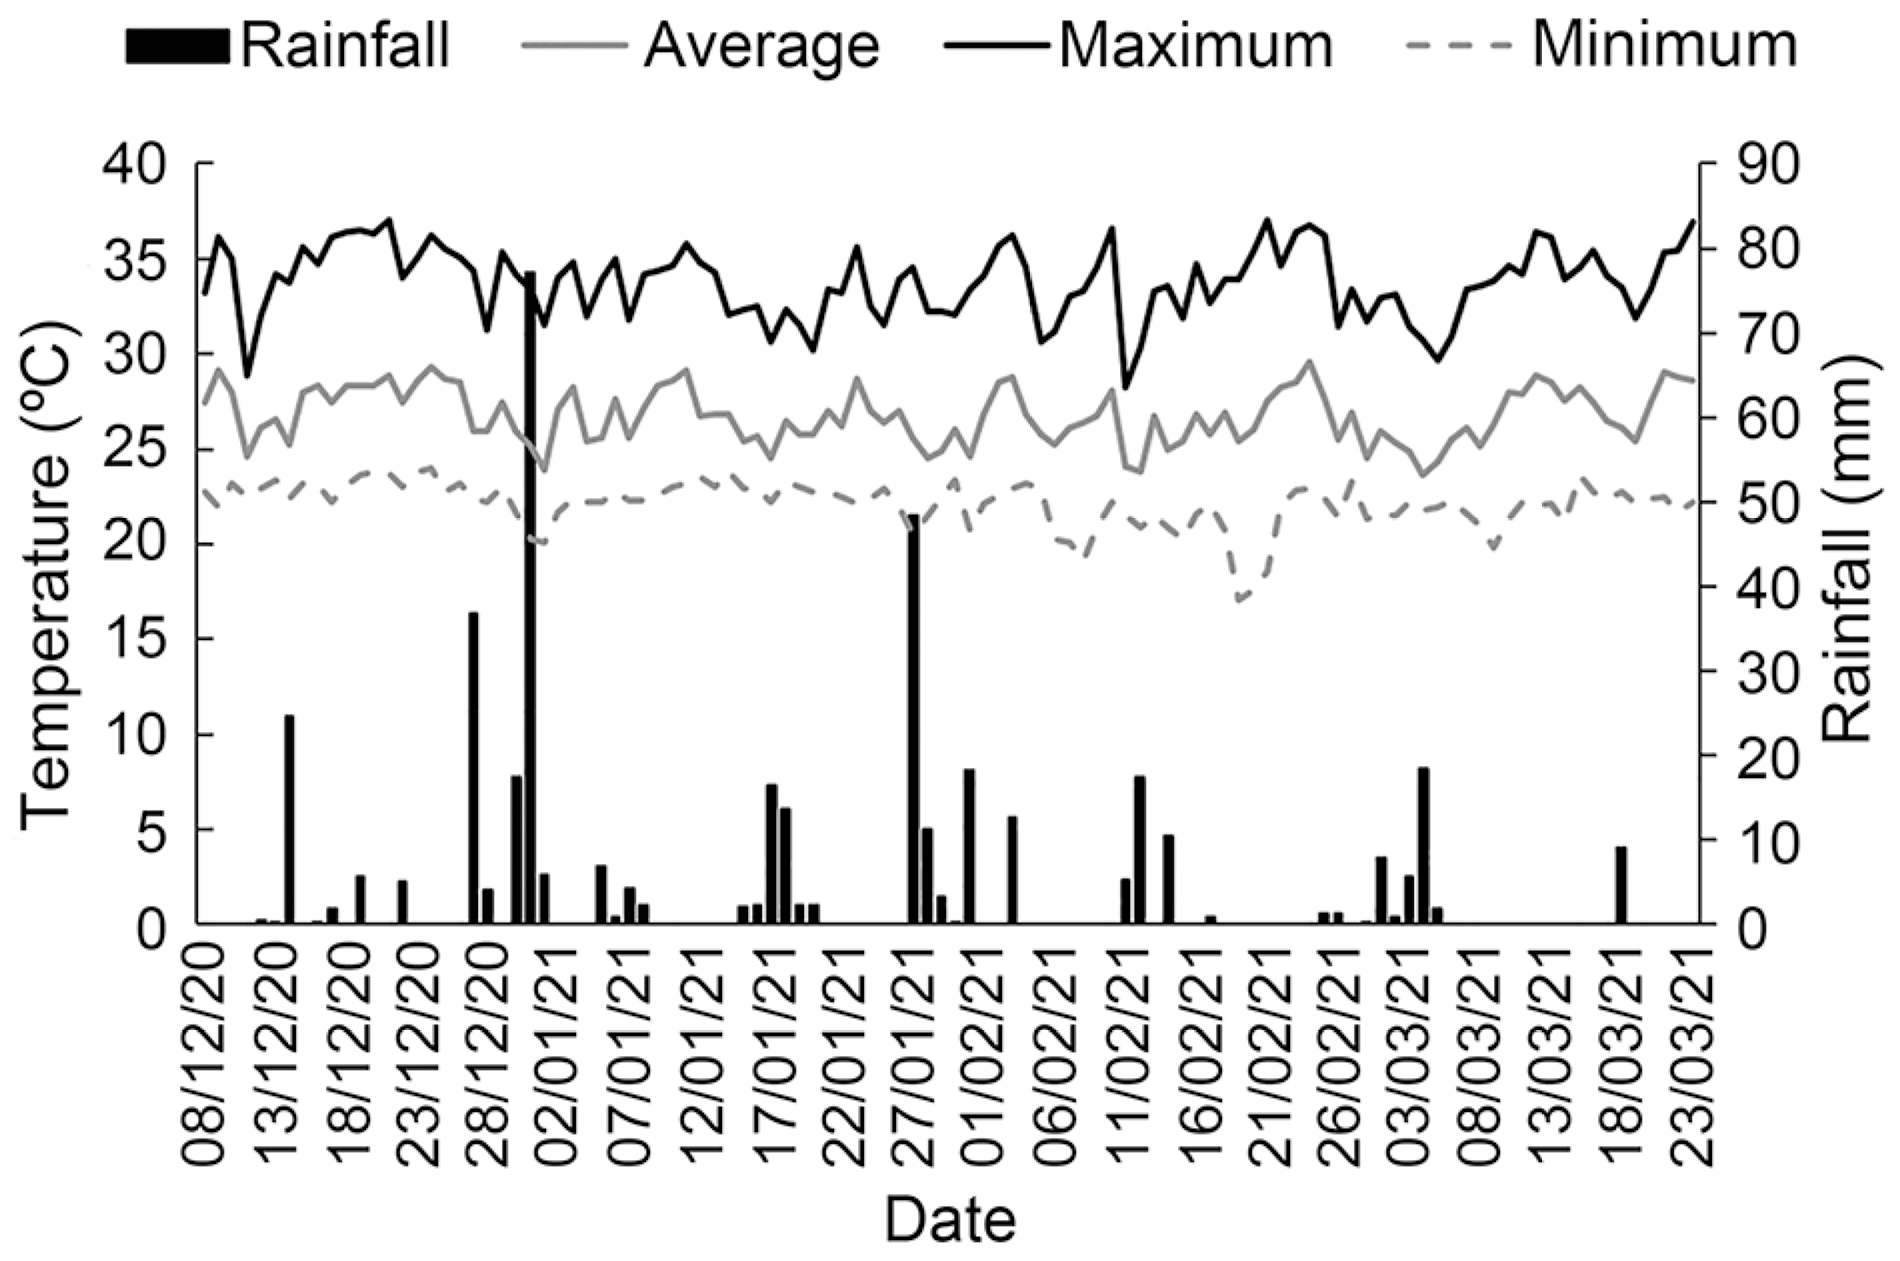
Air temperature data were collected from an automated weather station at the UNESP in Ilha Solteira, in the state of São Paulo, Brazil, located of 9,775 m from the experimental area. The accumulated precipitation during the experiment period was 35.04 mm, recorded by three rain gauges placed at different points in the experimental area. The rainfall data, along with average, maximum, and minimum temperatures, and accumulated precipitation, recorded during the experimental period, are shown in Figure 1.
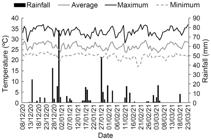
Temperatures and rainfall at the experimental site carried out in Selvíria, in the state of Mato Grosso do Sul, Brazil.
Trial
The trial was conducted under irrigated conditions at a location with mobile internet (3G) access, enabling real-time data transfer from the ultrasonic device to a smartphone (Android) via Bluetooth. All plots were irrigated using a central pivot system to maintain soil moisture near field capacity throughout the experimental period.
The experimental area consisted of 3 × 3 m plots, with evaluations carried out in a central 6.25 m2 area. A standardization period was first implemented, during which three successive cuts were made to eliminate pre-existing biomass and standardize post-defoliation stubble height (h) at 10 cm. After each cut, fertilization was applied at 50 kg ha−1 of N, 21 kg ha−1 of P2O5, and 50 kg ha−1 of K2O (Cantarella et al., 2022), followed by irrigation. The same fertilization schedule was maintained during the experimental period.
The experimental design was a randomized complete block with four replications (n = 64). Treatments consisted of four fixed distances between the ultrasonic-based device and the soil surface: 50, 100, 150, and 200 cm. Canopy height was evaluated at four forage regrowth stages: 7, 14, 21, and 28 days after the standardization cut.
The primary aim of the study was to generate a wide range of canopy heights to enable calibration of regression models by comparing two canopy height estimation methods: direct measurement using a conventional method and an ultrasonic-based device. For each combination of ultrasonic-based device and regrowth period, simultaneous measurements were taken using both methods. These data were used to construct simple linear regression models, evaluate the coefficient of determination (R2), parameter significance, and residual behavior, in order to assess the agreement and accuracy between methods.
Ultrasonic data collection
An HC-SR04 Ultrasonic Distance Sensor with dimensions 45 × 20 × 15 mm was connected to an Arduino microcontroller and attached to a measuring tape. The device was equipped with a battery and an on-off button to start and stop measuring the samples during the sampling process, respectively. A C++ Arduino-based code was written to control the device and record the data. The sensor uses sonar to determine distance and reads from 2 to 400 cm, covering an area of 155°, which represents a cone inclined by 15° (HC-SR04 ultrasonic sensor; HC-SR04 ultrasonic sensor and Arduino). It was then manually held at a constant distance from the ground equivalent to h (50, 100, 150 and 200 cm) as a convenient reference for all experiments. Since the sensor recognizes objects placed in front of it, to obtain an accurate measurement of the actual h value of the canopy height, the distance measured was subtracted from h. The device was manually held perpendicular to the ground in a previously chosen area. Afterwards, 5-min measurements at a sampling rate of 2 points s−1 (as defined in the Arduino script) were obtained, yielding approximately 600 points. The data were saved on an SD card coupled to the device. Once all measurements were completed, the data were converted to .txt files for offline analysis.
Data collection through the ultrasonic-based device and stick methods
The first method was carried out with the ultrasonic-based device, which remained on for 5 min per plot at a rate of two observations per second, resulting in an arithmetic average per assessment. The second method for estimating canopy height, referred to herein as the stick method, involved the use of a graduated measuring stick in combination with a light polyethylene sheet (21 × 30 × 0.02 cm), which was gently placed on top of the forage canopy to create a uniform reference surface (Pedreira et al., 2018). Due to the irregular growth pattern of the pasture and the flexibility of the polyethylene sheet, both the nearest and farthest distances from the sheet to the ground were measured, and their arithmetic mean was recorded as the canopy height (n = 10). This method was used as the conventional reference for comparison with the ultrasonic-based device measurements. Subsequently, to represent forage that is available for animal grazing, the fresh weight of the total mass 10 cm above the soil surface was recorded inside a 50 by 50-cm quadrant, and a fresh subsample for each plot was taken (± 0.5 kg), which was then oven-dried to determine dry matter (DM) (60 °C for 72 h).
Statistical analysis
Statistical analyses were carried out using SAS (SAS Institute, 2001). Before the analysis of variance, the Kolmogorov-Smirnov test was applied in PROC UNIVARIATE to assess the normality of each variable's residuals. The parameterization was carried out through adjustments such as simple linear regression (Y = β0 + β1x1 + ε) of empirical mathematical models using the REG procedure. The parameterization of the models was evaluated through the significance of the parameters β0 and β1x1 (p ≤ 0.05), R2, and coefficient of variation (CV) %.
Results
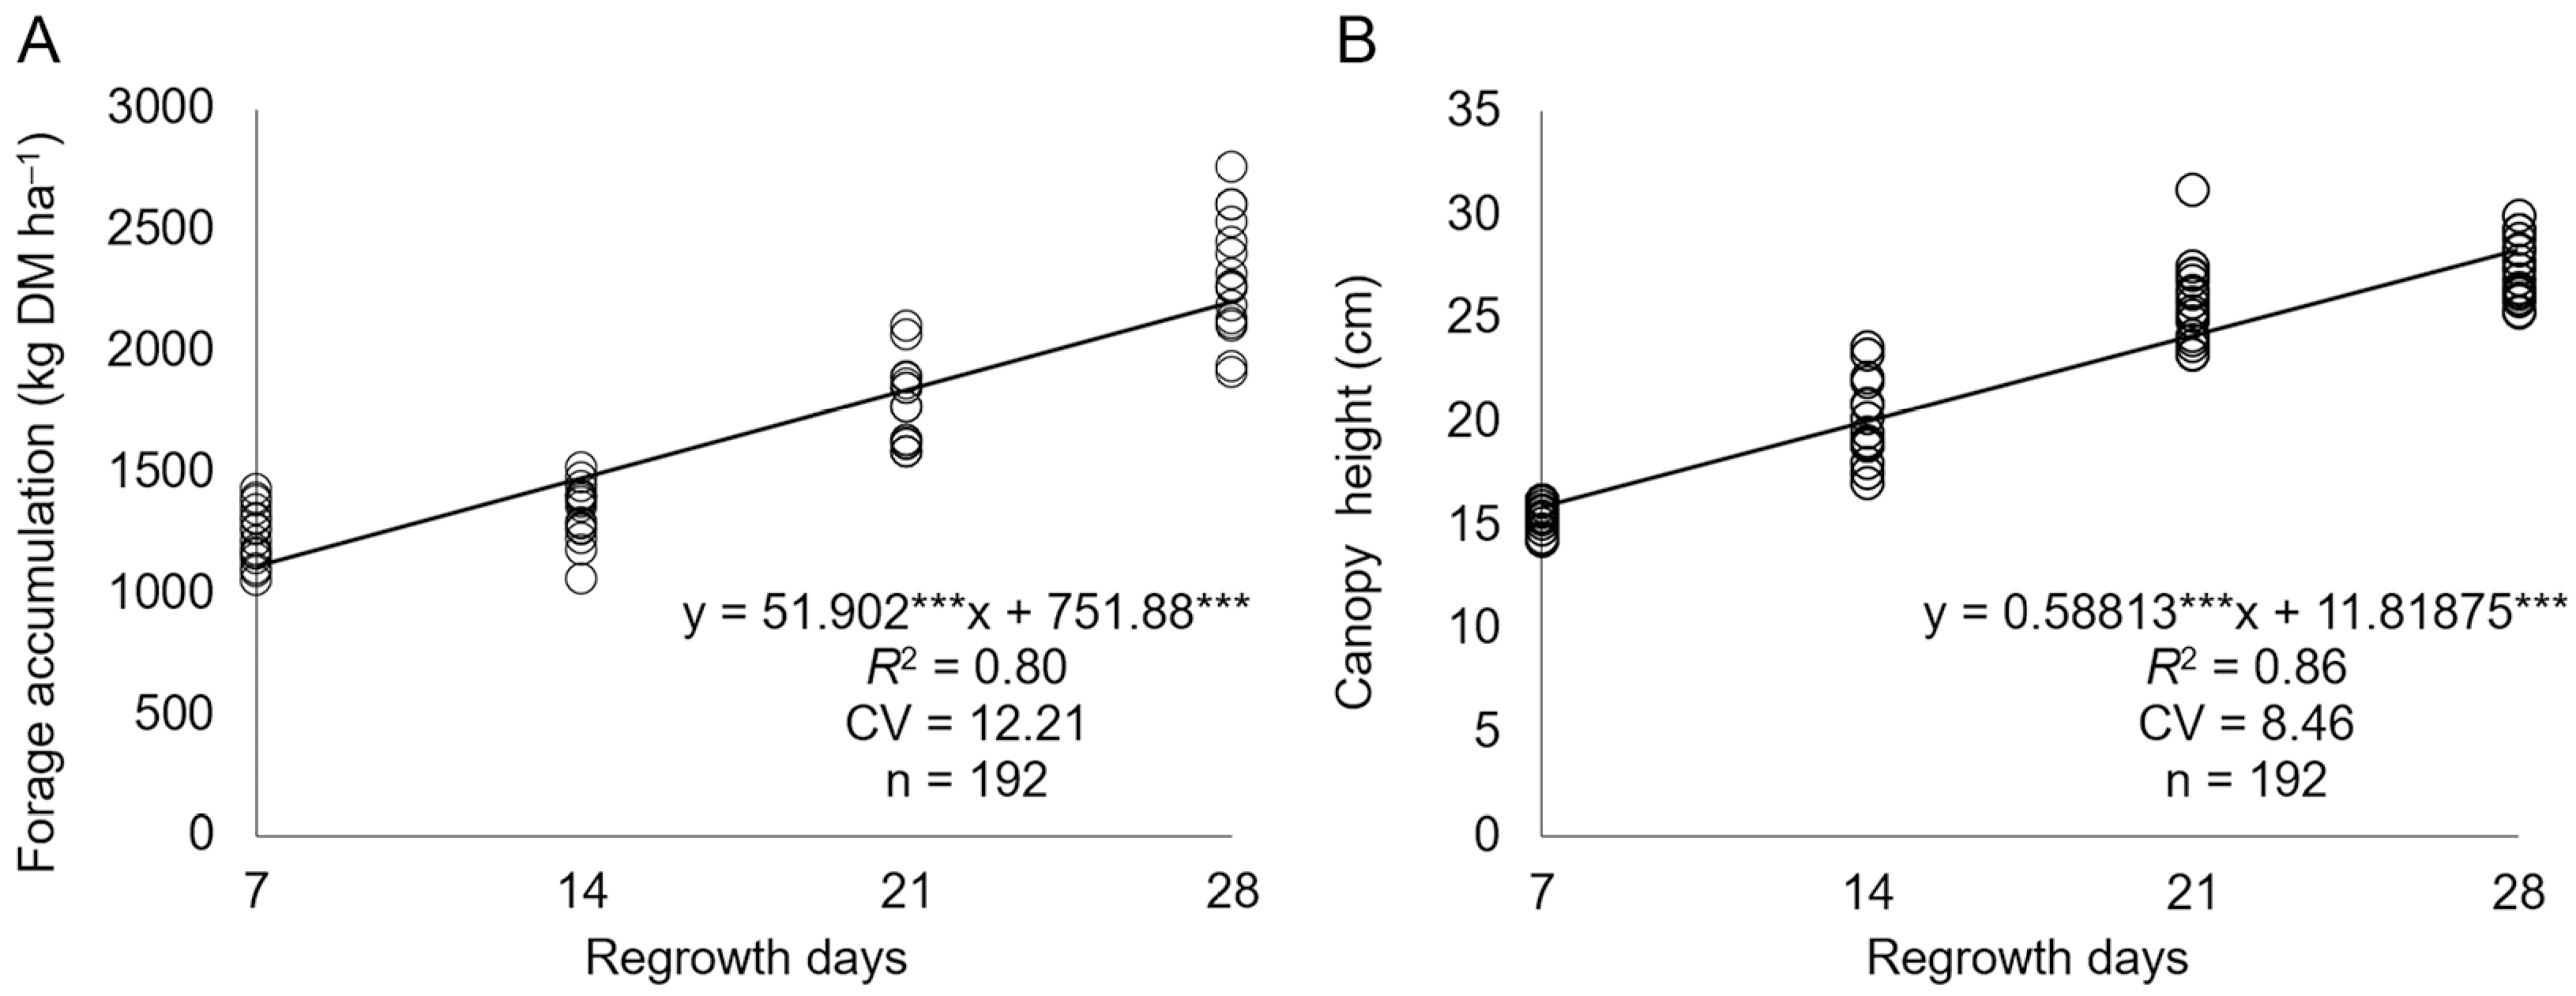
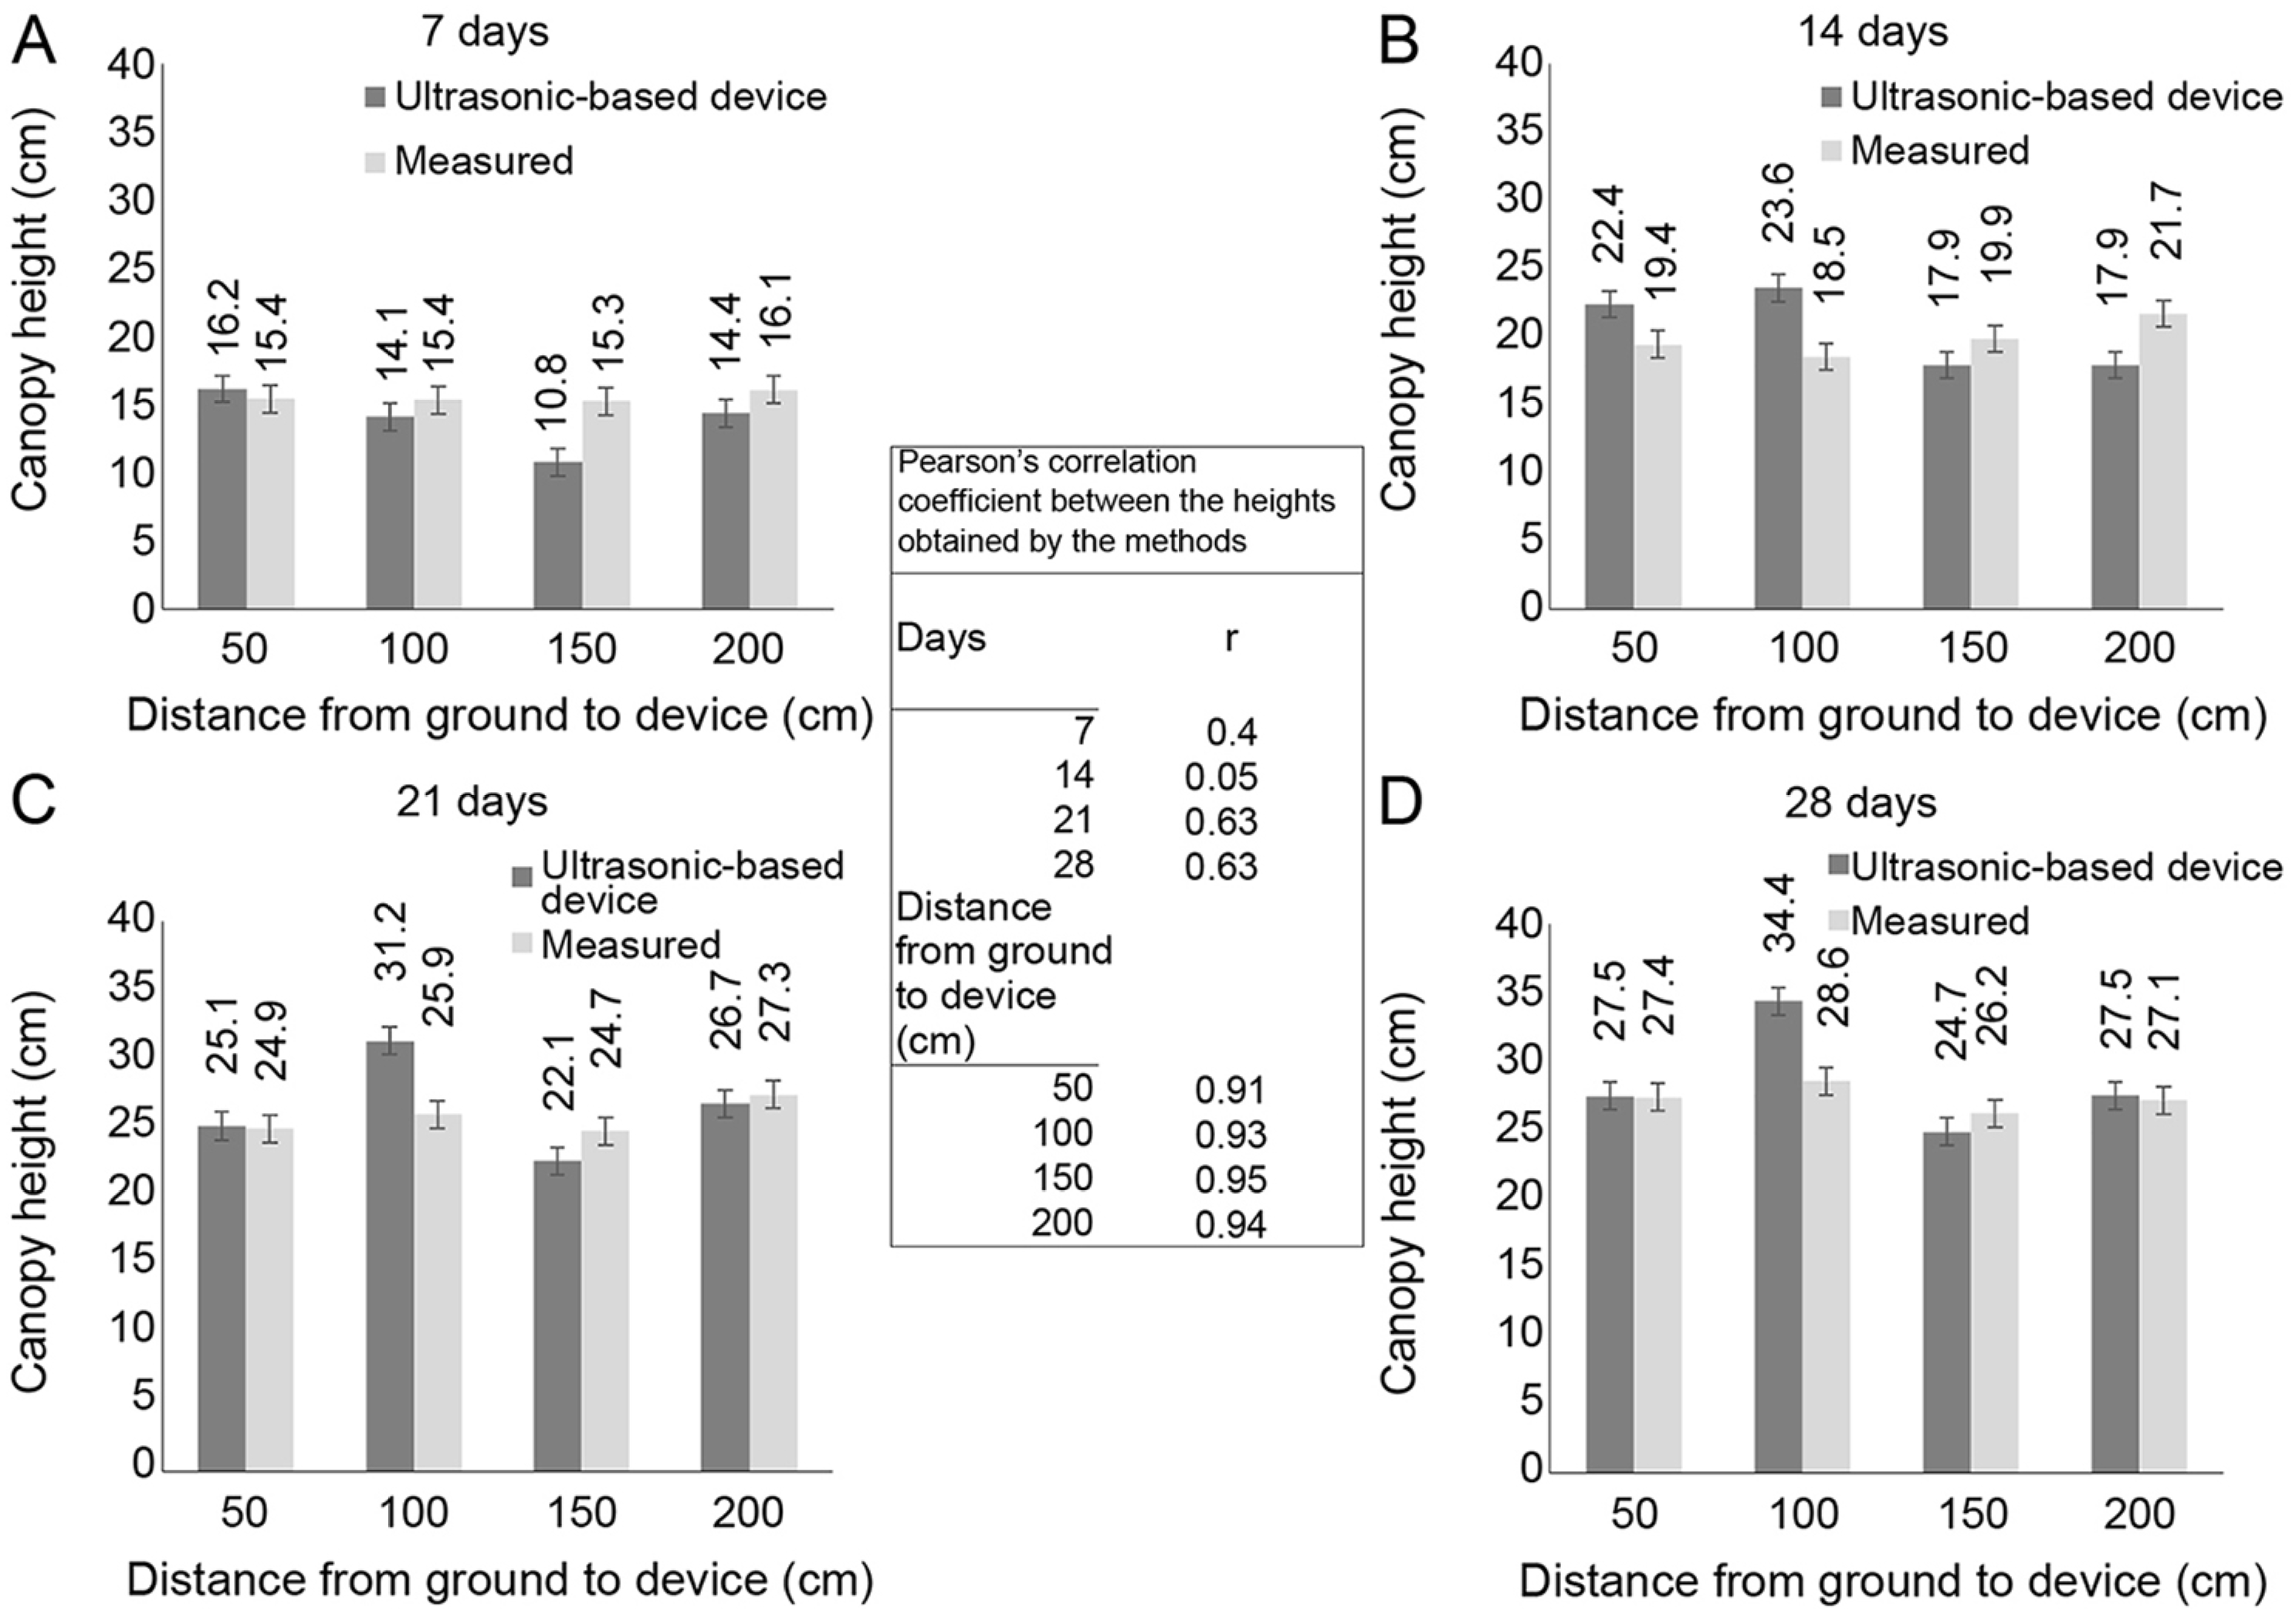
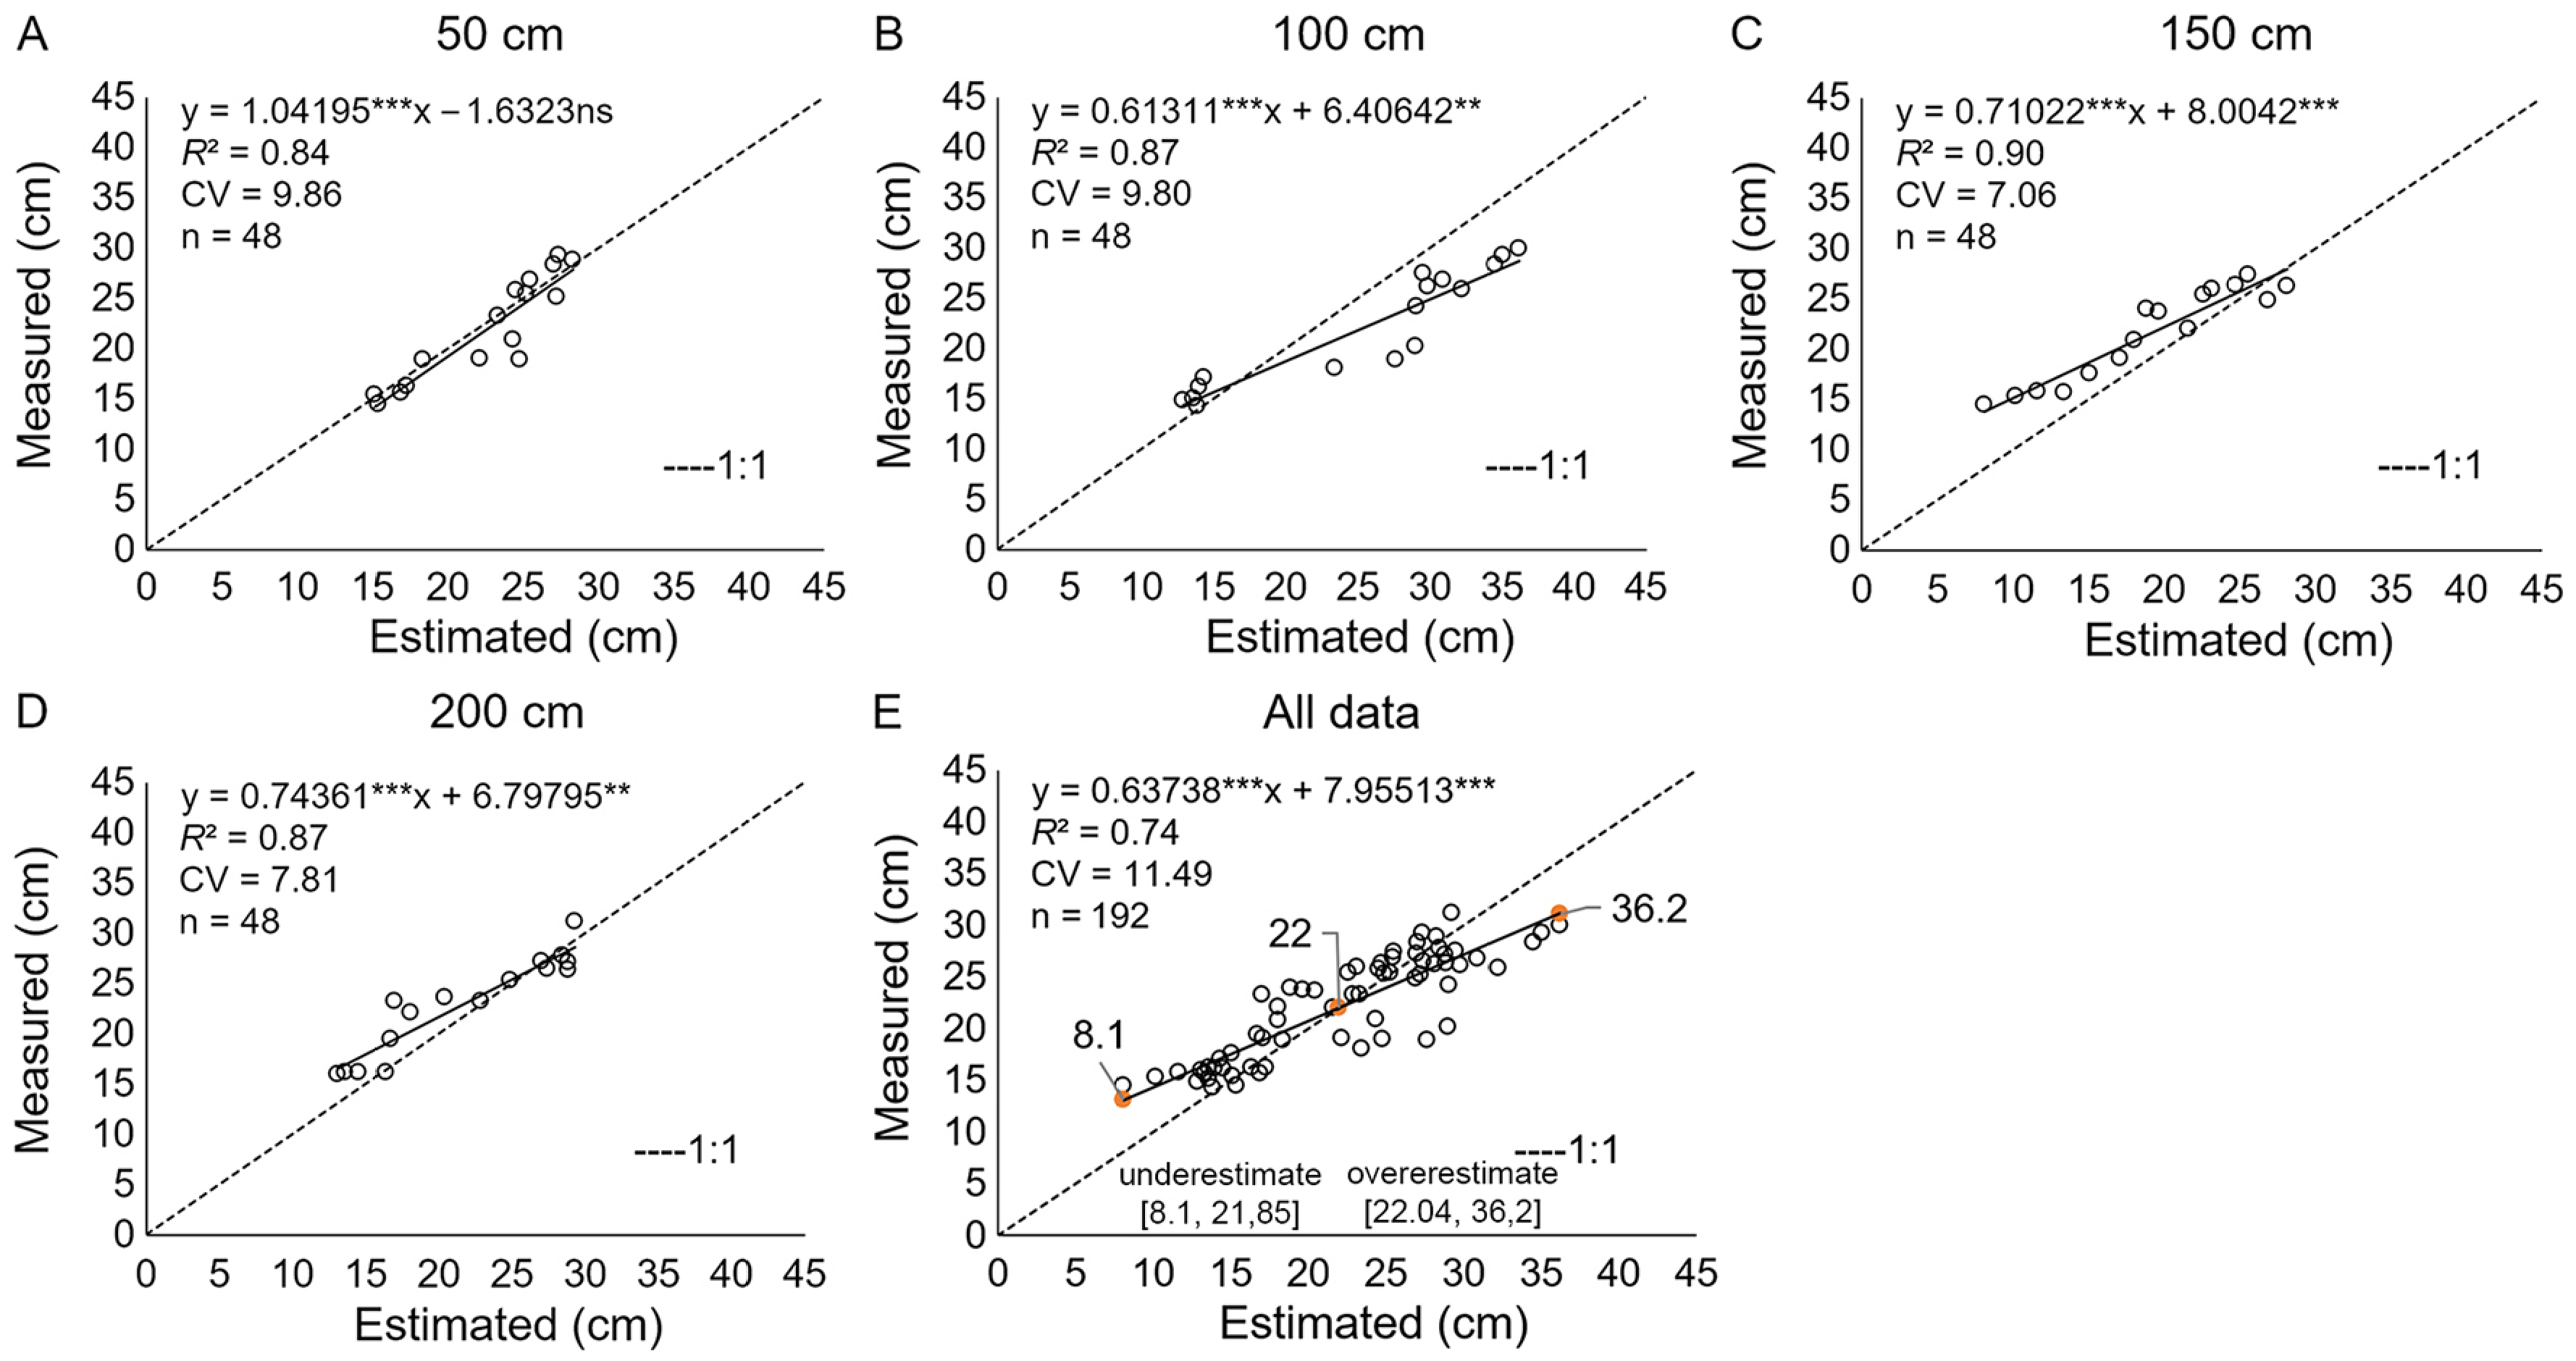
The canopy height was measured by the stick method, and the forage accumulation showed linear adjustments with regrowth days (p ≤ 0.001) and high correlation between them (r = 0.84, p ≤ 0.001). The range of forage accumulation was from 1,115 to 2,205 kg DM ha−1 and canopy height from 15.9 to 28.3 cm, with respective average daily increments of 51.9 kg DM ha−1 and 0.59 cm (Figure 2A and B). The average canopy heights observed with the two methods for each day of regrowth are presented in Figure 3A-D. In general, the two methods showed similar averages for the same distance that the device was held in relation to the ground (Figure 3A-D), and high correlations between the two methods, with values of 0.91, 0.93, 0.95, and 0.94 as the device distanced itself from the ground, respectively (Figure 3A-D). The correlation between the two methods for each day of regrowth, and the average distance of the device in relation to the soil surface, was very low up to 14 days of regrowth (r ≤ 0.4) (Figure 3A and B) and reasonable between 21 and 28 days (r = 0.63) (Figure 3C and D). The empirical models of the relationship between canopy height values measured by the stick method and those estimated by the device based on distance from the ground were linear and positively correlated with high precision (R2 ≥ 0.84, p ≤ 0.05) (Figure 4A-E). The highest R2 was observed for the distance of 150 cm, which also had the lowest CV (7.06 %). The regression adjustments showed a high degree of accuracy (p ≤ 0.001), with the best angular coefficient at 50 cm from the ground (1.04 cm cm−1), decreasing to 0.74, 0.71, and 0.61 cm cm−1 at 200, 150, and 100 cm, respectively (Figure 4A-E).
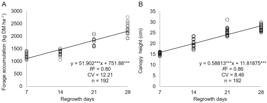
A) Forage accumulation and B) canopy heights measured by the stick method, during regrowth days of ‘Tifton 85’ Bermudagrass. Data from three consecutive regrowth periods. ***p ≤ 0.001. DM = dry matter; R2 = coefficient of determination; CV = coefficient of variation (%); n = number of observations.
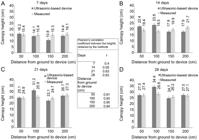
Average of ‘Tifton 85’ Bermudagrass canopy heights estimated with the ultrasonic-based device and measured with the stick method at A) 7, B) 14, C) 21, and D) 28 days (d) after uniform cutting and Pearson's correlation (r) between them. Data from three consecutive regrowth periods. Each point is the average of 12 plots, and the vertical bars represent the mean standard error.
When the linear regression was fitted using all the data (n = 192), regardless of the distance from the ground to the device, the CV was higher compared to the other regressions (11.92 vs 7.06 % to 9.86 %) within an acceptable range and with high precision (R2 = 0.74; p ≤ 0.001) (Figure 4A-E). However, the accuracy for this adjustment was less (0.64 cm cm−1, p ≤ 0.001), and the proximity of the linear equation to the 1:1 relative line revealed a clear underestimation in the range [8.1, 21.85] and an overestimation in the range from [22.04, 36.2], the most precise and accurate value being at a canopy height of 22 cm (Figure 4E).
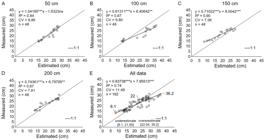
Relationship between canopy heights of ‘Tifton 85’ Bermudagrass estimated by the ultrasonic-based device at distances of A) 50, B) 100, C) 150, and D) 200 cm from the ground to the device, and measured by the stick method. Data from three consecutive regrowth periods. The shaded areas and filled circles in the graphic. E) All data represent values of interval notation and the abscissa axis, respectively. ***p ≤ 0.001; **p ≤ 0.01. ns = nonsignificant; R2 = coefficient of determination; CV = coefficient of variation (%); n = number of observations.
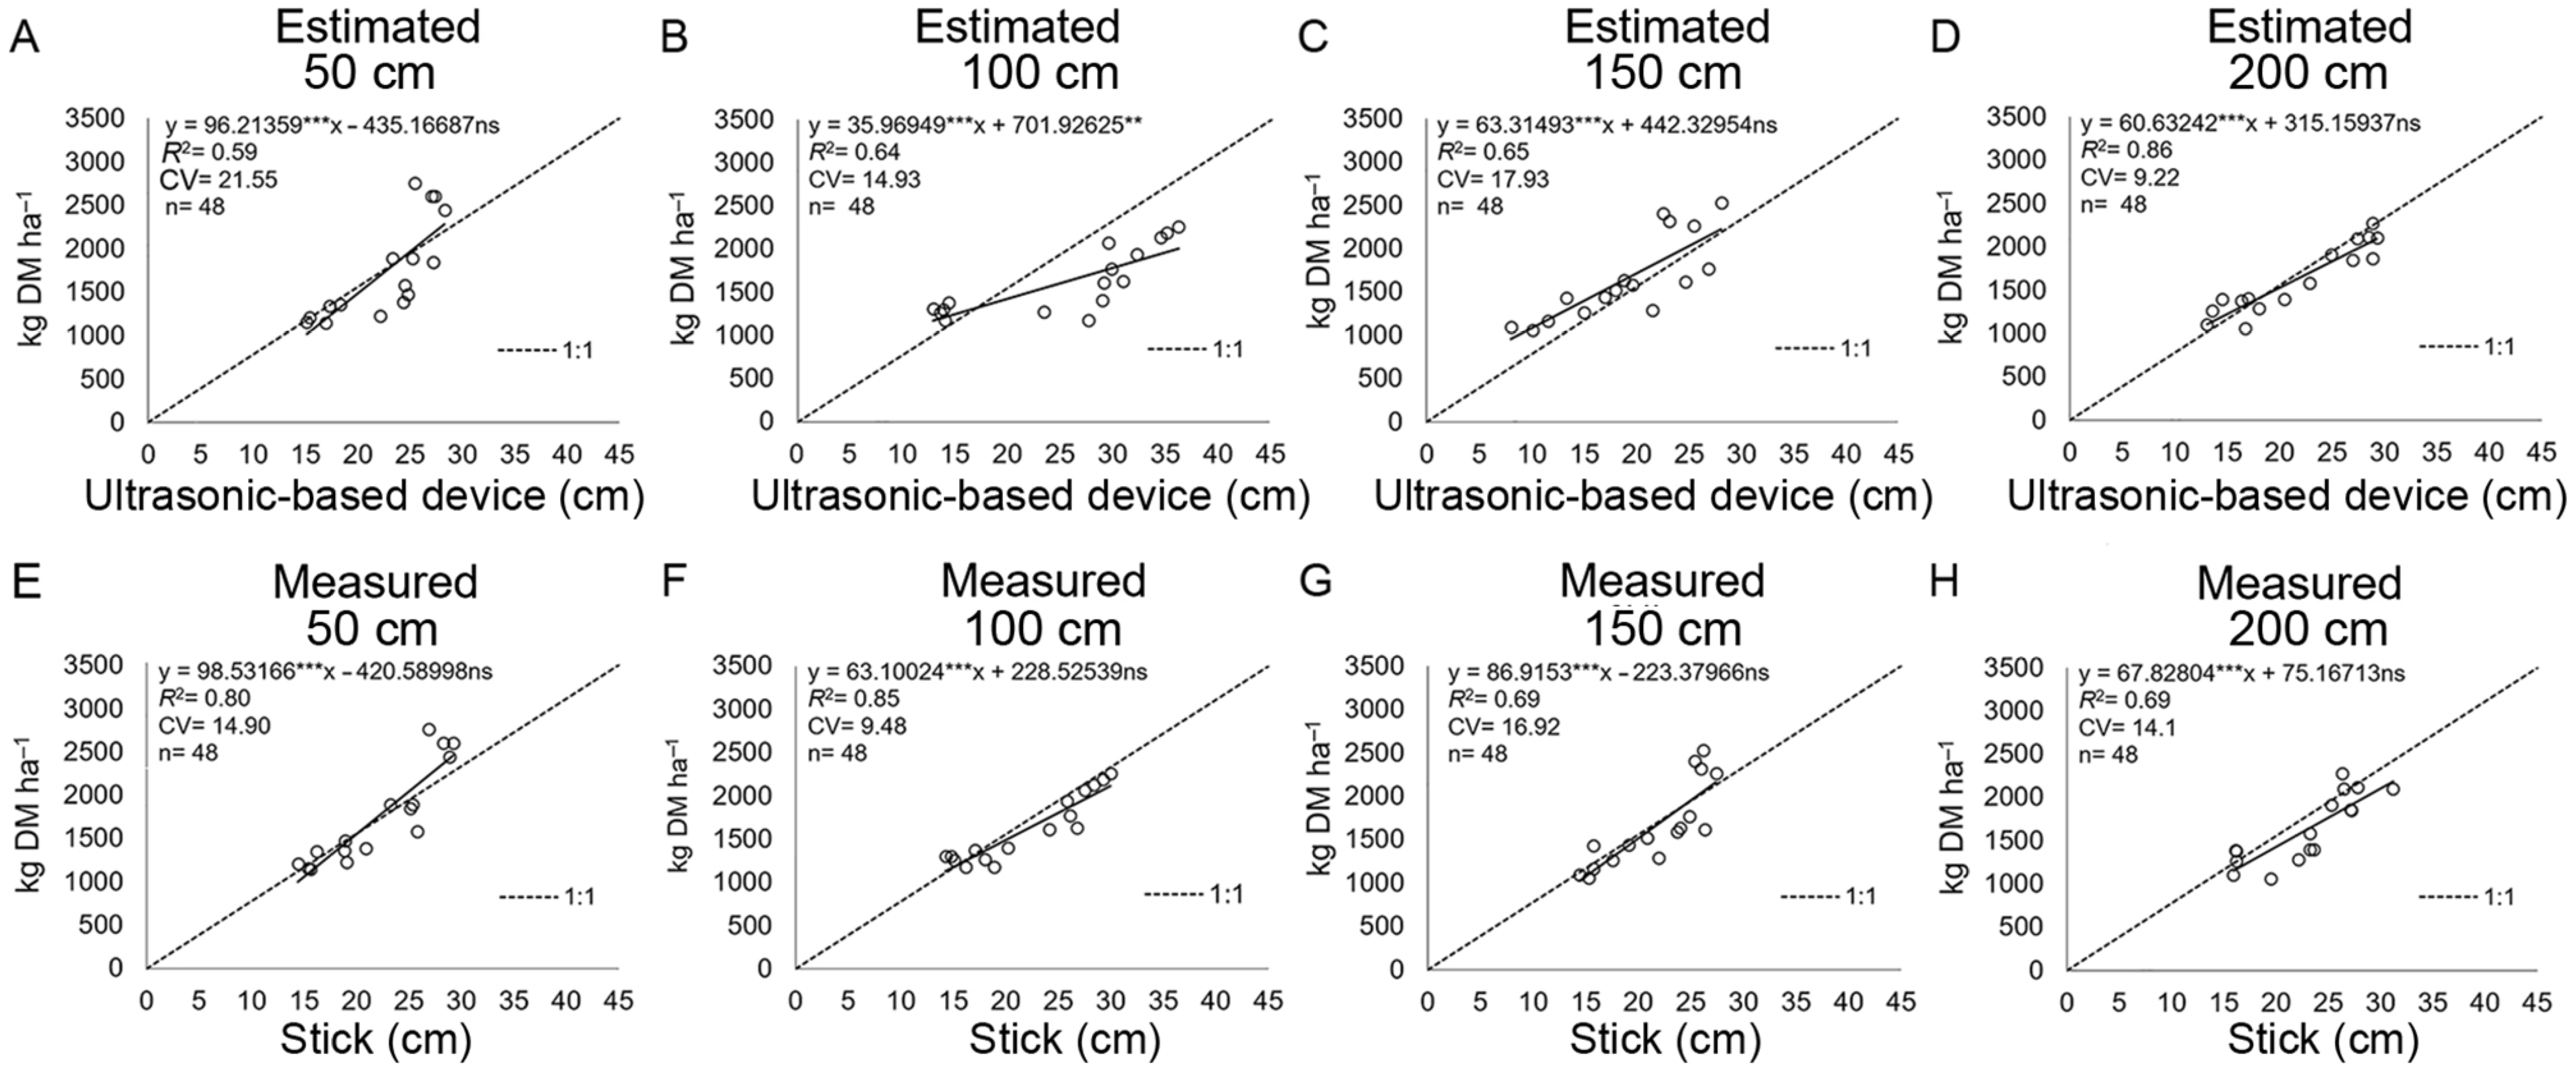
The fittings between the canopy heights measured using the stick method or estimated using the ultrasonic device and forage mass accumulation are presented in Figure 5A-H. Although the legend includes the distance from the ground to the device, the regressions with the measured heights were determined by the direct method using the stick method (Figure 5A and B), shown for comparison with the method estimated by the device (Figure 5E-H). All regressions were positively and linearly fitted, and the angular coefficients were significant (p ≤ 0.001) while the intercepts were equal to zero (p ≥ 0.05) (Figure 5A-H). The stick method showed less variation between treatments, and in general, the equations were satisfactorily parameterized (R2 from 0.69 to 0.85 %) while the method with the device showed lower precision (R2 from 0.59 to 0.86 %) and higher CV (9.2 to 21.55 %). The highest degree of accuracy with the device was observed for readings at 50 cm from the ground (96.21 kg DM ha−1), although only 59 % of the variation in productivity was explained by the variation in canopy height, possibly due to the high CV (21.55 %). The opposite result was observed for the distance from 200 cm, with R2 of 0.86 % and an angular coefficient of 60.63 kg DM ha−1 (Figure 5A-H).
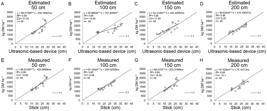
Simple linear regressions calibrated to estimate the forage accumulation of ‘Tifton 85’ Bermudagrass, using canopy height A-D) estimated with an ultrasonic-based device and E-H) measured by the stick method for four distances to the ground (50 to 200 cm). Data from three consecutive regrowth periods. ***p ≤ 0.001; ** p ≤ 0.01. DM = dry matter; ns = nonsignificant; R2 = coefficient of determination; CV = coefficient variation (%); n = number of observations.
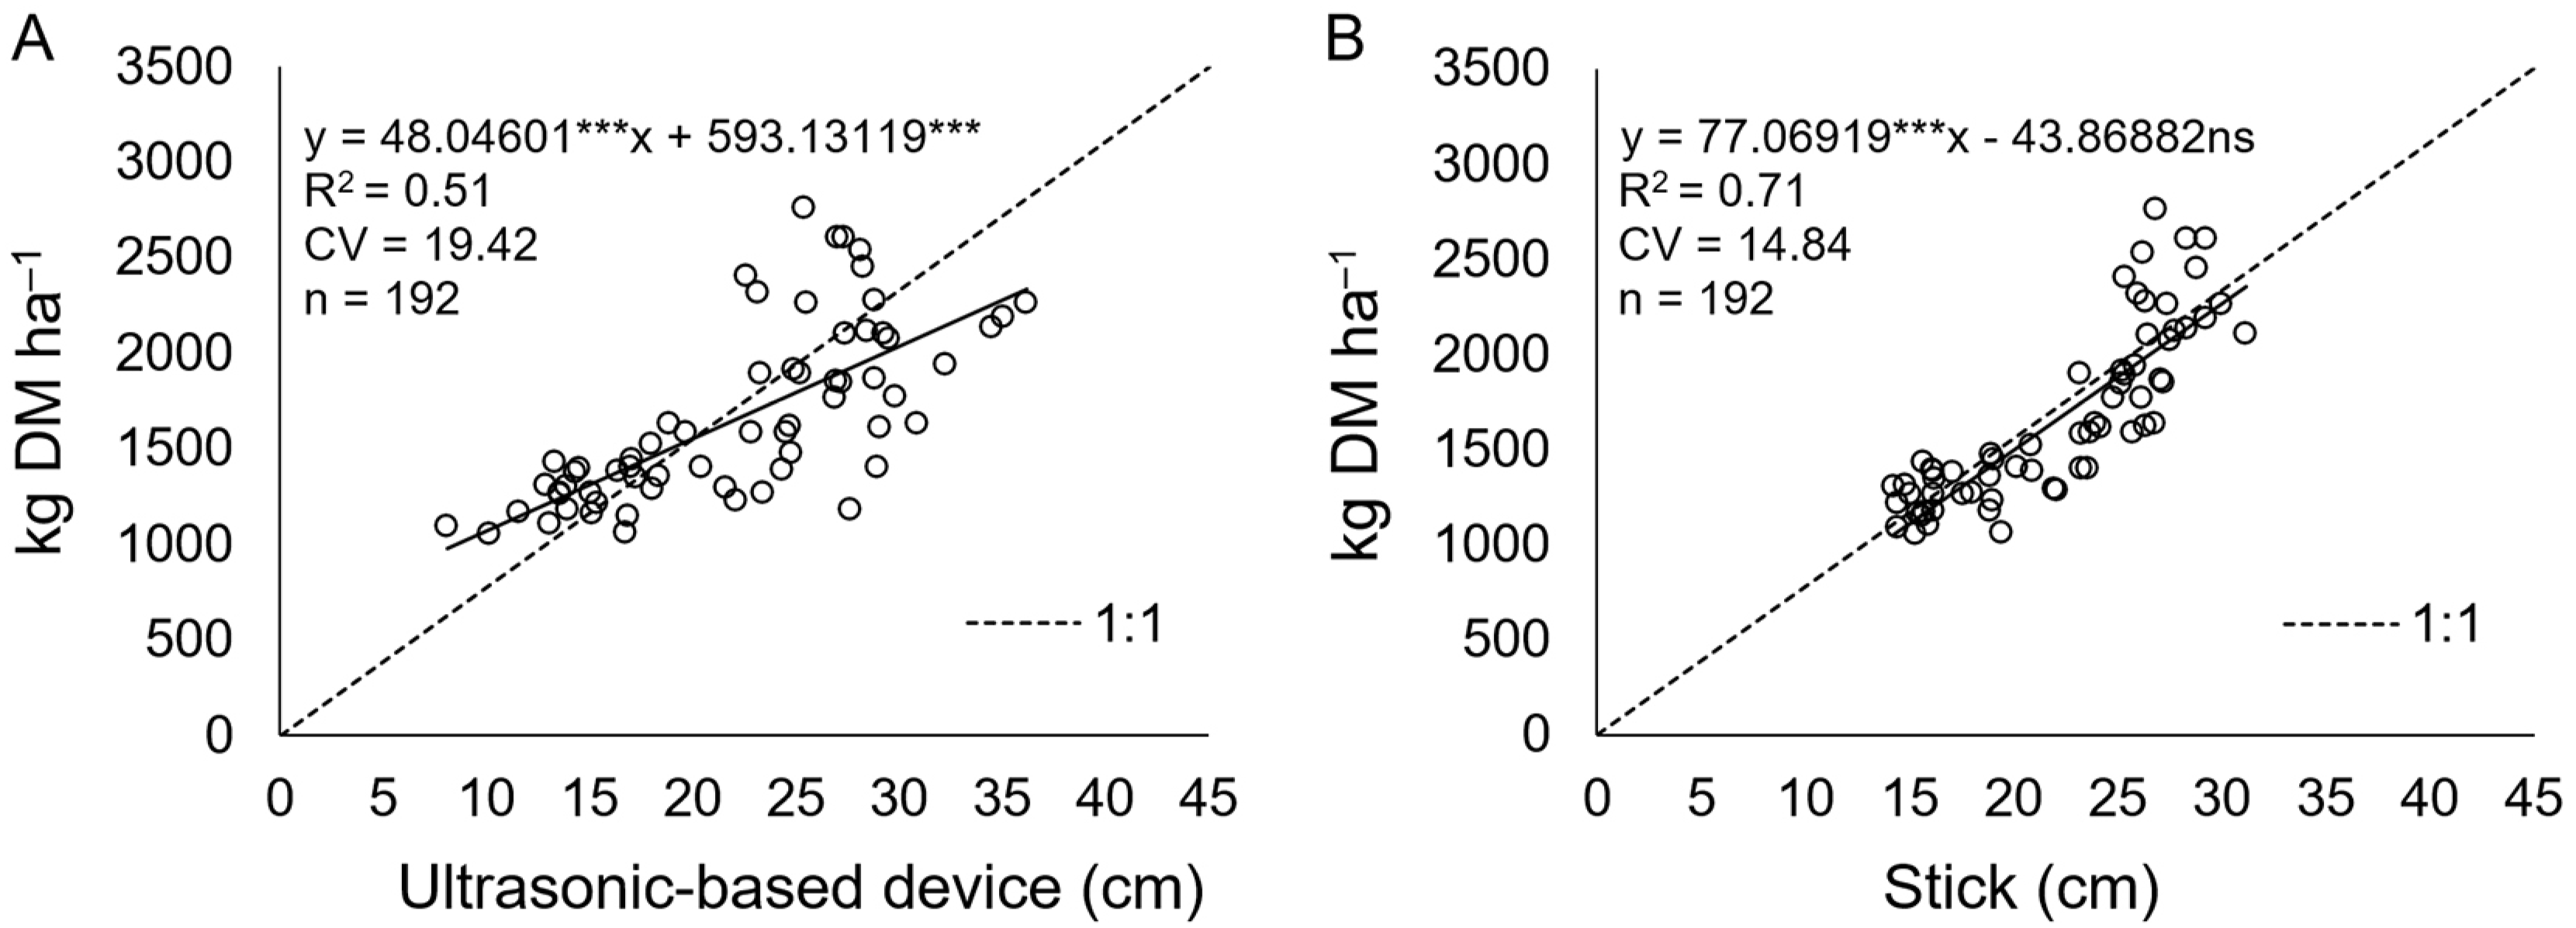
When regression was performed incorporating all the data (n = 192), a linear fit was observed (p ≤ 0.001) and satisfactory parameters for the ruler method (R2 = 0.71 % and angular coefficient of 77.06 kg DM ha−1), rendering the equation more robust and reliable for application to a wider range of ‘Tifton 85’ Bermudagrass heights (14.3 to 31.2 cm) (Figure 6B).
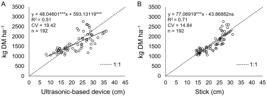
Simple linear regressions calibrated to estimate the forage accumulation of ‘Tifton 85’ Bermudagrass, using canopy height A) estimated with an ultrasonic-based device and B) measured by the stick method for four distances to the ground (50 to 200 cm). Data from three consecutive regrowth periods. ***p ≤ 0.001. DM = dry matter; ns = nonsignificant; R2 = coefficient of determination; CV = coefficient variation (%); n = number of observations.
However, the same was not observed for the regression fitted with all the data estimated by the device (Figure 6A), which did not show improvements in the same proportion despite the linear equation being significant (p ≤ 0.001), since the R2 remained low (0.51 %), suggesting that other sources of variation were also contributing to the increase in forage accumulation. Observing the distribution of the data, an underestimation of forage accumulation at lower heights and an overestimation at higher heights is evident (Figure 6A and B), similar to what occurred when the regression was adjusted between the observed canopy heights with a measuring tape and the device (Figure 4E).
Discussion
The high correlation between forage accumulation and the respective canopy height of ‘Tifton 85’ Bermudagrass, observed when using the stick method (r = 0.84), indicates that height is a reliable independent variable to estimate forage accumulation through simple linear regression, making it a useful tool for forage management and adjusting stocking rates (Andrade et al., 2016).
However, it is important that, at the time of measurement, the pasture has a relatively dense, well-developed canopy, as observed in this experiment. Although complete uniformity is rarely achieved under grazing or cutting conditions, areas with excessive soil exposure or abrupt structural variation may compromise the accuracy of this and other indirect estimation methods, as reported by Moterle et al. (2017). Forage mass estimates based on canopy height were influenced by canopy structure, as observed in pastures of C. dactylon under both grazing and no grazing conditions (Gonzalez et al., 1990). In another study, using the plate meter and the graduated stick on Cynodon spp. cultivars ‘Florakirk’, ‘Tifton 85’ and ‘Coastcross’ under continuous grazing with pasture heights of 5, 10, 15 and 20 cm, R2 values of 0.77 and 0.81 were obtained, respectively, during the summer with the ‘Tifton 85’ Bermudagrass (Silva and Cunha, 2003).
Thus, it is understood that the height estimated by the device can be an alternative to the height measured by the stick method, since in this study the two methods showed high correlation with each other regardless of the distance from the ground to the device (r from 0.91 to 0.95) (Figure 3A-D). However, this interpretation must be treated with caution and will only make sense if, instead of the regrowth days (7, 14, 21 and 28 days), the entire growth period is considered, which in this experiment corresponded to 28 days (Figure 2A and B). This analysis is important because the correlations between the heights obtained by the two methods become unsatisfactory when carried out within each day of regrowth, with low values from zero to 14 days of regrowth. It is possible that, due to low canopy density, a high proportion of uncovered soil at the beginning of growth after defoliation will disfavor the indirect method, since the device will intercept both the soil and the canopy at different heights, resulting in an underestimated average. This fact will be attenuated by the growth of the grass, which explains the increase in correlation from 0.05 to 0.63 after 21 days of growth (Figure 3A-D).
The calibration equations for all distances between the ground and the device showed significant adjustments in height across these methods, with reduced CV and increased R2 when the device was adjusted at 150 cm above the ground (Figure 4A-E). The sensor used in this study emitted ultrasound waves with an angular opening of 15°, and the closer to the ground, the smaller the reading area, which increases with distance. Therefore, the device can be held manually or coupled to a drone without compromising the canopy height estimates.
When data from all treatments were grouped to calibrate a single equation with the aim of estimating the canopy height of ‘Tifton 85’ Bermudagrass, regardless of the distance from the device to the ground, the result was once again satisfactory (p ≤ 0.001) with acceptable degrees of precision and accuracy, rendering it the most robust and representative calibration equation for the condition of the pasture under study. According to Thomson (1986), the coefficient of determination should be at least 0.75 %.
Calibration equations were also carried out between the heights obtained by the two methods and the forage accumulation of ‘Tifton 85’ Bermudagrass (Figure 5A-H). The fit did not follow the same patterns observed between heights (Figure 4A-E), and the device was more precise and accurate when held 200 cm from the ground (Figure 5A-H). This occurred because the correlation between the measured and estimated heights was higher than the correlation between the estimated height and forage accumulation (0.86 vs 0.71). Even when all data were considered, the adjustment was not better when the device was used (R2 = 0.51 %, CV = 19.42 %).
It is important to highlight that in this adjustment, an estimated rather than measured independent variable was used, and inherent errors in the estimated variable were added when the adjustment for forage accumulation was applied. This fact did not occur with the measured canopy height by the stick method, which, in principle, is the device more suitable for simulating canopy height than forage accumulation.
As in Figure 4E, the regression intercepted the 1:1 line at 22 cm canopy height, the point of greatest accuracy and precision, a value close to 25 cm canopy height considered as a target to start with rotational stocking grazing on ‘Tifton 85’ Bermudagrass (Pedreira et al., 2018), as well as other Bermudagrass cultivars ranging from 25 to 30 cm in height (Silva et al., 2015). However, for stocking to remain more lenient, the canopy height for ‘Callie’ Bermudagrass (C. dactylon var. aridus Harlan et de Wet) should be 20 cm (Pedreira et al., 2018), indicating that the ultrasound device can be used to estimate canopy height with a high level of accuracy and precision exactly at the best time to start grazing.
For the parameterization of the ultrasound device, the distance from the ground proved to be an important factor, warranting further investigation. Future improvements may include developing an output exclusion method to eliminate ground-level readings, which could enhance the precision and accuracy of this alternative method, though it would requires additional programming and algorithm development. Moreover, since the present data were collected during a single growing season, further studies encompassing different seasons and environmental conditions are needed to validate and expand the applicability of this method.
Data availability statement
The author does not have permission to share data.
Acknowledgments
This study was financed in part by the Coordenação de Aperfeiçoamento de Pessoal de Nível Superior (CAPES) - Finance Code 001.
References
-
Andrade AS, Santos PM, Pezzopane JRM, Araujo LC, Pedreira BC, Pedreira CGS, et al. 2016. Simulating tropical forage growth and biomass accumulation: an overview of model development and application. Grass and Forage Science 71: 54-65. https://doi.org/10.1111/gfs.12177
» https://doi.org/10.1111/gfs.12177 - Cantarella H, Quaggio JA, Mattos Jr D, Boaretto RM, van Raij B. 2022. Boletim 100: Recomendações de Adubação e Calagem para o Estado de São Paulo. Instituto Agronômico, Campinas, SP, Brazil (in Portuguese).
- Faculdade de Engenharia de Ilha Solteira [FEIS]. 2025. Área de Irrigação e Hidráulica: Dados Climáticos, Histórico Anual. FEIS, Ilha Solteira, SP, Brazil (in Portuguese).
- Food and Agriculture Organization of the United Nations [FAO] 2006. World reference base for soil resources. FAO, Rome, Italy.
-
Food and Agriculture Organization [FAO]. 2018. Global Forum for Food and Agriculture. FAO, Rome, Italy. Available at: https://www.fao.org/3/I8384EN/i8384en.pdf [Accessed July 29, 2025]
» https://www.fao.org/3/I8384EN/i8384en.pdf -
Food and Agriculture Organization [FAO]. 2024. Land statistics 2001-2022 - Global, regional and country trends. FAO, Rome, Italy. Available at: https://doi.org/10.4060/cd1484en [Accessed Oct 15, 2025]
» https://doi.org/10.4060/cd1484en -
Fricke T, Richter F, Wachendorf M. 2011. Assessment of forage mass from grassland swads by height measurement using an ultrasonic sensor. Computers and Electronics in Agriculture 79: 142-152. https://doi.org/10.1016/j.compag.2011.09.005
» https://doi.org/10.1016/j.compag.2011.09.005 -
Gonzalez MA, Hussey MA, Conrad BE. 1990. Plant Heigh, Disk, and Capacitance Meters Used to Estimate Bermudagrass Herbage Mass. Agronomy Journal 82: 861-864. https://doi.org/10.2134/agronj1990.00021962008200050002x
» https://doi.org/10.2134/agronj1990.00021962008200050002x -
Hutchings NJ, Phillips AH, Dobson RC. 1990. An ultrasonic rangefinder for measuring the undisturbed surface height of continuously grazed grass swards. Grass and Forage Science 45: 119-127. https://doi.org/10.1111/j.1365-2494.1990.tb02192.x
» https://doi.org/10.1111/j.1365-2494.1990.tb02192.x - Lantinga EA, Neuteboom JH, Meijs JAC. 2004. Sward methods. p.23-52. In: Penning PD. ed. Herbage intake handbook. British Grassland Society, Dunston, UK.
-
Moterle PH, Rocha MG, Pötter L, Sichonany MJO, Amaral Neto LGA, Silva MF, et al. 2017. Displacement patterns of beef heifers receiving supplement in Italian ryegrass pasture. Arquivo Brasileiro de Medicina Veterinária e Zootecnia 69: 1021-1029 (in Portuguese, with abstract in English). https://doi.org/10.1590/1678-4162-9258
» https://doi.org/10.1590/1678-4162-9258 -
Pedreira CGS, Silva VJ, Guimarães MS, Pequeno DNL, Tonato F. 2018. Fixed versus variable rest period effects on herbage accumulation and canopy structure of grazed 'Tifton 85' and 'Jiggs' Bermudagrass. Pesquisa Agropecuária Brasileira 53: 113-120. https://doi.org/10.1590/S0100-204X2018000100013
» https://doi.org/10.1590/S0100-204X2018000100013 -
Rodrigues CS, Silveira MCT, Barbero LM, Sousa Júnior SJ, Limão VA, Silva GP, et al. 2024. Dynamics of Mulatto grass regrowth depending on rotational cattle grazing management. Grasses 3: 174-189. https://doi.org/10.3390/grasses3030013
» https://doi.org/10.3390/grasses3030013 -
Silva SC, Cunha WF. 2003. Indirect methods for estimating herbage mass in Cynodon spp. swards. Pesquisa Agropecuária Brasileira 38: 981-989 (in Portuguese, with abstract in English). https://doi.org/10.1590/S0100-204X2003000800011
» https://doi.org/10.1590/S0100-204X2003000800011 -
Silva VJ, Pedreira CGS, Sollenberger LE, Carvalho MSS, Tonato F, Basto DC. 2015. Seasonal herbage accumulation and nutritive value of irrigated 'Tifton 85', Jiggs, and Vaquero Bermudagrasses in response to harvest frequency. Crop Science 55: 2886-2894. https://doi.org/10.2135/cropsci2015.04.0225
» https://doi.org/10.2135/cropsci2015.04.0225 - Thomson NA. 1986. Techniques available for assessing pasture. Dairy Farming Annual 38: 113-121.
- 't Mannetje L. 2000. Measuring biomass of grassland vegetation. p. 151-177. In: 't Mannetje L, Jones RM. eds. Field and laboratory methods for grassland and animal production research. CABI, Wallingford, UK.
Edited by
-
Edited by:
Vinícius Nunes de Gouvêa https://orcid.org/0000-0002-8317-4908