ABSTRACT:
The selection of wheat genotypes according to their drought tolerance is essential to off-season cultivation. The objective of this work was to characterize wheat genotypes through yield and components, morphological characteristics under water stress, and irrigated water use efficiency in the Cerrado region in Brazil. Genotypes were planted during the winters of 2016 and 2017 since there is no precipitation during this season and water levels can be measured. They were then submitted to four water regimes: WR1, WR2, WR3, and WR4, representing 100 %, 83 %, 50 %, and 30 % of evapotranspiration replacement. The following variables were evaluated: peduncle length (PL), number of ears m−2 (NE m−2), hectoliter weight (HW), thousand grain weight (TGW), drought resistance index (DRI), irrigated water use efficiency (IWUE) and yield. Most variables showed correlation with yield and can be a useful tool for breeding programs. PL and HW were best correlated with yield. BRS 264 (irrigated biotype) was productive in treatments receiving the greatest number of irrigation treatments. Given that WR1 registered the highest water level, it was not expected that the rainfed biotype (BR18) would show a higher yield than an irrigated biotype (BRS254). BRS404 (rainfed biotype) was the most productive under moderate stress treatment (WR3). Aliança (rainfed biotype) showed a higher yield under severe stress. Rainfed biotypes presented a higher DRI than the irrigated ones. These genotypes can be used as a reference in breeding programs under each water regime in which their performance was outstanding. None of the variables studied contributed to the selection of the most efficient wheat genotypes in the IWUE.
Keywords:
Triticum aestivum; plant phenotyping; water regimes; irrigation gradient
Introduction
In Brazil, wheat is cultivated mainly in the southern region, and represents 91 % of national production (CONAB, 2017Companhia Nacional de Abastecimento [CONAB]. 2017. The Wheat Crop = A Cultura do Trigo CONAB, Brasília, DF, Brazil 2017 (in Portuguese).). This scenario has marked consequences for the stabilization of wheat production since climate instability has exposed the high vulnerability of the supply of wheat directed to domestic consumption in Brazil. Therefore, to increase production in Brazil and ensure the self-sufficiency of wheat, it is essential to seek out potentially appropriate agricultural regions (Ribeiro et al., 2012Ribeiro, G.; Pimente, A.J.B.; Souza, M.A.; Rocha, J.R.A.S.C.; Fonseca, W.B. 2012. Stress for high temperatures in wheat: impact on development and mechanisms of tolerance. Revista Brasileira de Agrociência 18: 133-142 (in Portuguese, with abstract in English).).
In the Brazilian Cerrado biome, wheat is cultivated in two seasons: (1) in winter under irrigation and (2) in summer under rainfed conditions. In winter, under conditions of irrigation plants should have water use efficiency (WUE). In contrast, cultivation during summer at the end of the rainy season results in wheat being sown during the off-season, and the main limitation is the dry spells, which require drought tolerant (DT) plants.
Water stress alters plant physiology and morphology, according to intensity and time of exposure (Fahad et al., 2017Fahad, S.; Bajwa, A.A.; Nazir, U.; Anjum, S.A.; Farooq, A.; Zohaib, A.; Sadia, S.; Nasim, W.; Adkins, S.; Saud, S.; Ihsan, M.Z.; Alharby, H.; Wu, C.; Wang, D.; Huang, J. 2017. Crop production under drought and heat stress: plant responses and management options. Frontiers in Plant Science 8: 1-16.). Furthermore, the pre-flowering, flowering, and grain filling stages are the most sensitive, and yield can decrease by up to 50 % (Majid et al., 2007Majid, S.A.; Asghar, R.; Murtaza, G. 2007. Yield stability analysis conferring adaptation of wheat to pre-and post-anthesis drought conditions. Pakistan Journal of Botany 39:1623-1637.). Specifically, during the off-season when there are dry spells and a progressive decrease in precipitation it is essential to obtain genotypes with DT. Thus, it is necessary to identify genotypes which can adapt to water stress and maintain productivity (Munns et al., 2010Munns, R.; James, R.A.; Sirault, X.R.; Furbank, R.T.; Jones, H.G. 2010. New phenotyping methods for screening wheat and barley for beneficial responses to water deficit. Journal of Experimental Botany 61: 3499–3507.).
Drought-tolerant wheat genotypes should preferably be selected under field conditions at the pre-breeding stage (Avramova et al., 2016Avramova, V.; Nagel, K.A.; Abdelgavad, H.; Bustoa, D.; Duplessis, M.; Fiorani, F.E.; Beemster, G.T.S. 2016. Screening for drought tolerance of maize hybrids by multi-scale analysis of root and shoot traits at the seedling stage. Journal of Experimental Botany 67: 2453–2466.). Reliable phenotyping protocols for drought tolerance under field conditions are described by Jayme-Oliveira et al. (2017)Jayme-Oliveira, A.; Ribeiro Junior, W.Q.; Ramos, M.L.G.; Ziviani, A.C.; Jakelaitis, A. 2017. Amaranth, C. quinoa and millet growth and development under different water regimes in the Brazilian Cerrado. Pesquisa Agropecuária Brasileira 52: 561-571. resulting in improved selection results. Furthermore, a correlation analysis linked to important parameters is a useful and conclusive analysis for identifying selection criteria and developing better cultivars. Phenotypic correlations within cultivars are valuable indicators of the degree to which various traits are associated with crop productivity (Waitt and Levin, 1998Waitt, D.E.; Levin, D.A. 1998. Genetic and phenotypic correlations in plants: a botanical test of Cheverud's conjecture. Heredity 80: 310–319.). Morphological traits, with easy measurements correlated with yield, could also make genotype selection more efficient.
The objective of this study was to characterize wheat genotypes through their yield and components, and morphological characteristics at a series of water levels, as well as irrigated water use efficiency (IWUE) under field conditions in the Cerrado region.
Materials and Methods
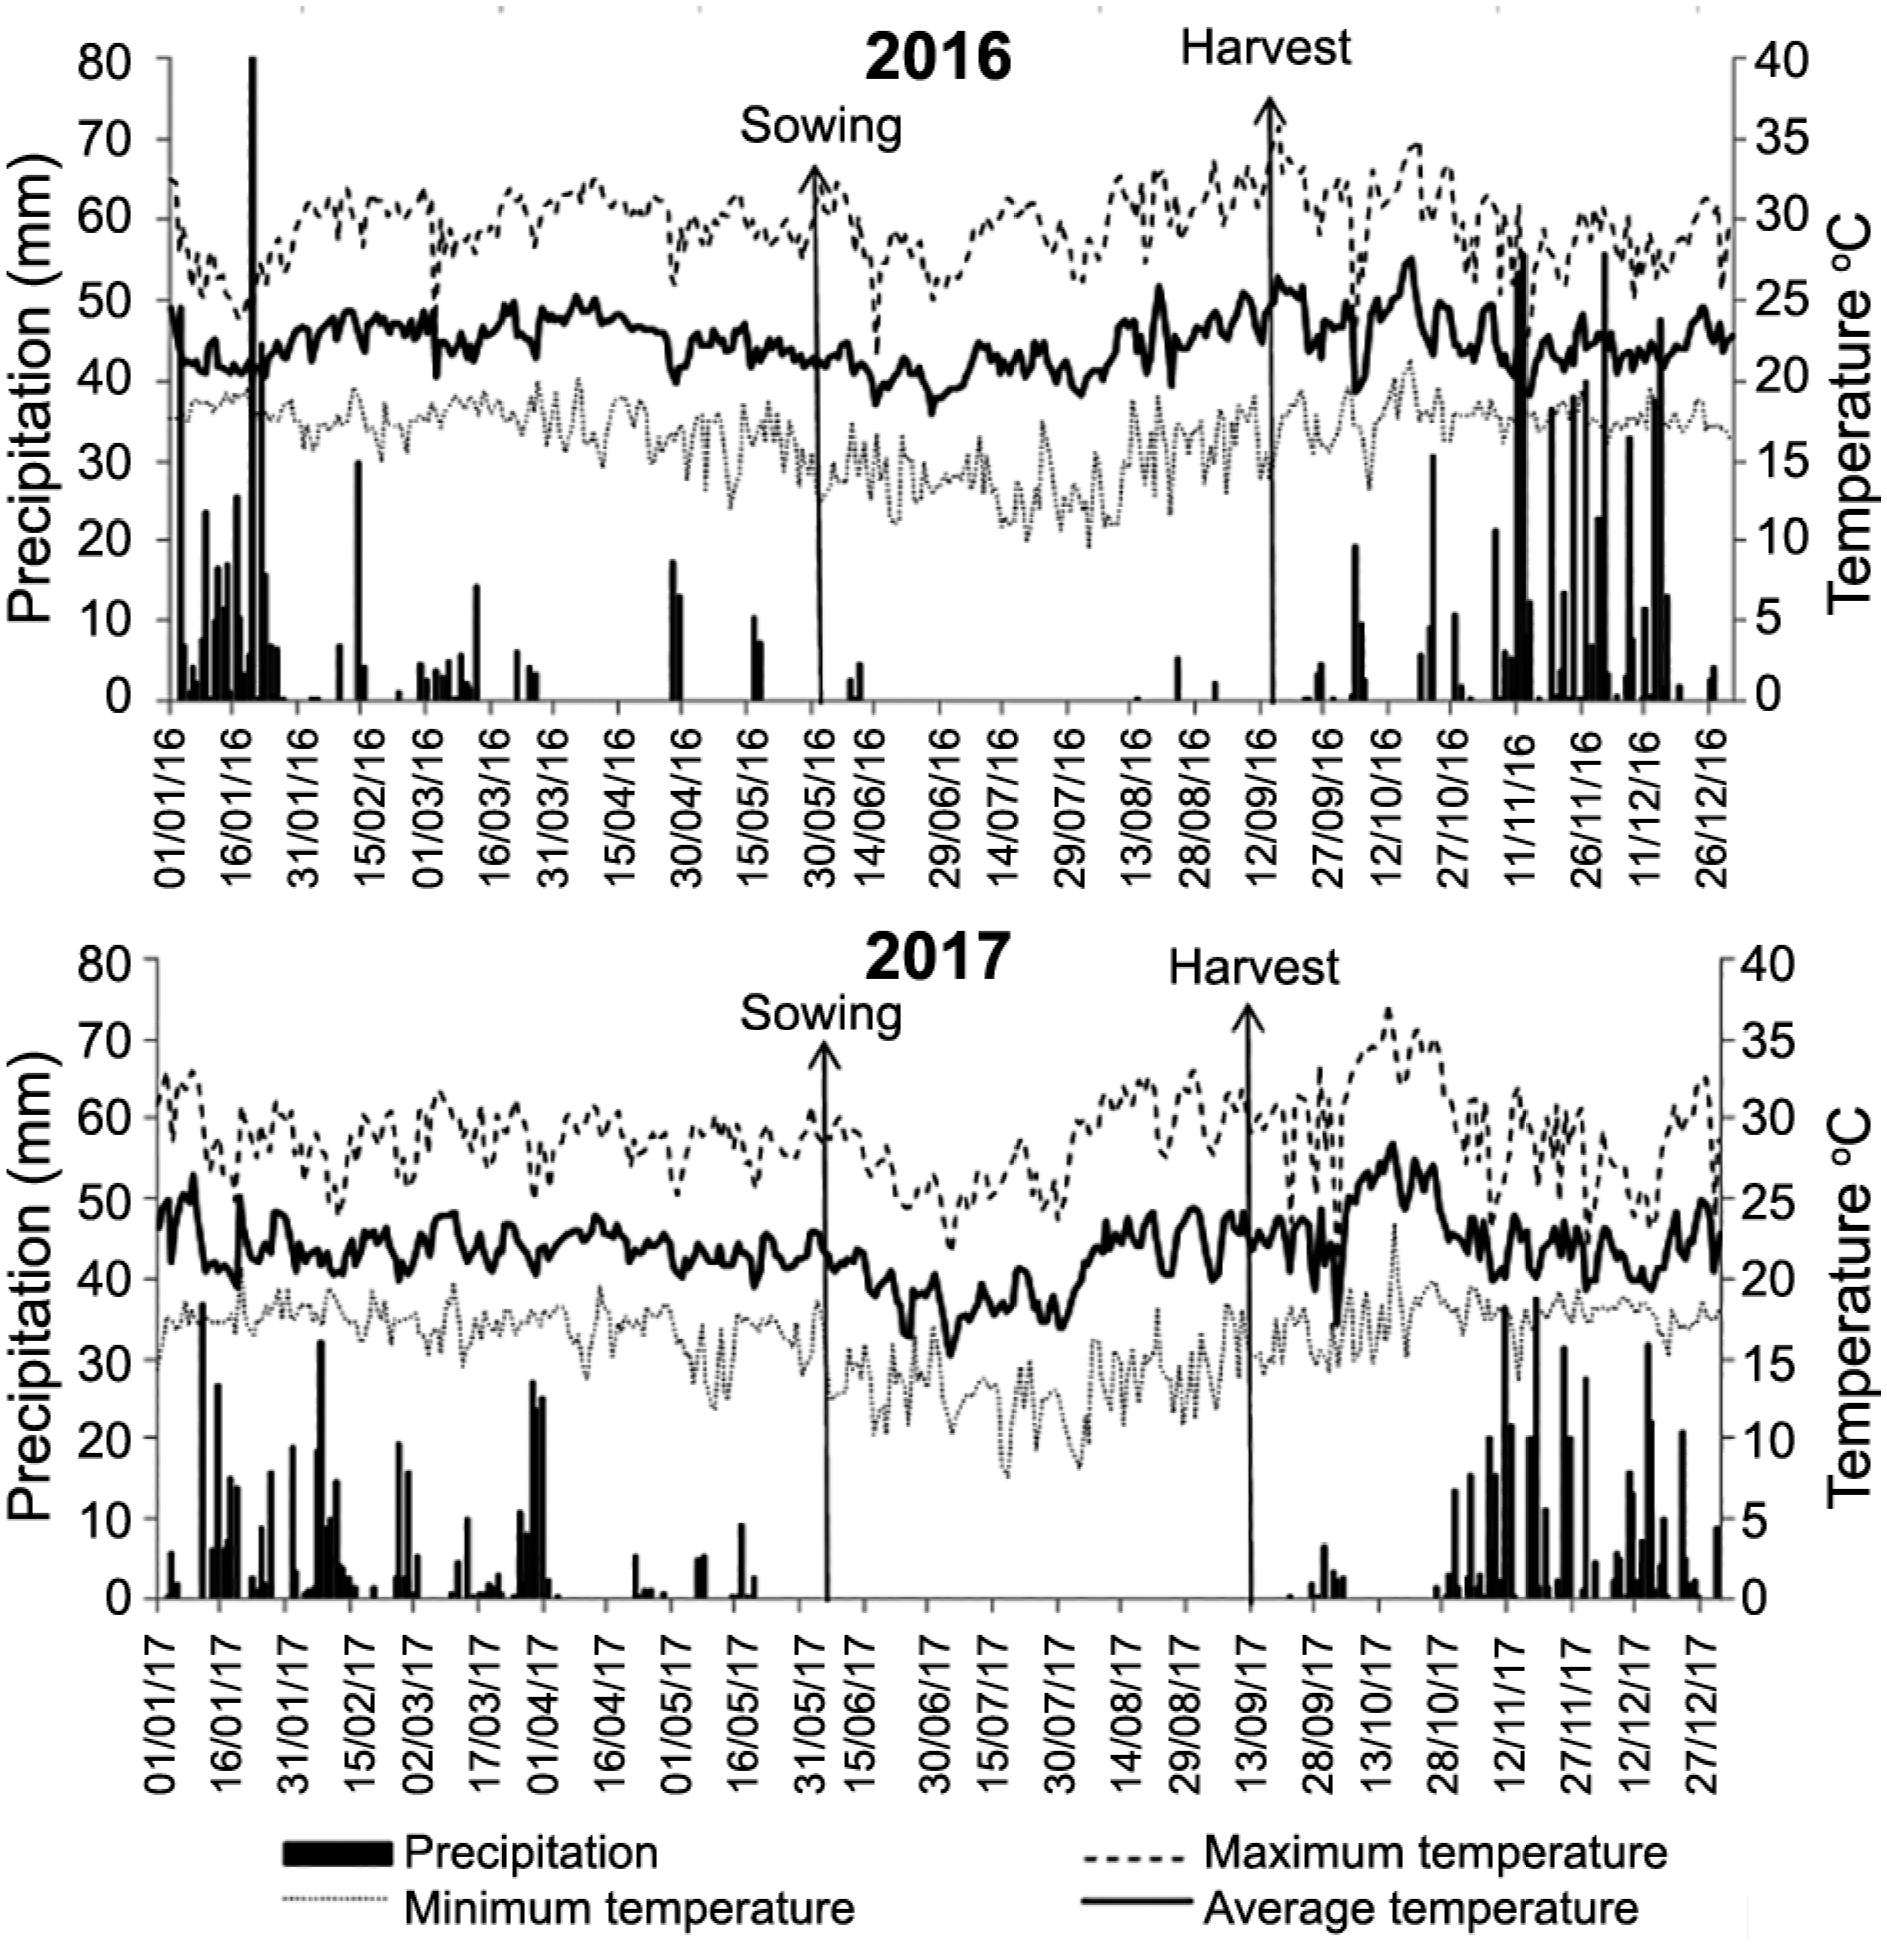
The experiment was conducted from June to Sept 2016 and 2017 under the no-tillage system in Planaltina, DF, Brazil (15°35’30” S, 47°42’30” W, altitude of 1000 m). The prevailing climate in the region is the Aw-type, according to the Köppen classification (Alvares et al., 2013Alvares, C.A; Stape, J.L.; Sentelhas, P.C.; Gonçalves, J.L.M.; Sparovek, G. 2013. Köppen's climate classification map for Brazil. Meteorologische Zeitschrift 22: 711–728.), typical of savannas with two well-defined seasons: dry and cold (autumn and winter), and hot and humid (spring and summer). The climatic data for the two years of wheat cultivation studied are shown in Figure 1.
Rainfall (mm), maximum, minimum and average temperature (°C) in the experimental area for the 2 years of cultivation, 2016 and 2017.
The soil is classified as typical Oxisol, with a clay texture (Soil Survey Staff, 2010), and this experimental area was planted with wheat for 10 years with the same cultivars selected for this study. The soil chemical characterization in the 0-20 cm layer, sampled before the experiment installation, was as follows: pH (H2O) = 6.36; Organic matter = 21.6 g dm−3, P (Melich-1) = 7.23 mg dm−3; K, Ca, Mg, H + Al and CTC: 0.35; 3.01; 1.72; 3.47 and 8.55 cmolc dm−3, respectively.
The experimental design was randomized blocks in a split-plot scheme with four replications. The plots corresponded to ten wheat genotypes (Brillhante, Aliança, BR18, BRS404, PF020037, PF020062, PF080492 (rainfed biotypes) and BRS254, BRS264, CPAC0544 (irrigated biotypes). The subplots corresponded to four water regimes (WR). In 2016, 601 mm, 501 mm, 301 mm, and 184 mm were applied, corresponding to WR1, WR2, WR3, and WR4, respectively. In 2017, 575 mm, 475 mm, 290 mm, and 175 mm were applied corresponding to WR1, WR2, WR3, and WR4, respectively. In 2016 and 2017, the water regimes used were equivalent to 100 %, 83 %, 50 %, and 30 % of crop evapotranspiration replacement.
The rainfed biotype cultivars were Brilhante, Aliança, and BR18 (all traditional materials), and BRS 404 (launched in 2015). Rainfed lines developed for the Cerrado region were PF020037 (presence of great waxing on leaves and culm, according to Ribeiro Junior et al. (2006Ribeiro Júnior, W.Q.; Ramos, M.L.G.; Rebouças, U.V.; Trindade, M. da G.; Ferreira, F.M.; Siqueira, M.M.H.; Silva, H.L.M.; Rodrigues, G.C.; Guerra, A.F; Rocha, O.C.; Amábile, R.F.; Albuquerque, N.C.; Silva, M.S.; Albrecht, J.C.; Durães, F.O.M. 2006. Phenotyping for drought tolerance to improve wheat in the Cerrado = Fenotipagem para tolerância à seca visando o melhoramento do trigo no Cerrado. Circular Técnica Embrapa Trigo 1: 1-20 (in Portuguese).), PF020062 (same cross as the previous genotype but without wax). The rainfed biotype PF080492 was developed for the south of Brazil and suitably adapted to the Cerrado region. Irrigated biotypes were BRS254, BRS264 and CPAC 0544.
Wheat genotypes were sown in early June in 2016 and 2017, with a Semeato traction by tractor sowing plot machine model with eight rows and 0.17 meter spacing and 90 plants per meter. Irrigation was homogeneous for all genotypes until 30 days after emergence in both years of cultivation. At 30 days after plant emergence, 0.5 L ha−1 of trinexapac-ethyl was applied to the experimental area to control lodging. After this initial period of crop establishment, the line source methodology was adapted (Hanks et al., 1976Hanks, R.J.; Keller J.; Rasmussen, V.P.; Wilson, G.D. 1976. Line source sprinkler for continuous variable irrigation crop production studies. Soil Science Society of America Journal 40: 426-429.), modified by the introduction of an irrigation bar 18 m wide on each side. This bar was connected to a winding reel whose speed was adjustable and sprinklers to reduce water flow from the central area to the end of the bar.
The overlap between the different sprinklers promoted a decrease in water gradient from the central area of the bar (considered the ideal water level) to the end of the bar, which allowed a gradient of water to form along the bar. Four plots with different water regimes were selected for morphological measurements and were 3, 7, 11, and 15 meters from the center of the bar to the edge. Each experimental unit represented an area of 1.02 m2.
During the uniform irrigation phase, 134 mm of water was applied in 2016, including rainfall of 7.5 mm. In 2017, during this same period of uniform irrigation, 150 mm of water was applied, and no precipitation was recorded. The applied water levels were calculated according to crop evapotranspiration in each year. The meteorological data from the station located next to the experimental area were used for calculating the applied water.
In 2016 the crop cycle was 105 days and accumulated 601 mm in the first collector, at 3 meters from the beginning of the bar. The other water regimes were at 7, 11 and 15 meters and accumulated 501, 301 and 184 mm, respectively. In 2017 the crop cycle was 98 days and accumulated 575 mm in the first collector, situated 3 meters away from the beginning of the bar, and 475, 290, and 175 mm in the collectors at 7, 11 and 15 meters, respectively.
Irrigation was applied every five days, and the highest water level was based on the irrigation monitoring program in the Cerrado (EMBRAPA, 2011) as a replacement for the wheat crop evapotranspiration. This program considers the agrometeorological data of the Cerrado region, soil type, and the date of the full emergence of plants. For each irrigation, the amount of water applied was calculated through two rows of collectors to measure the volume of water applied.
Both experiments were mechanically harvested in Sept, except in cases where the productivity components had previously been determined which were harvested manually. Evaluations were performed in the useful area of the subplots, each of which was defined as one meter of each water regime in the four central lines of the plot.
The following yield components were determined: peduncle length (PL), number of ears m−2 (NE m−2), hectoliter weight (HW), thousand-grain weight (TGW), and yield. The PL was determined with a measuring tape graduated in centimeters, and ten plants were evaluated randomly in each experimental unit. The NE m−2 was determined by direct counting of the ears harvested from the useful area and then extrapolated to m−2. HW, TGW, and yield were performed based on the Rules for Seed Analysis (MAPA, 2009Ministério da Agricultura, Pecuária e Abastecimento [MAPA]. 2009. Rules for Seed Analysis = Regras para Análise de Sementes. MAPA/ACS, Brasília, DF, Brazil (in Portuguese).). Irrigated water use efficiency (IWUE) was calculated by the ratio between the yield and the amount of water applied during the whole crop cycle and is presented in kg ha−1 mm−1. The drought resistance index was calculated by the formula: , where, Ys and Yn are the genotype yields under stress and non-stress, respectively. Ms and Mn are the mean yields overall genotypes in the given test under stress and non-stress, respectively (Fischer and Maurer, 1978Fischer, R.A; Maurer, R. 1978. Drought resistance in spring wheat cultivars. I. Grain yield responses. Australian Journal of Agricultural Research 29: 897-912.).
Data were submitted to the Shapiro-Wilk test, which confirmed the normality of data for both years and were then subjected to joint analysis of variance in the years 2016 and 2017 at 5 % probability by the F test, and the comparison of means was made by Tukey´s test at 5 % probability. The statistical procedures were conducted using the PROC Mixed procedure in SAS (Statistical Analysis System, version 9.4), and the restricted maximum likelihood (REML) algorithm. Data were also submitted to Pearson's correlation test between all variables, using the individual data of each variable. Principal component analysis was performed using the R software program.
Results and Discussion
All variables studied presented normal residuals according to the Shapiro-Wilk test. The effect of genotypes × years and water regime × years interactions were significant at 0.01 % probability using the F test, indicating different responses of the genotypes and water regimes to environmental conditions, which was expected for quantitative traits. The analysis was performed separately for each year, and all variables showed significant interaction between genotypes and water regimes at 5 % probability (except for NE m−2 in 2016, Figures 2 to 4).
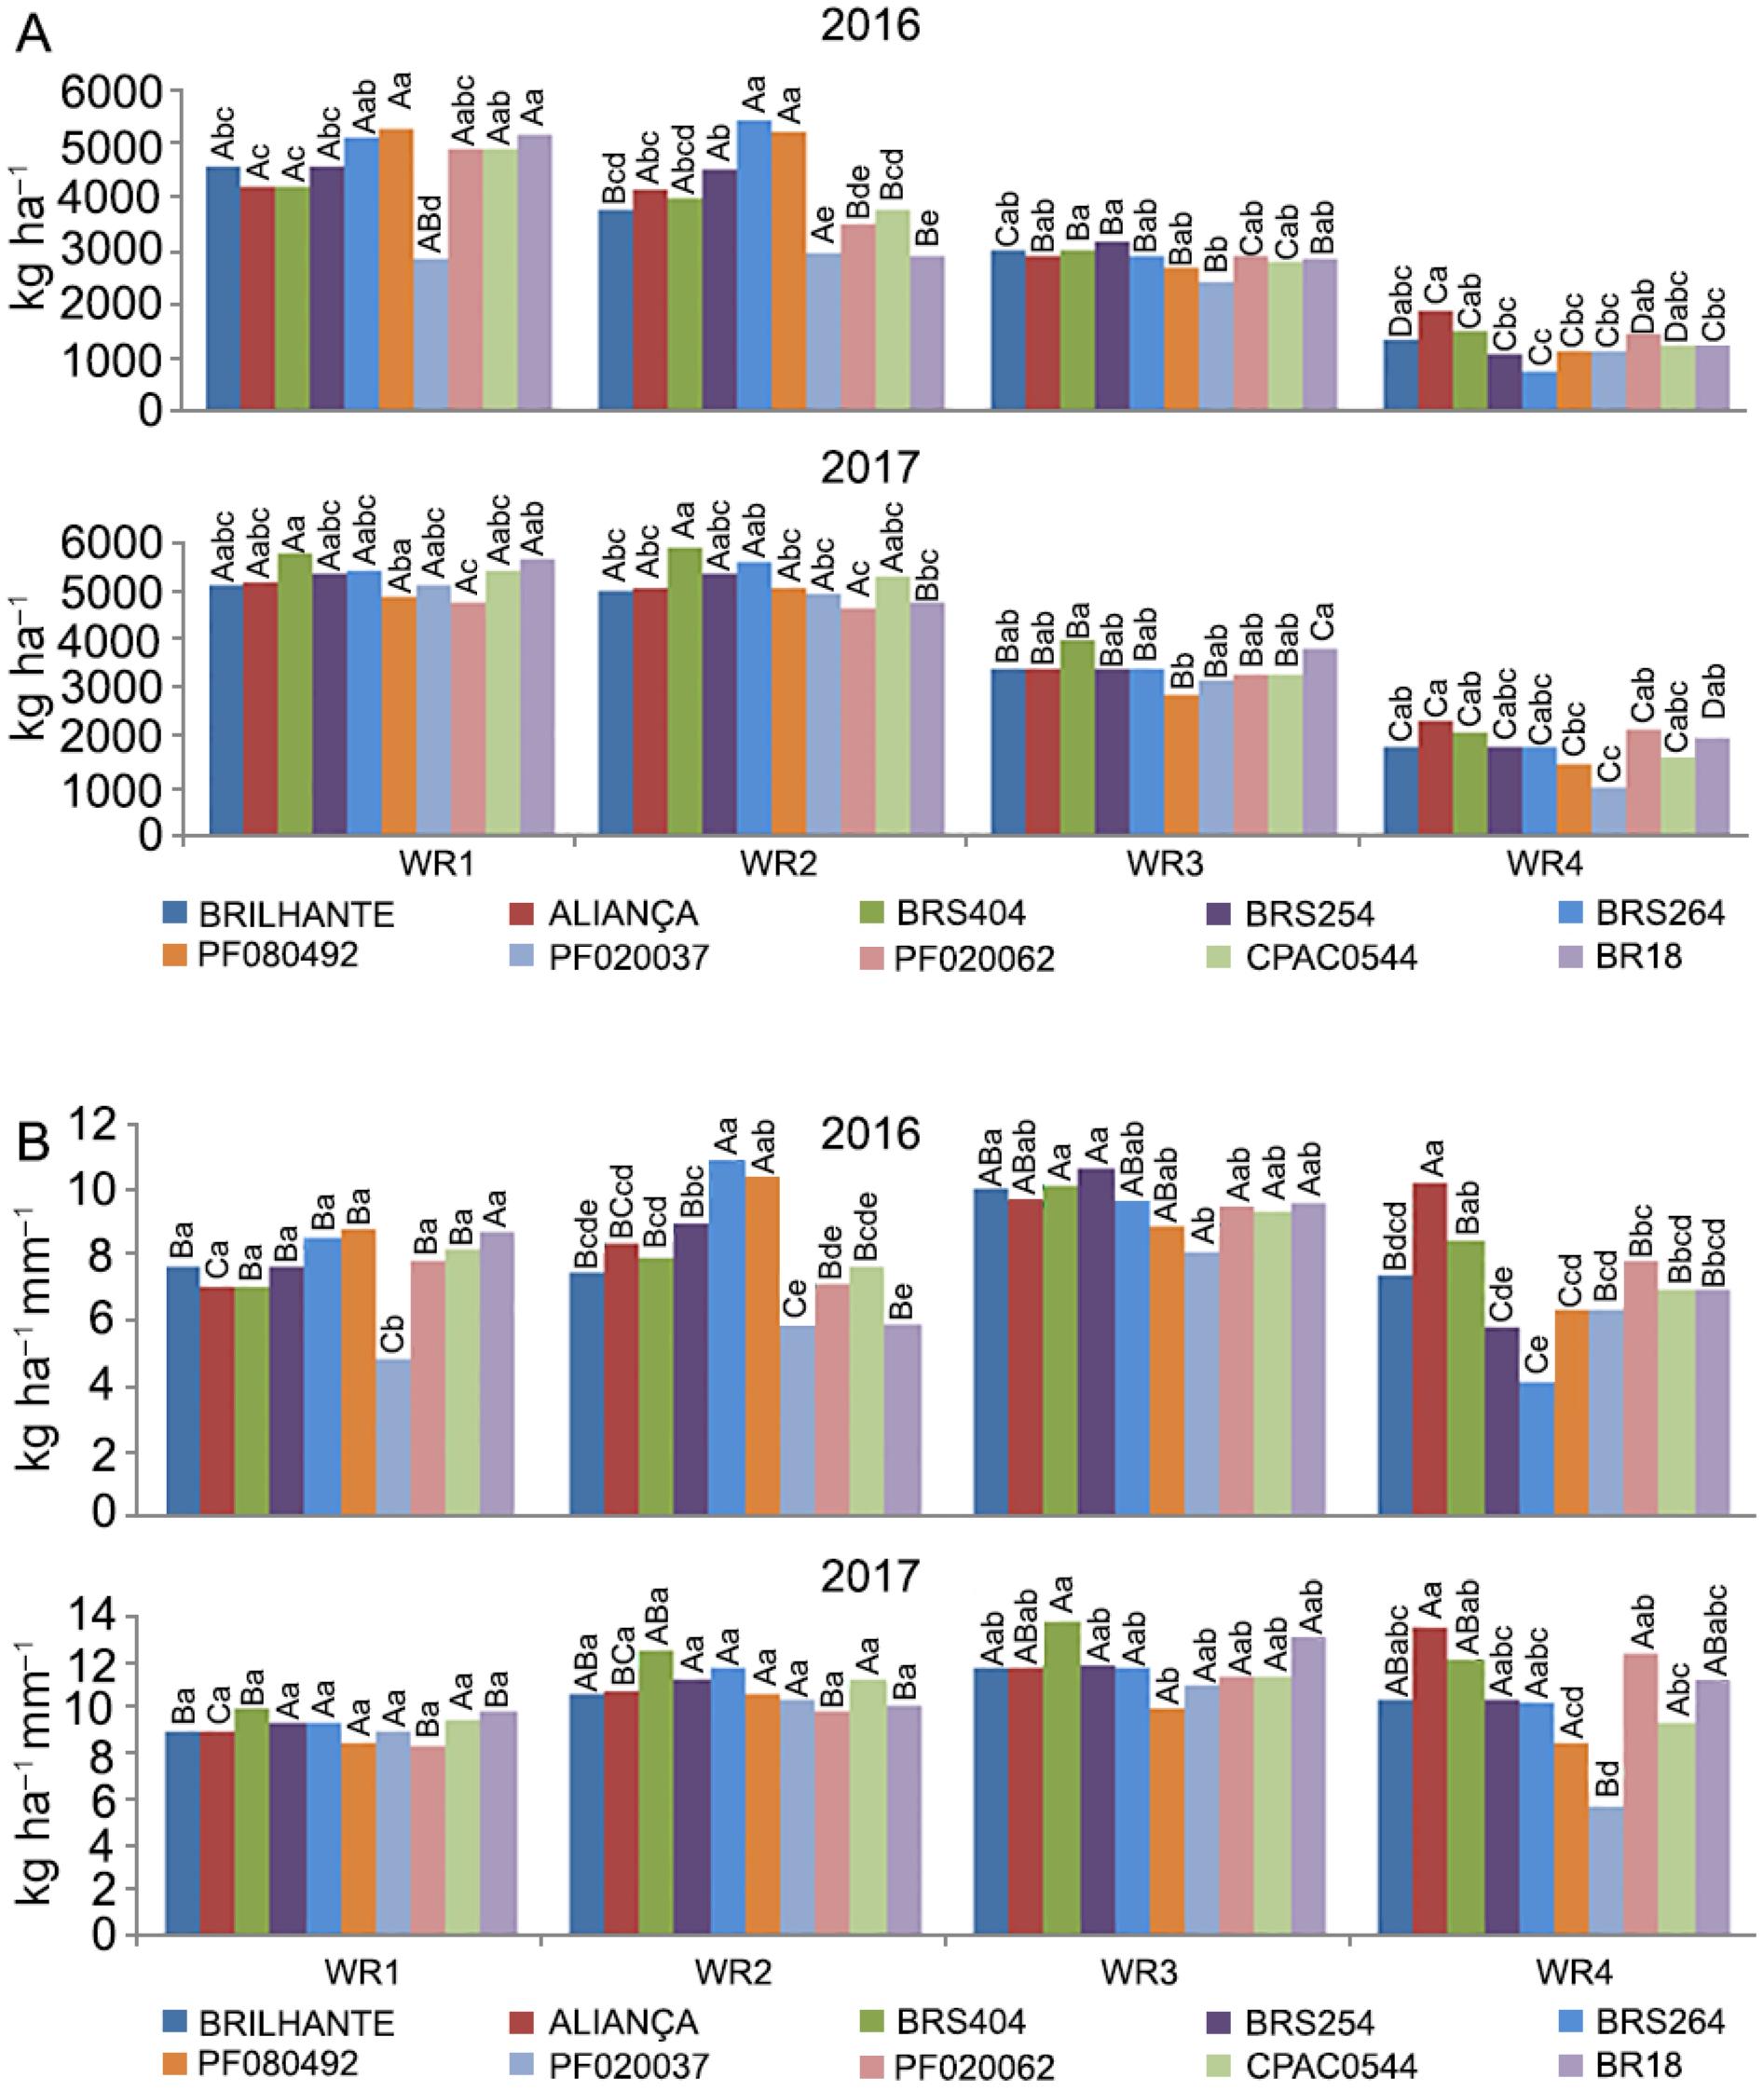
A - Yield (kg ha−1) and B – Irrigated water use efficiency (IWUE, kg ha−1 mm−1) of ten wheat genotypes under four water regimes (WR1, WR2, WR3 and WR4, equivalent to 100 %, 83 %, 50 % and 30 % of crop evapotranspiration replacement). Means followed by the same letters do not differ by Tukey's test (p < 0.05). Uppercase (water regimes within each genotype) and lowercase (genotypes in each water regime).
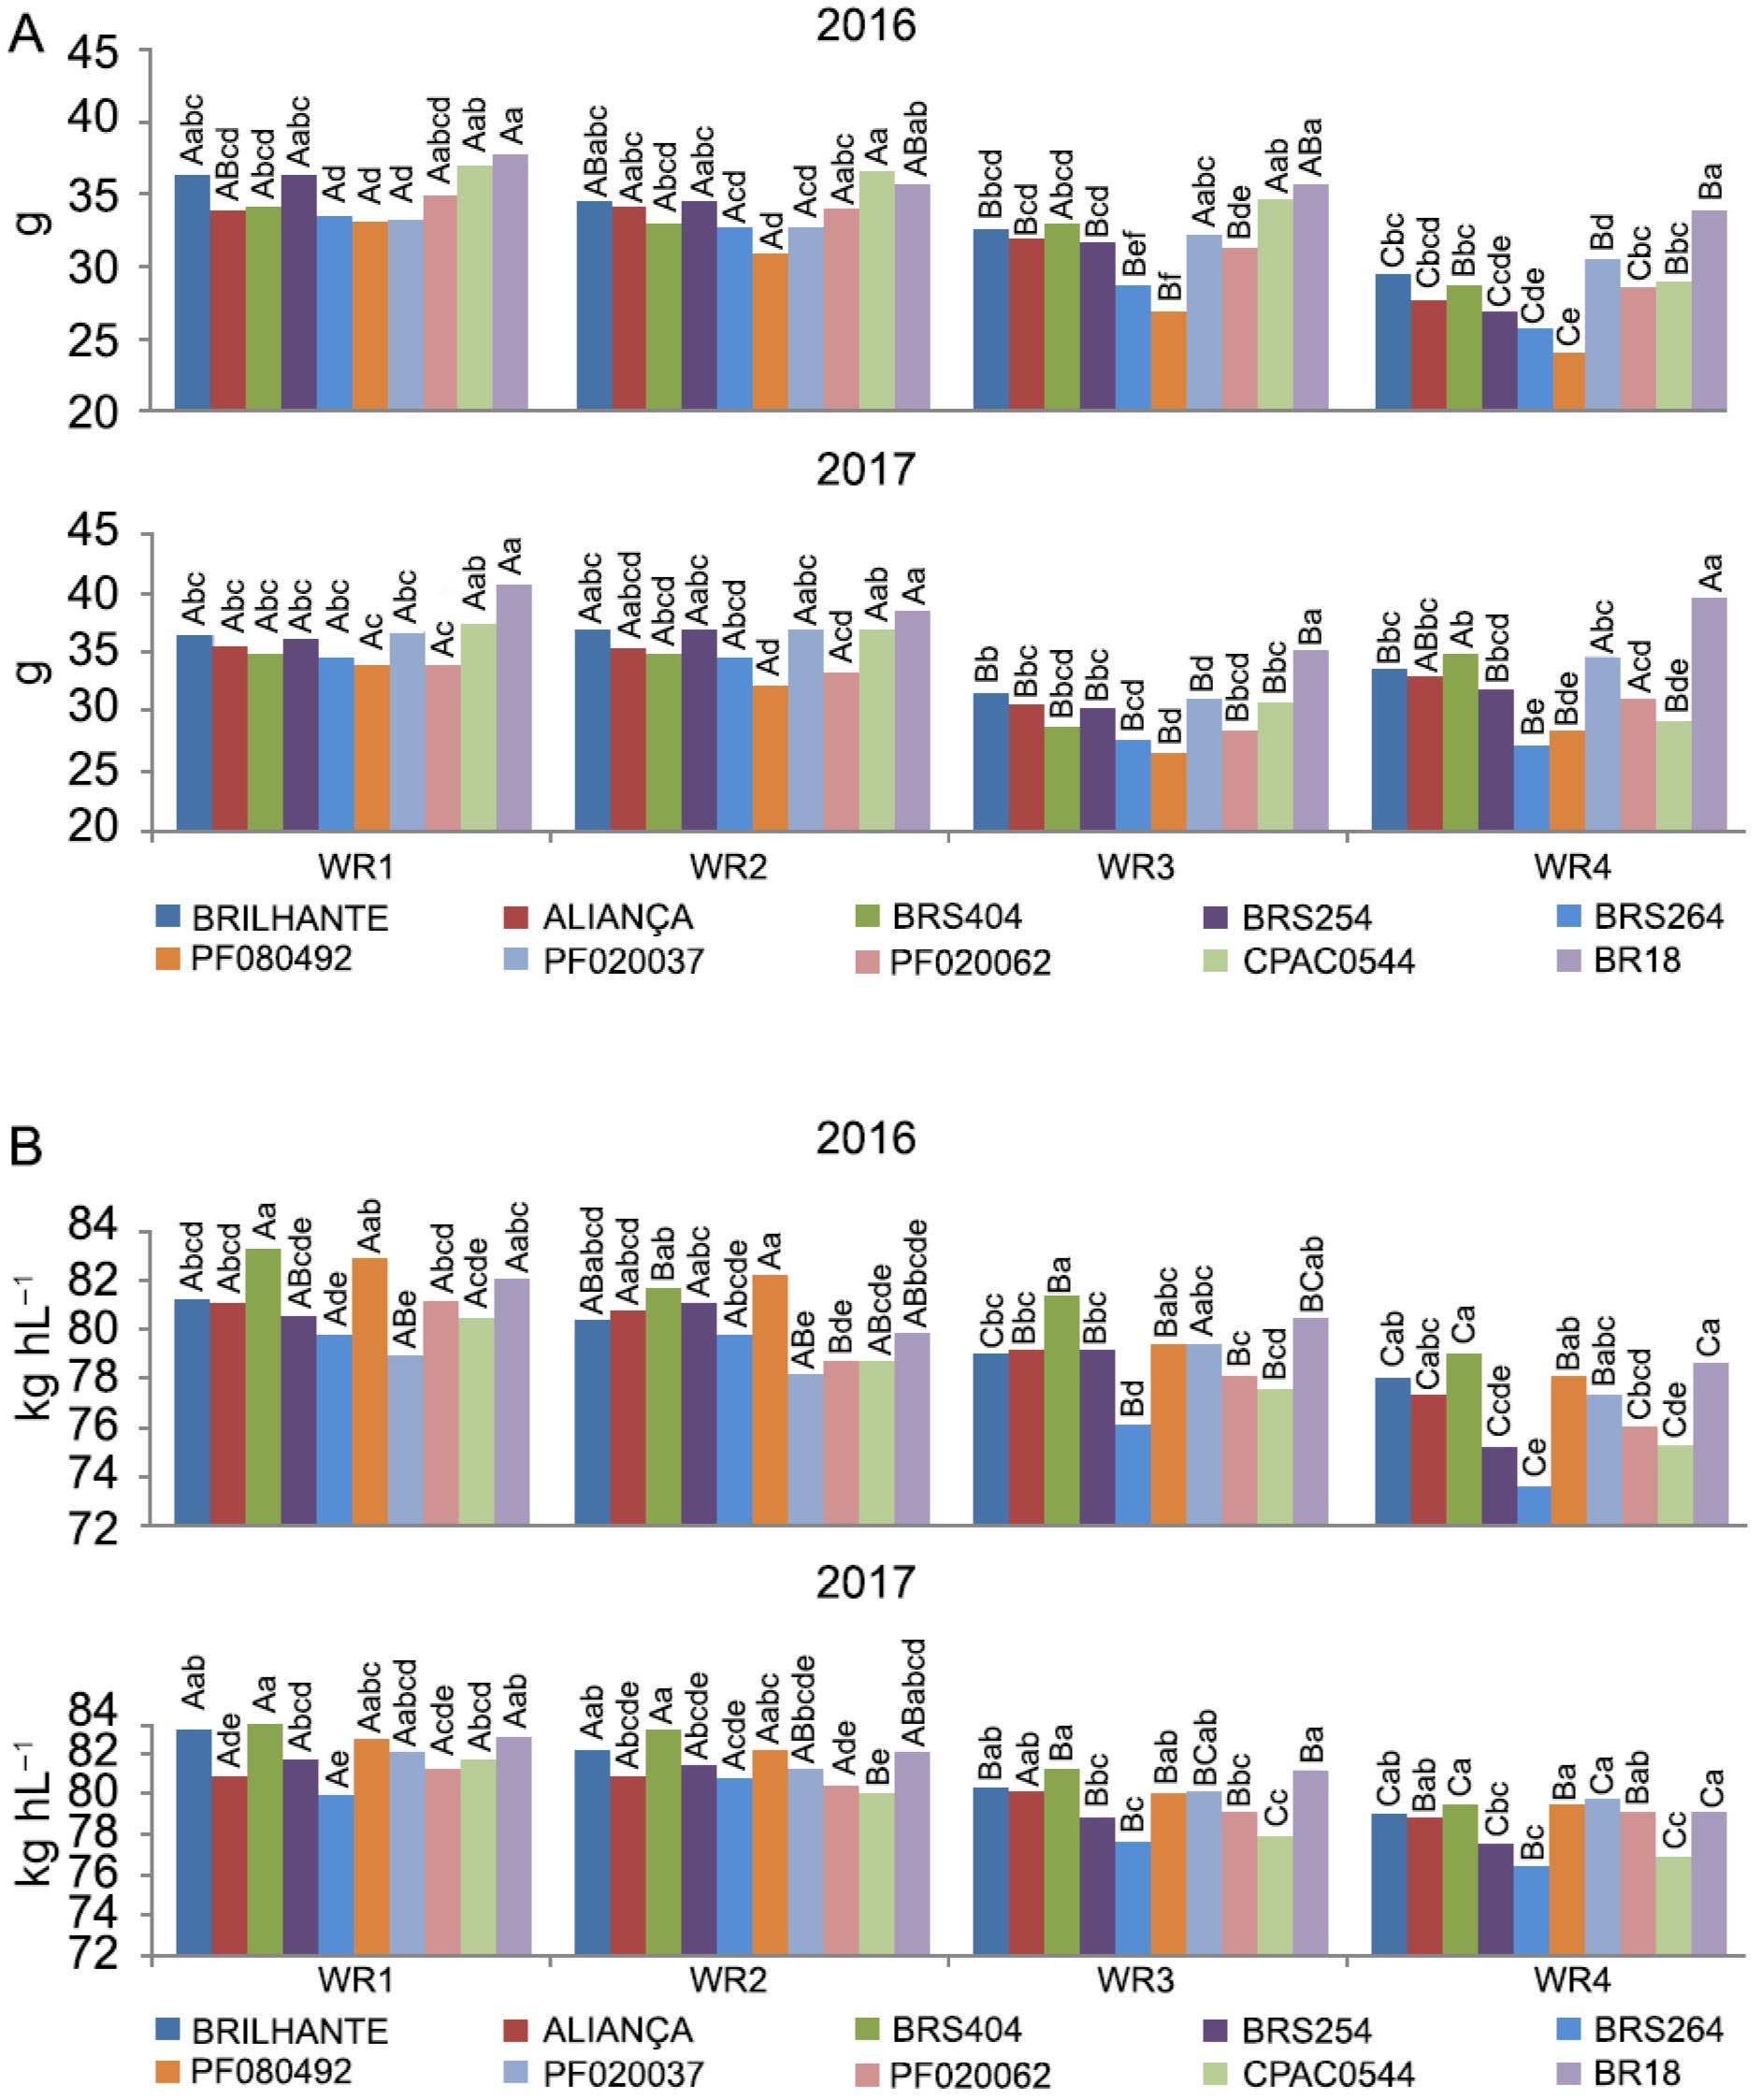
A - Thousand grain weight (g) and B - Hectoliter weight (kg h L−1) of ten wheat genotypes under four water regimes (WR1, WR2, WR3 and WR4, equivalent to 100 %, 83 %, 50 % and 30 % of crop evapotranspiration replacement). Means followed by the same letters do not differ by Tukey's test (p < 0.05). Uppercase (water regimes within each genotype) and lowercase (genotypes in each water regime).
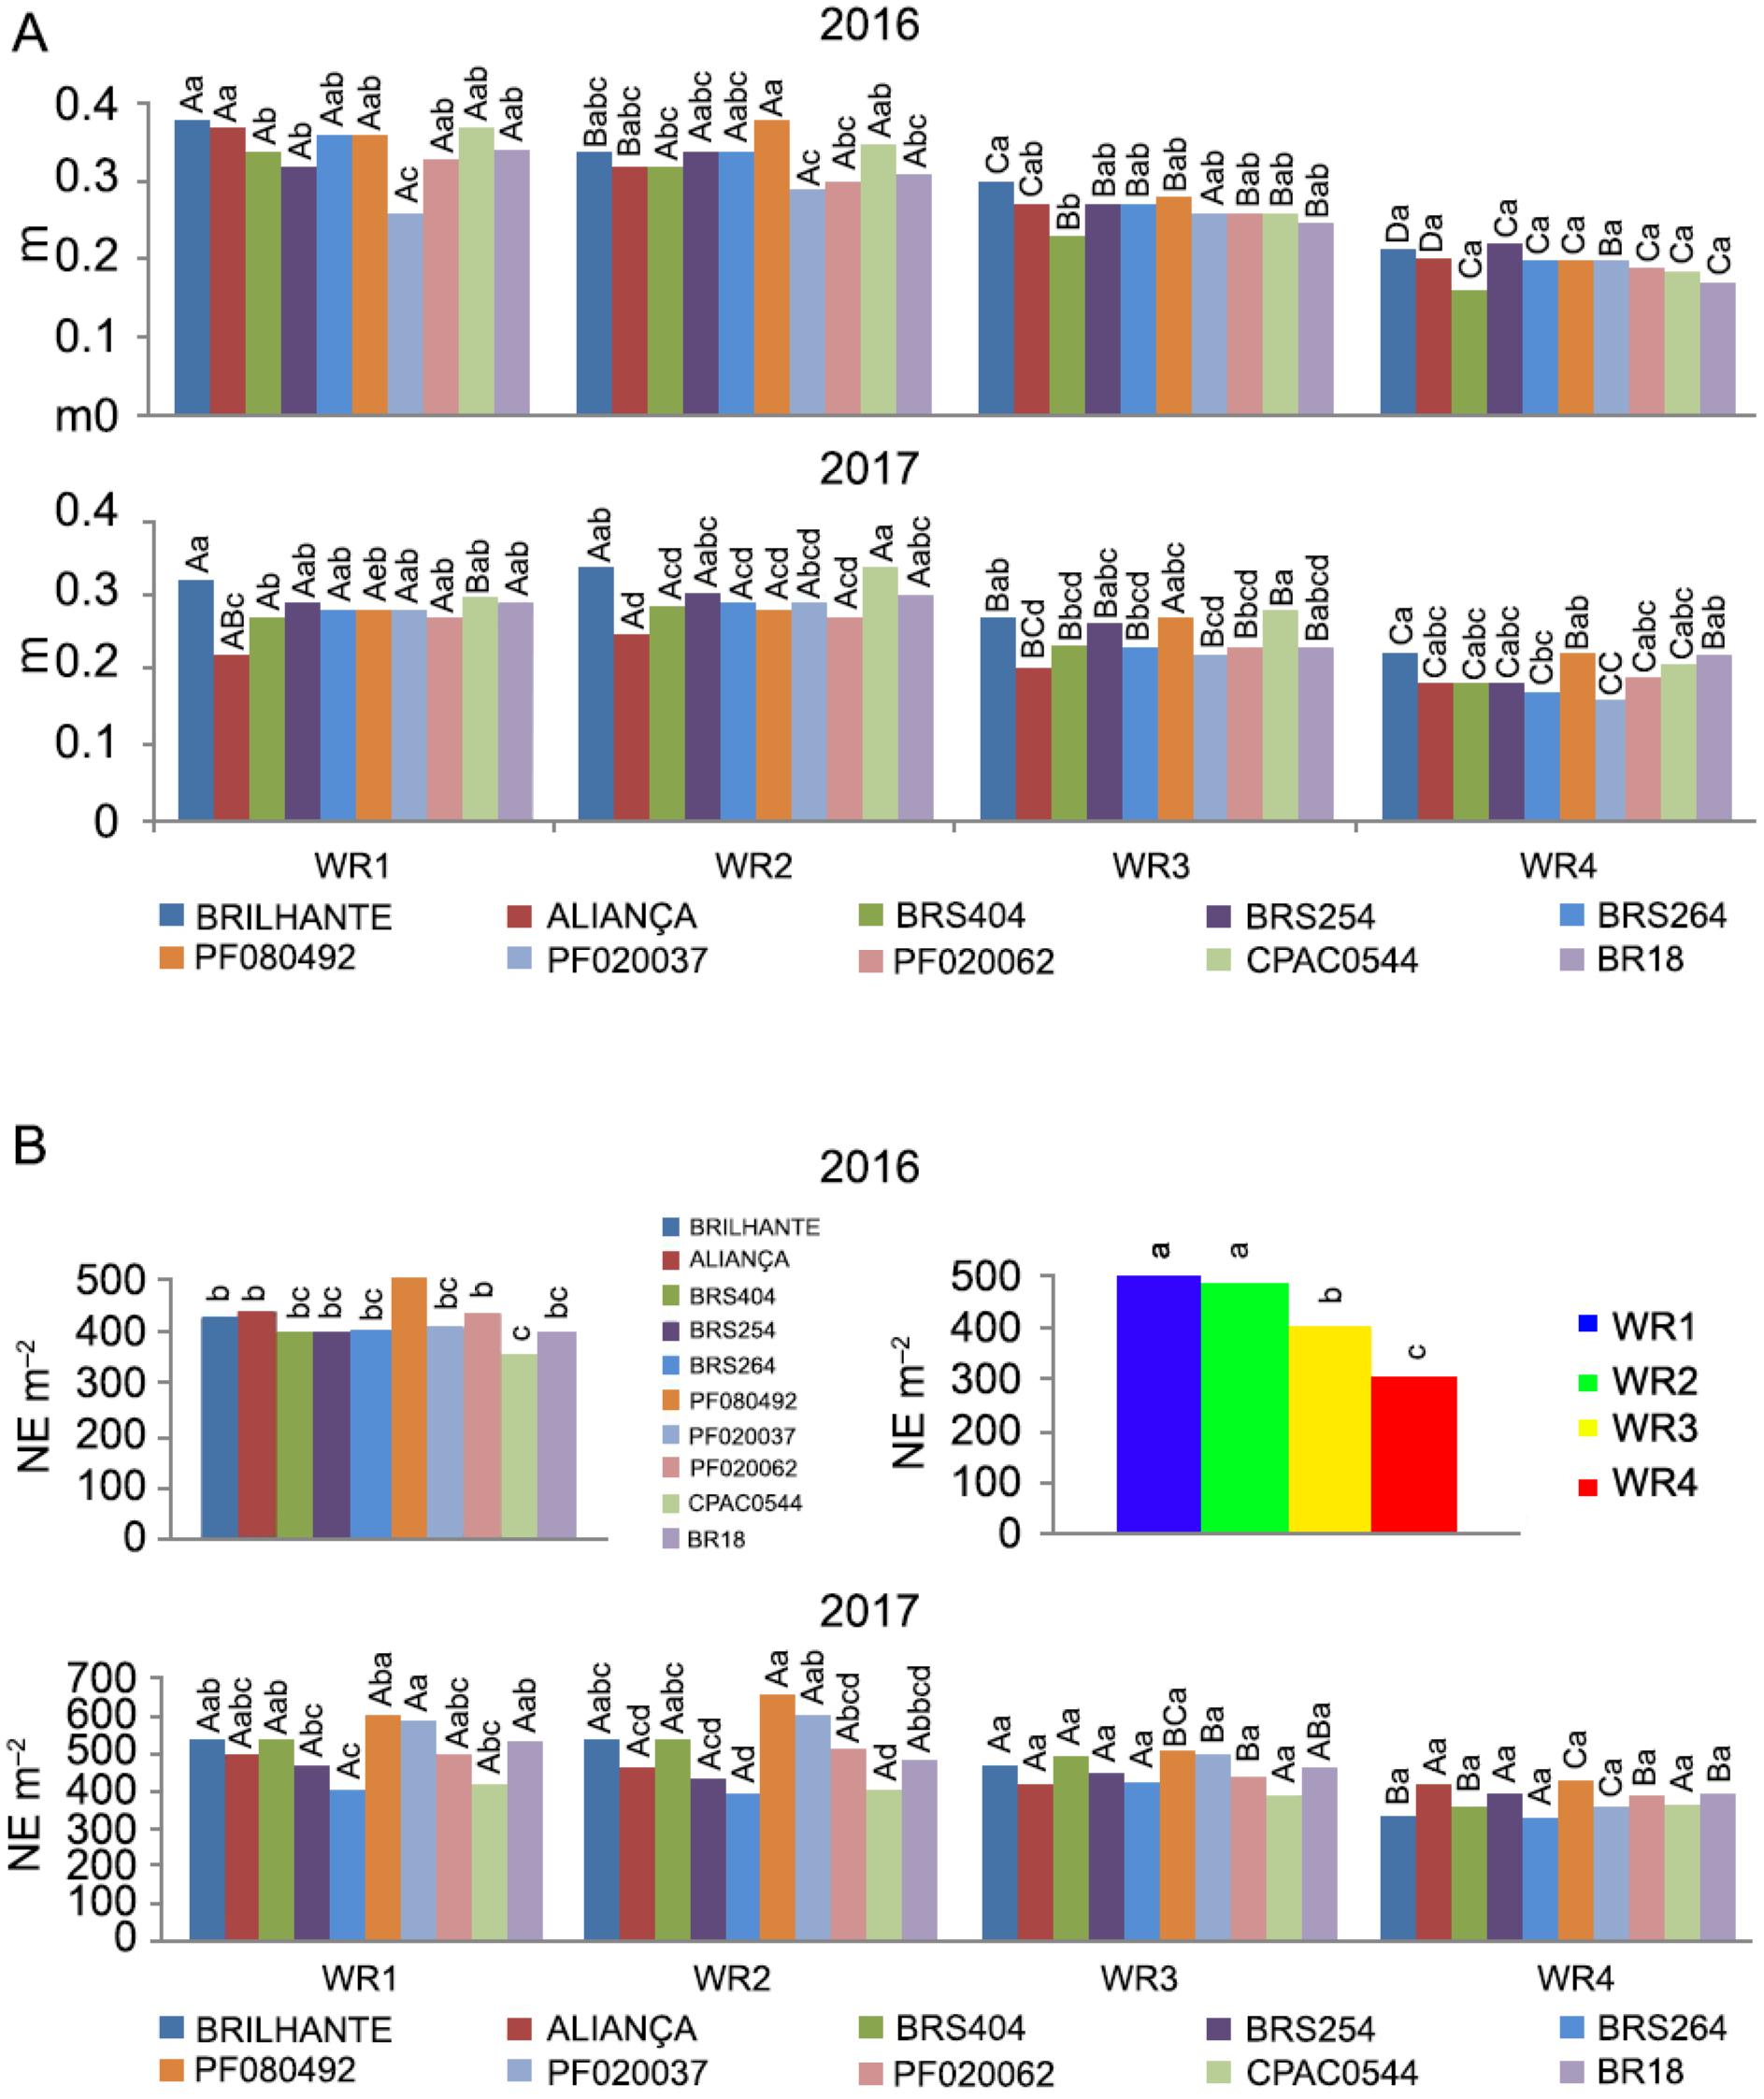
A - Peduncle length (m) and Number of Ears (NE m−2) of ten wheat genotypes under four water regimes (WR1, WR2, WR3 and WR4, equivalent to 100 %, 83 %, 50 % and 30 % of crop evapotranspiration replacement). Means followed by the same letters do not differ by Tukey's test (p < 0.05). Uppercase (water regimes within each genotype) and lowercase (genotypes in each water regime).
Effects of genotypes and water regimes on grain yield and drought resistance index (DRI)
Yield showed an interaction between WR and wheat genotypes, which means genetic variability. Moreover, decreasing yield in low water levels, indicates that water is a limiting factor in the experiment. Wheat genotypes presented different yields, depending on the year (Figure 2A). Thus, the response of wheat genotypes in each water regime was evaluated separately for each year of cultivation.
In the water regime WR1, in 2016, PF080492 (5,302 kg ha−1) and BR18 (5,195 kg ha−1), showed higher yield than Brilhante (4,561 kg ha−1), Aliança (4,227 kg ha−1), BRS404 (4,188 kg ha−1), BRS254 (4579kg ha−1) and PF20037 (2,874kg ha−1) (Figure 2A). From 2008 to 2016 (year of the experiment), the average yield of irrigated wheat was between 5,300 and 6,000 kg ha−1 (CONAB, 2017Companhia Nacional de Abastecimento [CONAB]. 2017. The Wheat Crop = A Cultura do Trigo CONAB, Brasília, DF, Brazil 2017 (in Portuguese).), in the same region where the experiments were performed.
Considering that WR1 was the highest water level, it was not expected that rainfed biotype (such as BR18) would show a higher yield than an irrigated biotype (such as BRS254) despite being selected for their specific region. In this same regime, in 2017, the tendency was different, since PF080492, which had one of the highest yields in the previous year, expressed lower yield (4,855 kg ha−1), together with PF020062 (4,795 kg ha−1). BRS404 obtained a higher yield compared with PF020062 (Figure 2A). This strong performance for BRS404 at a higher water level was also not expected, considering that it is a rainfed biotype.
In the mild stress water regime (WR2), in 2016, PF080492 and BRS264 presented the highest averages (5,192 and 5,432 kg ha−1, respectively), and BR18 and PF20037 showed the lowest yield (2,924 and 2,975 kg ha−1, respectively). In 2017, analysing the outstanding genotypes, the response of genotypes in WR2 was not similar to the one found in WR1, where BRS404 had the highest average yield (5,926 kg ha−1), higher than PF080492 and PF020062 (5,052 and 4,659 kg ha−1). In addition to these two genotypes, BRS404 was also superior to Aliança, Brilhante, PF020037, and BR18 (5,065, 5,030, 4,952, and 4,791 kg ha−1, respectively,) (Figure 2A).
In these two water regimes, WR1 and WR2, there was a tendency for BRS264 to be more productive in 2016. It is worth mentioning that BRS264 is a material developed for irrigated cultivation. The other two water regimes (WR3 and WR4) also produced outstanding genotypes in the two years studied (Figure 2A).
In the moderate water stress regime (WR3), in 2016, with a lower yield than WR1 and WR2, the differences between genotypes were lower. The lowest yield was observed in PF020037 (2,431 kg ha−1) and differed statistically only from BRS254 and BRS404, which had the highest yields (3,180 and 3,048 kg ha−1, respectively). Under this same water regime for the year 2017, it also presented a yield that was lower than WR1 and WR2 and curtailed differences between genotypes. In this treatment, BRS404 (4,003 kg ha−1) and BR18 (3,811 kg ha−1) both showed a yield higher than PF0800492 (2,903 kg ha−1) (Figure 2A). This had been expected because PF0800492 was selected for the south of Brazil and not for the Cerrado region.
Thus, BRS404 (just released into the market) showed its adaptive ability to the conditions of moderate water stress compared to the other genotypes, as it maintained its yield performance over the years under the same condition of water stress. It is worth mentioning that this water regime is the closest to the condition of a second wheat crop cultivation in the Brazilian Cerrado region (off-season). Therefore, the BRS404 proved to be a good option for this region in this growing season.
In WR4, with more severe water stress than the real condition in the off-season period, in 2016, Aliança showed higher yield than BRS254 (1,070 kg ha−1), BRS264 (754 kg ha−1), PF020492 (1,163 kg ha−1), PF020037 (1,156 kg ha−1) and BR18 (1,261 kg ha−1). PF020037 showed less productive potential, despite having a visually high presence of wax in leaves, which could be an advantage under conditions of stress.
In 2017, with this same water regime (WR4), Aliança presented a higher yield (2,351 kg ha−1), the same trend as found in 2016 (Figure 2A). Among these wheat genotypes, Aliança is an ancient and traditional material under rainfed cultivation in the Cerrado and is considered rustic.
These results demonstrate that drought tolerance as a quantitative trait with strong environmental influences is in need of more years of evaluation if more productive materials are to be selected. It was found that environmental conditions were determinant in the yield of wheat genotypes. Different relationships between yield components and grain yield can be attributed to the impact of the environment on plant development (Asseng et al., 2002Asseng, S.; Turnera, N.C.; Rayb, J.D.; Keating, B.A. 2002. A simulation analysis that predicts the influence of physiological traits on the potential yield of wheat. European Journal of Agronomy 17: 123–141.). Kaya and Akcura (2014)Kaya, Y.; Akcura, M. 2014. Effects of genotype and environment on grain yield and quality traits in bread wheat (T. aestivum L.). Food Science and Technology 34: 386-393. found that quantitative traits, such as yield, were more affected by the environment than the qualitative characteristics of wheat genotypes. Grain yield is related to the decreasing and shortening of the duration of photosynthesis during water stress in plants (Liu et al., 2016Liu, E.K.; Mei, X.R.; Yan, C.R.; Gong, D.Z.; Zhang, Y.Q. 2016. Effects of water stress on photosynthetic characteristics, dry matter translocation and WUE in two winter wheat genotypes. Agricultural Water Management 167: 75–85.). Reduced stomatal conductance promotes a reduction in photosynthesis in plants with the initial onset of water stress (Cornic, 2000Cornic, G. 2000. Drought stress inhibits photosynthesis by decreasing stomatal aperture: not by affecting ATP synthesis. Trends in Plant Science 5: 187–188.). Additionally, Ehdaie et al. (2006)Ehdaie, B.; Alloush, G.A.; Madore, M.A.; and Waines, J.G. 2006. Genotypic variation for stem reserves and mobilization in wheat. I. Postanthesis changes in internode dry matter. Crop Science 46: 735–746. found stem reserves to grain yield were 54 % lower in wheat under water stress.
The evaluation of water regimes within each genotype demonstrated that Aliança, BRS254, BRS264, BRS404, PF080492, and PF020037 showed the same response in both years of assessment (Figure 2A). In this group of genotypes, WR1 and WR2 were similar and superior to WR3 and WR4, respectively. For BR18, in 2016, WR2 (2,924 kg ha−1) was lower than WR1 (5,195 kg ha−1).
In 2017, BR18 yield was statistically different in all water regimes, with higher values for WR1. This same tendency was observed for Brilhante, CPAC0544 and PF020062 in 2016, which had the highest average yield for WR1, an decreased when water stress increased. These same genotypes in the year 2017 showed averages of WR1 and WR2 statistically similar and superior to WR3 and WR4, respectively (Figure 2A).
Overall, in assessing water regimes within each genotype, there was a decrease in yield in WR4 (Figure 2A). This response was already expected, as several studies have shown the restriction in wheat yield under water stress. In general, the grain filling stage is considered the most sensitive to water stress (Farooq et al., 2014Farooq, M.; Hussain, M.; Siddique, K.H.M. 2014. Drought stress in wheat during flowering and grain-filling periods. Critical Reviews in Plant Sciences 33: 331-349.), and its effect depends on the duration and the severity of the stress (Fahad et al., 2017Fahad, S.; Bajwa, A.A.; Nazir, U.; Anjum, S.A.; Farooq, A.; Zohaib, A.; Sadia, S.; Nasim, W.; Adkins, S.; Saud, S.; Ihsan, M.Z.; Alharby, H.; Wu, C.; Wang, D.; Huang, J. 2017. Crop production under drought and heat stress: plant responses and management options. Frontiers in Plant Science 8: 1-16.). The impact of water stress on the different phenological phases of wheat was also studied by Majid et al. (2007)Majid, S.A.; Asghar, R.; Murtaza, G. 2007. Yield stability analysis conferring adaptation of wheat to pre-and post-anthesis drought conditions. Pakistan Journal of Botany 39:1623-1637.. These authors found that the pre-flowering, flowering, and grain filling stages were the most sensitive.
Thus, WR3 and WR4, which had the most significant reduction in the amount of water applied, showed impairment in grain yield as a result of lower water availability in the most sensitive periods. Furthermore, under increased water stress (WR4), the reduction in yield was more significant (Figure 2A). This same tendency was observed by Ma et al. (2014)Ma, J.; Huang, G.B.; Yang, D. L.; Chai, Q. 2014. Dry matter remobilization and compensatory effects in various internodes of spring wheat under water stress. Crop Science 54: 331–339., where extreme stress caused more significant yield reduction than moderate water stress. Considering that water was a limiting factor in the protocol of the irrigated system, yield could be regarded as a trait linked to drought tolerance.
There are several drought tolerance indexes for comparing plant genotypes. Khalili et al. (2012)Khalili, M.; Naghavi, R.M.; Aboughadareh, A.P.; Talebzadeh, S.J. 2012. Evaluation of drought stress tolerance based on selection indices in spring canola cultivars (Brassica napus L.). Journal of Agricultural Science 4: 78-85. evaluated several drought resistance indexes (DRI), and found that DRI presented high correlation with other drought stress indexes. DRI can indicate both drought tolerance and high yield, according to Hu et al. (2007)Hu, S.P; Hua, Y.; Zou, G.H.; Liu, H.Y.; Liu, G.L.; Mei, H.; Cai, R.; Li, M.; Luo, L. 2007. Relationship between coleoptile length and drought resistance and their QTL mapping in rice. Rice Science 14: 13-20.. There were differences between wheat genotypes and years of evaluation (Table 1). In a comparison between the two years of evaluation, the DRI was similar for all genotypes, except for BRS264, which presented greater DRI in 2017 (0.97) than in 2016 (0.52), and PF020037, with DRI of 1.42 and 0.56 in 2016 and 2017, respectively. Among wheat genotypes within each year, in general, Aliança and BRS404 showed the highest DRI values, which had been expected because both are rainfed biotypes. BR18, a traditional rainfed biotype, considered rustic, presented low DRI. Irrigated biotypes, in general, showed low DRI, which had been expected considering that the breeding process had adopted the irrigation system.
Drought resistance index (DRI) in ten wheat genotypes under irrigation and water stress, evaluated in 2016 and 2017.
Irrigated water use efficiency (IWUE)
Water use efficiency (WUE) is understood as a measure of the amount of biomass produced per unit of water used by a plant (Hatfield and Dold, 2019Hatfield, J.L.; Dold, C. 2019. Water-use efficiency: advances and challenges in a changing climate. Frontiers in Plant Science 10: 103.), defined here as the grain yield divided by the amount of water applied. This variable is an essential physiological trait that reflects the responsiveness of crops to water stress in relation to potential yield (Richard, 2006Richard, R.A. 2006. Physiological traits used in the breeding of new cultivars for water-scarce environments. Agricultural Water Management 80: 197-211.; Zhang et al., 2010Zhang, X.; Chen, S.; Sun, H.; Wang, Y.; Shao, L. 2010. Water use efficiency and associated traits in winter wheat cultivars in the north China Plain. Agricultural Water Management 97: 1117–1125.).
In this work, irrigated water use efficiency (IWUE) was adopted, because this variable is more important, from a practical point of view, than WUE, also due to the limitations to crop evapotranspiration (ETc) to take into consideration. According to Farré and Faci (2009)Farré, I.; Faci, J.M. 2009. Deficit irrigation in maize for reducing agricultural water use in a Mediterranean environment. Agricultural Water Management 96: 383–394., not all the water is used in the evapotranspiration process, and part of the water applied can be lost through runoff and deep percolation. Additionally, a fraction of ETc can come from other sources of irrigation, such as water stored in the soil and adequate precipitation. Moreover, according to Farré and Faci (2009)Farré, I.; Faci, J.M. 2009. Deficit irrigation in maize for reducing agricultural water use in a Mediterranean environment. Agricultural Water Management 96: 383–394., this variable helps in assessing the productivity of agricultural systems.
In 2016, the evaluation of wheat genotypes within each water regime for IWUE showed significant changes among genotypes. In WR1, all genotypes presented values higher than PF020037 (Figure 2B). This same tendency of PF020037 was also observed in WR2 and WR3. In WR4, Aliança showed the highest IWUE compared to the other genotypes (10.2 kg ha−1 mm−1). The lowest IWUE was observed in genotypes BRS254 (5.8 kg ha−1 mm−1) and BRS264 (4.1 kg ha−1 mm−1), which are irrigated biotypes (Figure 2B). In 2017, all genotypes showed similar IWUE in WR1 and WR2. In WR3, BRS404 had higher IWUE than PF080492, and in WR4, Aliança had higher IWUE than PF080492, PF020037, and CPAC0544 (Figure 2B).
These results clearly show that the wheat genotypes responded differently to the WRs applied in both years, suggesting that each genotype has a different response to water stress. The results obtained in this work are in agreement with Hu et al. (2006)Hu, Y; Shao, H., Chu; L., Gang, W. 2006. Relationship between water use efficiency (WUE) and production of different wheat genotypes at soil water deficit. Colloids and Surfaces B: Biointerfaces 53: 271–277., Siahpoosh et al. (2011)Siahpoosh, M.R.; Dehghanian, E.; Kamgar, A. 2011. Drought tolerance evaluation of bread wheat genotypes using water use efficiency, evapotranspiration efficiency, and drought susceptibility index. Crop Science 51: 1198–1204., and Siahpoosh and Dehghanian (2012)Siahpoosh, M.R.; Dehghanian, E. 2012. Water use efficiency, transpiration efficiency, and uptake efficiency of wheat during drought. Agronomy Journal 104: 1238–1243., who also found different responses between water use efficiency in several wheat genotypes, according to the water regimes applied.
As regards the water regimes within each genotype, we found significant differences between genotypes. Overall, WR3 had the highest yield per mm of applied water compared to WR1 and WR4. These results are in agreement with several authors (Katerji et al., 2010Katerji, N.; Mastrorilli, M.; Cherni, H.E. 2010. Effects of corn deficit irrigation and soil properties on water use efficiency: a 25-year analysis of a Mediterranean environment using the STICS model. European Journal of Agronomy 32: 177-185., Souza et al., 2019Souza, P.J.O.P.; Ramos, T.F.; Fiel, L.C.S.; Farias, V.D.S.; Sousa, D.P.; Nunes, H.G.G.C. 2019. Yield and water use efficiency of cowpea under water deficit. Revista Brasileira de Engenharia Agrícola e Ambiental 23: 119-125.), who found low values of IWUE under conditions of both low (WR4) and high (WR1) water availability. Plants are not able to absorb all the water provided and also the stress of excess water.
The IWUE of the wheat genotypes studied did not show a significant correlation index with the variables considered in both years of cultivation, except for the hectoliter weight and yield in 2016, but with weak correlation intensity (0.30, p < 0.01 and 0.42, p < 0.01, respectively) (Table 2).
Pearson correlation between peduncle length (PL), number of ear m−2 (NE m−2), hectoliter weight (HW), thousand grain weight (TGW), irrigated water use efficiency (IWUE) and yield of ten wheat genotypes, under four water regimes. Bottom left (2016) and top right (2017).
Thousand Grain Weight (TGW)
The thousand-grain weight (TGW) showed significant differences between the genotypes studied, and it was found that, overall, BR18 stood out positively in all water regimes in both years studied. Furthermore, in most WRs, BR18 was the only genotype that was significantly higher (Figure 3A). Water regimes within each genotype showed that water availability played an essential role in the TGW. All genotypes in both years reduced their TGW in the WR4, and most genotypes had reduced TGW in WR3 (Figure 3A).
Thousand-grain weight correlations with yield were significant at p < 0.01, with values of 0.65 and 0.50 for 2016 and 2017, respectively (Table 2). According to Slafer et al. (2014)Slafer, G.A.; Savin, R.; Sadras, V.O. 2014. Coarse and fine regulation of wheat yield components in response to genotype and environment. Field Crops Research 157: 71–83., TGW can respond to modest changes in genetic or environmental factors, thereby fine-tuning grain yield. Positive correlations between TGW with yield were also obtained by Ayer et al. (2017)Ayer, D.K.; Sharma, A.; Ojha, B.R.; Paudel, A.; Dhakal, K. 2017. Correlation and path coefficient analysis in advanced wheat genotypes. SAARC Journal of Agriculture 15: 1-12. and Gonzalez-Navarro et al. (2016)Gonzalez-Navarro, O.E.; Griffiths, S.; Molero, G.; Reynolds, M.P.; Slafer, G.A. 2016. Variation in developmental patterns among elite wheat lines and relationships with yield, yield components and spike fertility. Field Crops Research 196: 294–304.. The latter studied 27 elite wheat genotypes.
BR18, which is a traditional wheat material, stood out as regards TGW in both years and all water regimes, indicating a larger grain size, which is related to a higher flour extraction.
Hectoliter weight (HW)
Hectoliter weight is an intrinsic capacity of wheat genotype, regardless of water level, which depends on the environment, the heat and the humidity. This trait is as essential as yield because it indicates grain quality. The hectoliter weight (HW) showed significant differences between the genotypes studied in both years of cultivation. Our results suggest that, in general, BRS404 obtained a higher HW average in all water regimes and both years (from 79.1 to 83.4 kg h L−1, Figure 3B). Higher values of HW for BRS404 indicated high grain quality, which increases the capacity to increase market share.
Water regimes within each genotype showed that water availability played an essential role in HW. No genotype stood out on its own; all genotypes suffered from the reduction in water availability, most genotypes showed a decrease in HW with a reduction from WR1 to WR3, and even from WR1 to WR2 (Figure 3B). It is noteworthy that despite the statistically significant differences, all genotypes and water regimes in WR1, WR2, and WR3 had an acceptable HW value and would not be ignored in the market. However, under severe water stress (WR4), BRS264 could have problems with marketing, although HW had an acceptable level (above 70 %).
Hectoliter weight showed strong correlation with yield (0.73, p < 0.01) in both years of cultivation (Table 2), and can be an essential trait worthy of consideration by breeding programs. Similar results were found by Dogan (2009)Dogan, R. 2009. The correlation and path coefficient analysis for yield and some yield components of durum wheat (Triticum turgidum var. Durum l.) in west Anatolia conditions. Pakistan Journal of Botany 41: 1081-1089., who found a 0.76 correlation between HW and yield with Triticum durum. According to Troccoli and Di Fonzo (1999)Troccoli, A.; Di Fonzo, N. 1999. Relationship between kernel size features and test weight in Triticum durum. Cereal Chemistry 76: 45-49., wheat HW values usually range from 70 to 85 kg h L−1 but may be higher or lower due to environmental conditions. The higher the value of HW, the better the quality of wheat, which is reflected in higher flour yield. In the present study, even with water limitation, all genotypes presented HW values in excess of 70 kg h L−1. However, in general, all genotypes showed better grain quality in WR1 and WR2, and, with the reduction in the amount of water applied, the HW was also reduced.
Morphological characterization of genotypes
In addition to yield, supplementary morphological measurements with high heritability can be useful as a tool in breeding programs if they are easy to measure and are correlated with yield under water stress.
Peduncle Length (PL)
Peduncle length (PL) has been extensively studied as an important feature correlated with grain yield. Our results showed small differences for PL on the studied genotypes. In 2016, Brilhante showed a higher PL than BRS404 in WR1 and WR3 (Figure 4A). In WR4, PL was similar in all wheat genotypes. Brilhante had significantly longer penducules in WR1, WR2, and WR3 in 2017, compared to Aliança and BRS404. In WR4, PL in Brilhante was higher than BRS264 and PF020037 (Figure 4A). Furthermore, the availability of water had a strong effect on the PL within each wheat genotype. Overall, in the two years of cultivation, all genotypes expressed a progressive decrease in PL as WR decreased (Figure 4A).
The peduncle length is a crucial feature correlated with grain yield as there is a contribution of peduncle and penultimate inter-node reserves for plant grain yield of 10.2 and 8.4 %, respectively (Borrell et al., 1993Borrell, A.; Incoll, L.D.; Dalling, M.J. 1993. The influence of the Rht1 and Rht2 alleles on the deposition and use of stem reserve in wheat. Annals of Botany 71: 317–326.).
There is a remobilization of stem reserves during wheat grain filling, which is an essential source of carbohydrates (Ehdaie et al., 2008Ehdaie, B.; Alloush, G.A.; Waines, J.G. 2008. Genotypic variation in linear rate of grain growth and contribution of stem reserves to grain yield in wheat. Field Crops Research 106: 34–43.), especially under water stress, with increased carbohydrate remobilization (Mohammadi-Bazargani et al., 2012Mohammadi-Bazargani, M.; Hajirezaei, M.R.; Salekdeh, G.H.; Bushehri, A.A.S.; Falahati-Anbaran, M.; Moradi, F.; Naghavi, M.R.; Ehdaie, B. 2012. A view on the role of metabolites in enhanced stem reserves remobilization in wheat under drought during grain filling. Australian Journal of Crop Science 6: 1613-1623.).
Our results corroborate this idea, as we observed positive correlation between peduncle length and grain yield, with significant correlation indexes of 0.84 and 0.77 (p < 0.01), in 2016 and 2017, respectively (Table 2). It is noteworthy that out of all the variables studied, the length of the peduncle showed the highest correlation with yield (i.e., correlation index of 0.85, Modarresi et al., 2010Modarresi, M.; Mohammadi, V.; Zali, A.; Mard, M. 2010. Response of wheat yield and yield related traits to high temperature. Cereal Research Communications 38: 23–31.). Therefore, under water stress conditions, PL should be a variable to be studied.
Number of Ears (NE m−2)
The number of ears m−2 (NE m−2) in 2016 did not show significant interaction, so the simple effects were analyzed. PF080492 showed the highest mean, and CPAC0544 the lowest values (517 ears m−2 and 359 ears m−2, respectively, Figure 4B). For the water regime factor, WR1 and WR2 were statistically similar and higher than WR3 and WR4, respectively (Figure 4B), indicating that in 2016 drought affected tillering development.
In 2017, the rainfed genotypes PF080492 and PF020037 obtained higher averages for NE m−2 in WR1, compared to BRS254, BRS264, and CPAC0544 (598.5 and 595.5 NE m−2, respectively, Figure 4B). For WR2, only PF080492 presented higher values than all other wheat genotypes, except for Brilhante, BRS404, and PF020037. In WR3 and WR4, all genotypes showed statistically similar values (Figure 4B). In 2017, the genotypes that did not differ in NE m−2 under different applied water regimes were Aliança, BRS254, BRS264, and CPAC0544 (Figure 4B). Brilhante and BRS404 showed lower NE m−2 only in WR4 (337.2 NE m−2). BR18, PF080492, and PF020062 showed lower NE m−2 in WR4 compared to WR1 (Figure 4B).
The NE m−2 presented satisfactory correlation indexes with yield, 0.68, and 0.56 (p < 0.01), in 2016 and 2017, respectively (Table 2). Ojha et al. (2018)Ojha, R.; Sarkar, A.; Aryal, A.; Rahul, K.C.; Tiwari, S.; Poudel, M.; Pant, K.R.; Shrestha, J. 2018. Correlation and path coefficient analysis of wheat (Triticum aestivum L.) genotypes. Farm and Management 3: 136-141. obtained similar results with a correlation of 0.66 between NE m−2 and grain yield. These results indicate that NE m−2 is an essential variable in the selection of more productive wheat genotypes. NE m−2 can be used as useful selection criteria for increasing wheat grain yield under different irrigation levels (Khan and Naqvi, 2012Khan, N.; Naqvi, F. 2012. Correlation and path coefficient analysis in wheat genotypes under irrigated and non-irrigated conditions. Asian Journal of Agricultural Sciences 4: 346-351.). Also, the main component responsible for the regulation of grain yield driven by environmental factors is NE m−2 (Slafer et al., 2014Slafer, G.A.; Savin, R.; Sadras, V.O. 2014. Coarse and fine regulation of wheat yield components in response to genotype and environment. Field Crops Research 157: 71–83.).
Principal Component Analysis (PCA)
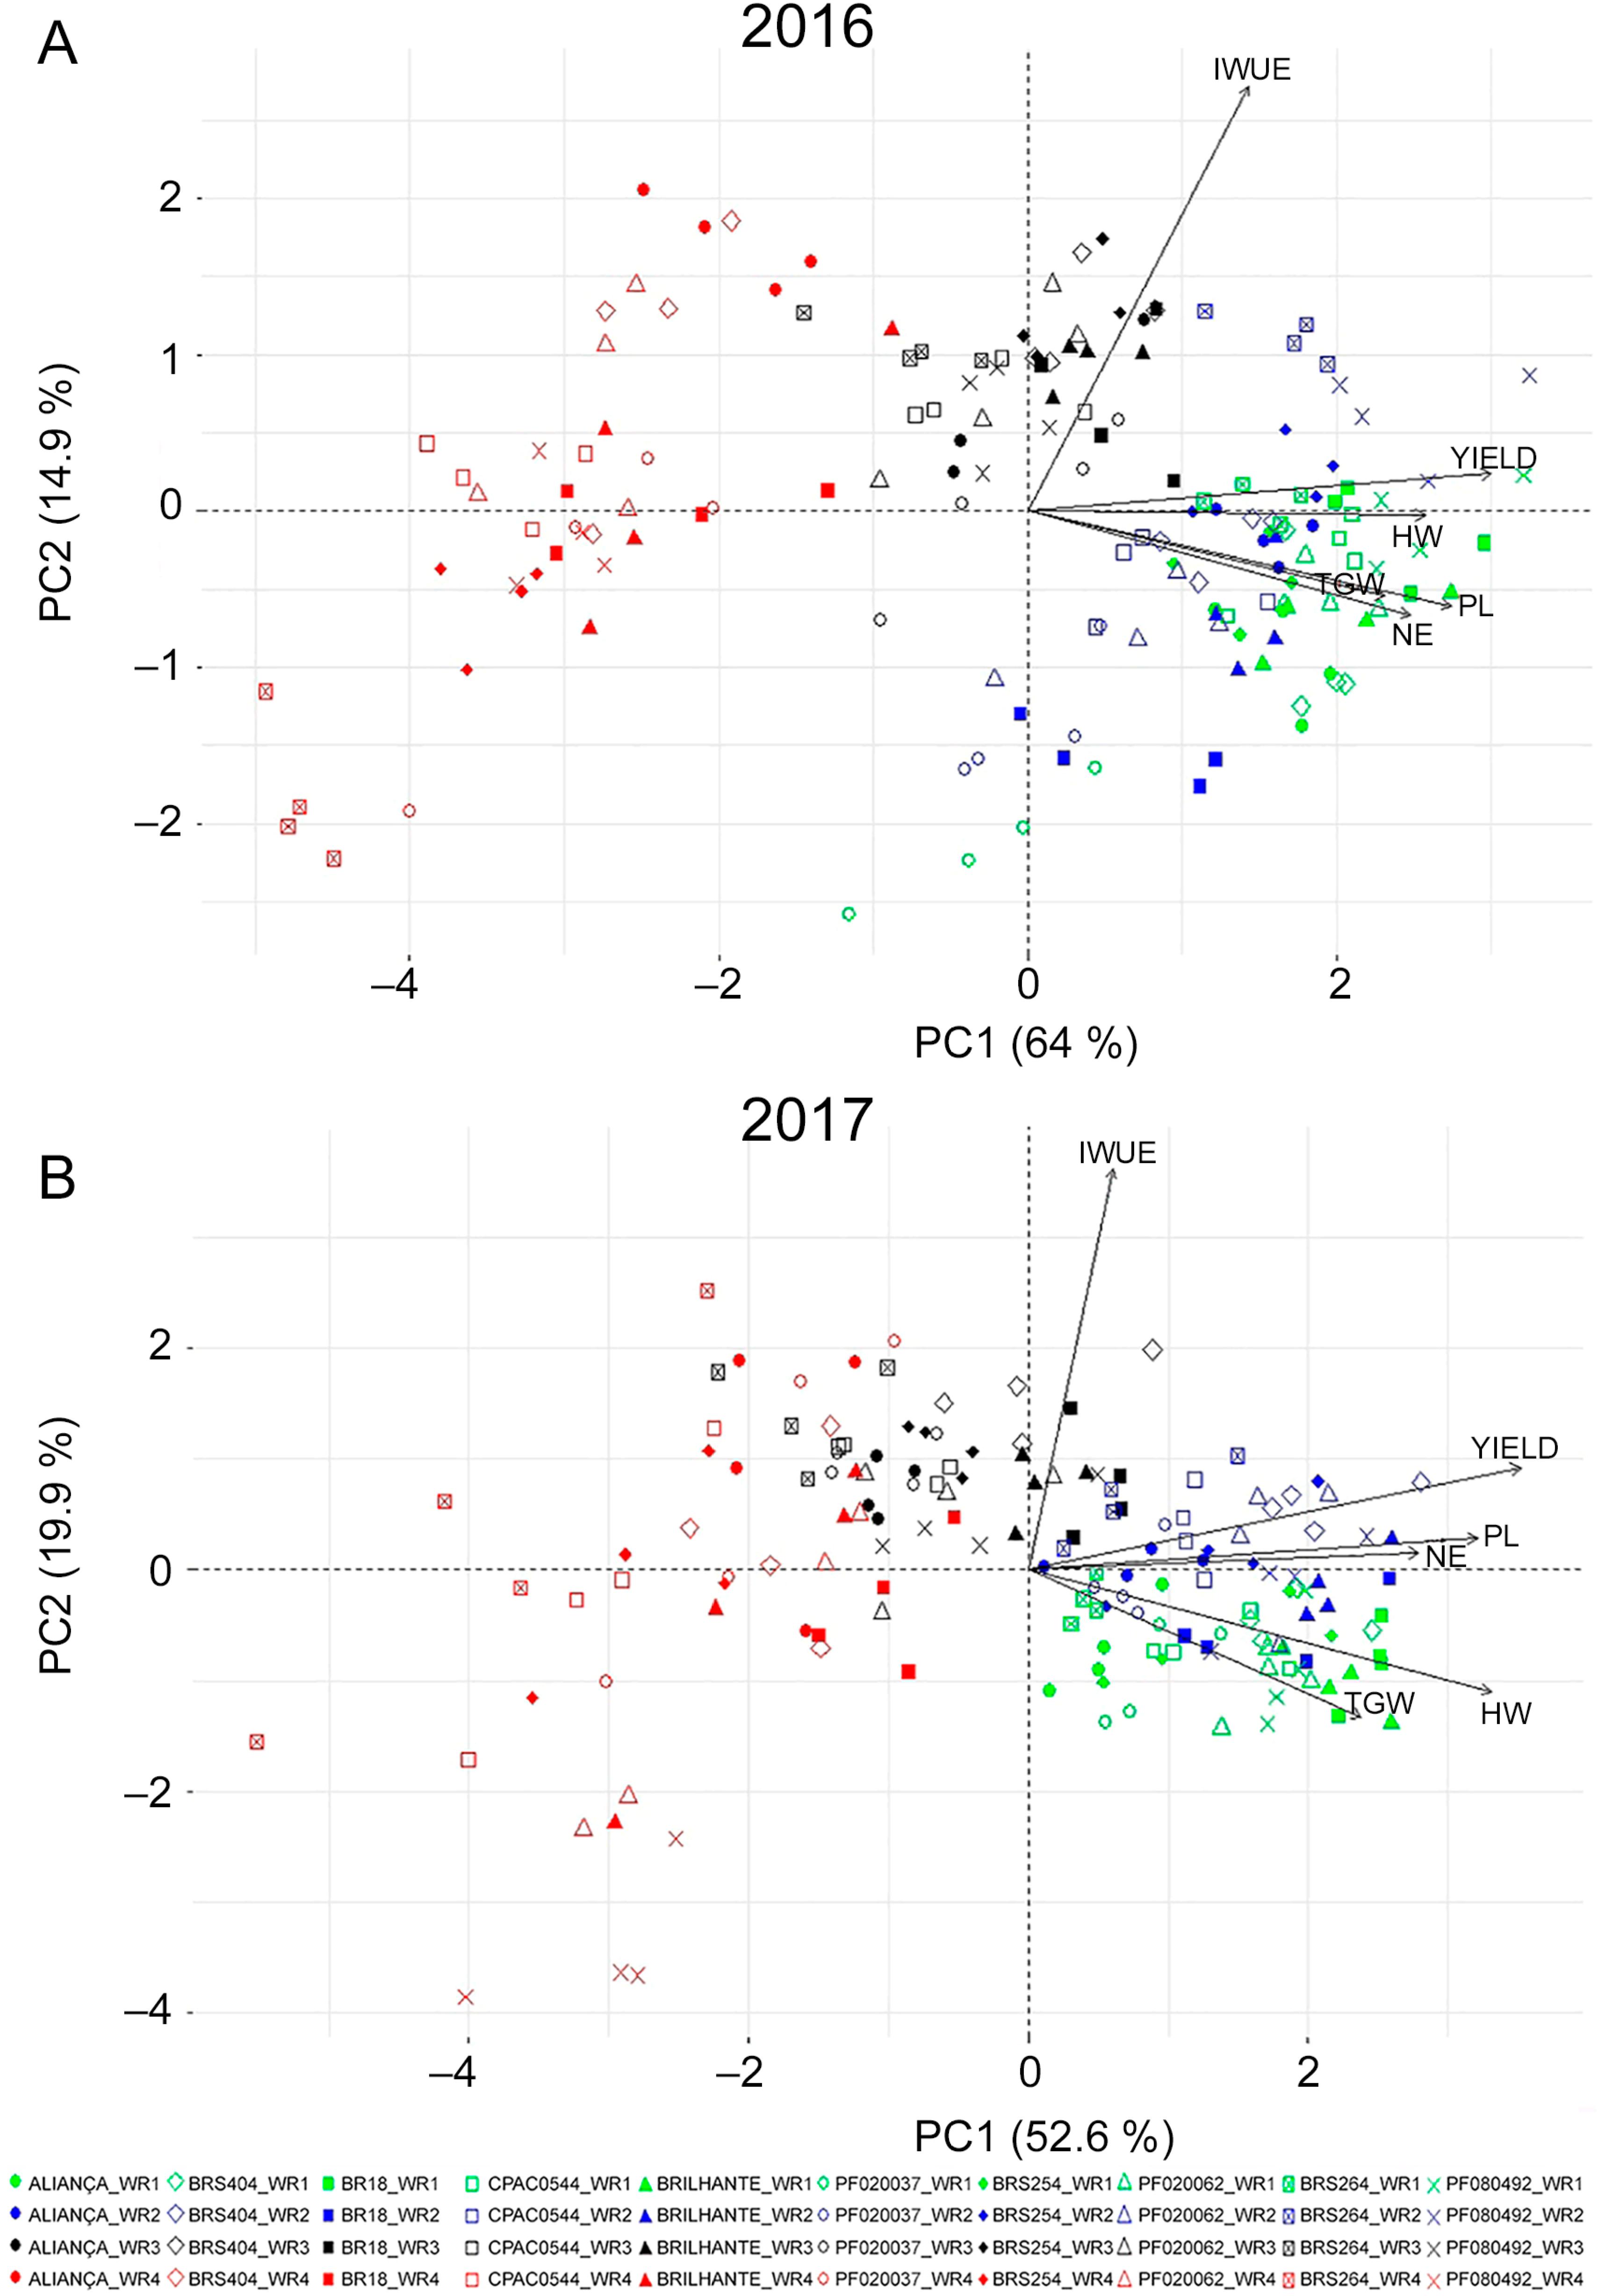
The percentage of total variance explained by the different principal components and their correlations are shown in the matrix of the components analyzed for the two years of cultivation (Table 3). Three main components were important for 2016; they contributed to 89.47 % of the total variance observed, and, for 2017, this figure was also high.
Matrix of the components of six variables from ten wheat genotypes evaluated in four water regimes and two years of cultivation.
In 2016, the first component contributed 64.01 % of the total variation, where PL, NE, TGW, HW, and YIELD had a high positive charge. In the second component, the accumulated contribution was 78.96 %, and IWUE expressed a high positive charge. In the third component, only the HW presented a positive charge, and contributed 89.47 % of the total variation (Table 3).
For the year 2017, the first component contributed 52.62 % of the total variance, and the variables that had a high positive charge were the same as those for the first component of the year 2016 (PL, NE, TGW, HW, and YIELD). In the second component, the accumulated contribution was 71.47 %, and the high positive charge was verified only in the variable IWUE. The third component presented the high positive charge for the HW variable only, and contributed 84.64 % of the total variation (Table 3).
These results show that the characterization of wheat genotypes is relevant in the selection of more productive materials. As observed in both years of cultivation, five of the seven components evaluated expressed a direct influence on grain yield, which are PH, PL, NE, TGW, and HW. According to Mwadzingeni et al. (2016)Mwadzingeni, L.; Shimelis, H.; Tesfay, S.; Tsilo, T.J. 2016 Screening of bread wheat genotypes for drought tolerance using phenotypic and proline analyses. Frontiers in Plant Science 7: 1276., the evaluation of certain yield components in the selection can result in the simultaneous selection of complementary genes that increase grain yield.
The biplots of the main components comprising the relationship between the variables studied and the genotypes in the different water regimes are illustrated in Figures 5A and B. Based on these biplots, we observed that in order to obtain genotypes with a higher yield, the component that most contributes in the selection is the PL, because it has the same direction and the smallest angle of the yield vector.
Ordination diagram derived from principal component biplot in 2016 (A) and 2017 (B) in ten wheat genotypes and four water regimes (WR1, WR2, WR3 and WR4, equivalent to 100 %, 83 %, 50 % and 30 % of crop evapotranspiration replacement). IWUE = irrigated water use efficiency; PL= peduncle length; NE= number ears m−2; HW = hectoliter weight; TGW = thousand grain weight.
NE, TGW, and HW are also important components in the process of selecting more productive materials. When assessing the distribution of points, we observed that there was a tendency for WR1 and WR2 to be positioned on the side of the highest values of the first principal component, in the same orientation as yield. WR3 concentrated the points on the highest values of the first and second main components. WR4 presented its points concentrated on the positive and negative values of the second principal component, with an orientation opposite to the yield. Peduncle length and HW showed high correlation with yield. Furthermore, HW is linked to grain quality, and both variables (PL and HW) can be important tools in the selection of wheat genotypes during breeding programs.
Conclusions
BRS264, an irrigated biotype, was among the most productive wheat genotypes in the highest water regimes (WR1 and WR2), for the two years of cultivation.
Considering that WR1 was the highest water level, it was not expected that rainfed biotype (BR18) would show a higher yield than an irrigated biotype (BRS254).
BRS404, a rainfed genotype, was one of the most productive in WR3 in 2016 and 2017, being more tolerant under moderate stress.
Aliança, a rainfed wheat genotype, showed higher yield in WR4 in 2016 and 2017 and is the most drought tolerant under severe water stress.
Aliança and BRS404 also presented one of the highest DRI for both evaluation years. These genotypes can be used as a reference in the water regimes under which they were outstanding.
The peduncle length and the hectoliter weight were the variables that best correlated with wheat yield.
The irrigated water use efficiency (IWUE) did not correlate with yield and other traits studied. Also, IWUE showed low values under conditions of both low (WR4) and high water availability (WR1).
The PCA showed that the variables PL, NE, TGW, and HW are important traits for the selection of more productive genotypes.
References
- Alvares, C.A; Stape, J.L.; Sentelhas, P.C.; Gonçalves, J.L.M.; Sparovek, G. 2013. Köppen's climate classification map for Brazil. Meteorologische Zeitschrift 22: 711–728.
- Asseng, S.; Turnera, N.C.; Rayb, J.D.; Keating, B.A. 2002. A simulation analysis that predicts the influence of physiological traits on the potential yield of wheat. European Journal of Agronomy 17: 123–141.
- Avramova, V.; Nagel, K.A.; Abdelgavad, H.; Bustoa, D.; Duplessis, M.; Fiorani, F.E.; Beemster, G.T.S. 2016. Screening for drought tolerance of maize hybrids by multi-scale analysis of root and shoot traits at the seedling stage. Journal of Experimental Botany 67: 2453–2466.
- Ayer, D.K.; Sharma, A.; Ojha, B.R.; Paudel, A.; Dhakal, K. 2017. Correlation and path coefficient analysis in advanced wheat genotypes. SAARC Journal of Agriculture 15: 1-12.
- Borrell, A.; Incoll, L.D.; Dalling, M.J. 1993. The influence of the Rht1 and Rht2 alleles on the deposition and use of stem reserve in wheat. Annals of Botany 71: 317–326.
- Companhia Nacional de Abastecimento [CONAB]. 2017. The Wheat Crop = A Cultura do Trigo CONAB, Brasília, DF, Brazil 2017 (in Portuguese).
- Cornic, G. 2000. Drought stress inhibits photosynthesis by decreasing stomatal aperture: not by affecting ATP synthesis. Trends in Plant Science 5: 187–188.
- Dogan, R. 2009. The correlation and path coefficient analysis for yield and some yield components of durum wheat (Triticum turgidum var. Durum l.) in west Anatolia conditions. Pakistan Journal of Botany 41: 1081-1089.
- Ehdaie, B.; Alloush, G.A.; Madore, M.A.; and Waines, J.G. 2006. Genotypic variation for stem reserves and mobilization in wheat. I. Postanthesis changes in internode dry matter. Crop Science 46: 735–746.
- Ehdaie, B.; Alloush, G.A.; Waines, J.G. 2008. Genotypic variation in linear rate of grain growth and contribution of stem reserves to grain yield in wheat. Field Crops Research 106: 34–43.
- Fahad, S.; Bajwa, A.A.; Nazir, U.; Anjum, S.A.; Farooq, A.; Zohaib, A.; Sadia, S.; Nasim, W.; Adkins, S.; Saud, S.; Ihsan, M.Z.; Alharby, H.; Wu, C.; Wang, D.; Huang, J. 2017. Crop production under drought and heat stress: plant responses and management options. Frontiers in Plant Science 8: 1-16.
- Farooq, M.; Hussain, M.; Siddique, K.H.M. 2014. Drought stress in wheat during flowering and grain-filling periods. Critical Reviews in Plant Sciences 33: 331-349.
- Farré, I.; Faci, J.M. 2009. Deficit irrigation in maize for reducing agricultural water use in a Mediterranean environment. Agricultural Water Management 96: 383–394.
- Fischer, R.A; Maurer, R. 1978. Drought resistance in spring wheat cultivars. I. Grain yield responses. Australian Journal of Agricultural Research 29: 897-912.
- Gonzalez-Navarro, O.E.; Griffiths, S.; Molero, G.; Reynolds, M.P.; Slafer, G.A. 2016. Variation in developmental patterns among elite wheat lines and relationships with yield, yield components and spike fertility. Field Crops Research 196: 294–304.
- Hanks, R.J.; Keller J.; Rasmussen, V.P.; Wilson, G.D. 1976. Line source sprinkler for continuous variable irrigation crop production studies. Soil Science Society of America Journal 40: 426-429.
- Hatfield, J.L.; Dold, C. 2019. Water-use efficiency: advances and challenges in a changing climate. Frontiers in Plant Science 10: 103.
- Hu, S.P; Hua, Y.; Zou, G.H.; Liu, H.Y.; Liu, G.L.; Mei, H.; Cai, R.; Li, M.; Luo, L. 2007. Relationship between coleoptile length and drought resistance and their QTL mapping in rice. Rice Science 14: 13-20.
- Hu, Y; Shao, H., Chu; L., Gang, W. 2006. Relationship between water use efficiency (WUE) and production of different wheat genotypes at soil water deficit. Colloids and Surfaces B: Biointerfaces 53: 271–277.
- Jayme-Oliveira, A.; Ribeiro Junior, W.Q.; Ramos, M.L.G.; Ziviani, A.C.; Jakelaitis, A. 2017. Amaranth, C. quinoa and millet growth and development under different water regimes in the Brazilian Cerrado. Pesquisa Agropecuária Brasileira 52: 561-571.
- Kaya, Y.; Akcura, M. 2014. Effects of genotype and environment on grain yield and quality traits in bread wheat (T. aestivum L.). Food Science and Technology 34: 386-393.
- Katerji, N.; Mastrorilli, M.; Cherni, H.E. 2010. Effects of corn deficit irrigation and soil properties on water use efficiency: a 25-year analysis of a Mediterranean environment using the STICS model. European Journal of Agronomy 32: 177-185.
- Khalili, M.; Naghavi, R.M.; Aboughadareh, A.P.; Talebzadeh, S.J. 2012. Evaluation of drought stress tolerance based on selection indices in spring canola cultivars (Brassica napus L.). Journal of Agricultural Science 4: 78-85.
- Khan, N.; Naqvi, F. 2012. Correlation and path coefficient analysis in wheat genotypes under irrigated and non-irrigated conditions. Asian Journal of Agricultural Sciences 4: 346-351.
- Liu, E.K.; Mei, X.R.; Yan, C.R.; Gong, D.Z.; Zhang, Y.Q. 2016. Effects of water stress on photosynthetic characteristics, dry matter translocation and WUE in two winter wheat genotypes. Agricultural Water Management 167: 75–85.
- Ma, J.; Huang, G.B.; Yang, D. L.; Chai, Q. 2014. Dry matter remobilization and compensatory effects in various internodes of spring wheat under water stress. Crop Science 54: 331–339.
- Majid, S.A.; Asghar, R.; Murtaza, G. 2007. Yield stability analysis conferring adaptation of wheat to pre-and post-anthesis drought conditions. Pakistan Journal of Botany 39:1623-1637.
- Ministério da Agricultura, Pecuária e Abastecimento [MAPA]. 2009. Rules for Seed Analysis = Regras para Análise de Sementes. MAPA/ACS, Brasília, DF, Brazil (in Portuguese).
- Modarresi, M.; Mohammadi, V.; Zali, A.; Mard, M. 2010. Response of wheat yield and yield related traits to high temperature. Cereal Research Communications 38: 23–31.
- Mohammadi-Bazargani, M.; Hajirezaei, M.R.; Salekdeh, G.H.; Bushehri, A.A.S.; Falahati-Anbaran, M.; Moradi, F.; Naghavi, M.R.; Ehdaie, B. 2012. A view on the role of metabolites in enhanced stem reserves remobilization in wheat under drought during grain filling. Australian Journal of Crop Science 6: 1613-1623.
- Munns, R.; James, R.A.; Sirault, X.R.; Furbank, R.T.; Jones, H.G. 2010. New phenotyping methods for screening wheat and barley for beneficial responses to water deficit. Journal of Experimental Botany 61: 3499–3507.
- Mwadzingeni, L.; Shimelis, H.; Tesfay, S.; Tsilo, T.J. 2016 Screening of bread wheat genotypes for drought tolerance using phenotypic and proline analyses. Frontiers in Plant Science 7: 1276.
- Ojha, R.; Sarkar, A.; Aryal, A.; Rahul, K.C.; Tiwari, S.; Poudel, M.; Pant, K.R.; Shrestha, J. 2018. Correlation and path coefficient analysis of wheat (Triticum aestivum L.) genotypes. Farm and Management 3: 136-141.
- Ribeiro, G.; Pimente, A.J.B.; Souza, M.A.; Rocha, J.R.A.S.C.; Fonseca, W.B. 2012. Stress for high temperatures in wheat: impact on development and mechanisms of tolerance. Revista Brasileira de Agrociência 18: 133-142 (in Portuguese, with abstract in English).
- Ribeiro Júnior, W.Q.; Ramos, M.L.G.; Rebouças, U.V.; Trindade, M. da G.; Ferreira, F.M.; Siqueira, M.M.H.; Silva, H.L.M.; Rodrigues, G.C.; Guerra, A.F; Rocha, O.C.; Amábile, R.F.; Albuquerque, N.C.; Silva, M.S.; Albrecht, J.C.; Durães, F.O.M. 2006. Phenotyping for drought tolerance to improve wheat in the Cerrado = Fenotipagem para tolerância à seca visando o melhoramento do trigo no Cerrado. Circular Técnica Embrapa Trigo 1: 1-20 (in Portuguese).
- Richard, R.A. 2006. Physiological traits used in the breeding of new cultivars for water-scarce environments. Agricultural Water Management 80: 197-211.
- Siahpoosh, M.R.; Dehghanian, E. 2012. Water use efficiency, transpiration efficiency, and uptake efficiency of wheat during drought. Agronomy Journal 104: 1238–1243.
- Siahpoosh, M.R.; Dehghanian, E.; Kamgar, A. 2011. Drought tolerance evaluation of bread wheat genotypes using water use efficiency, evapotranspiration efficiency, and drought susceptibility index. Crop Science 51: 1198–1204.
- Slafer, G.A.; Savin, R.; Sadras, V.O. 2014. Coarse and fine regulation of wheat yield components in response to genotype and environment. Field Crops Research 157: 71–83.
- Souza, P.J.O.P.; Ramos, T.F.; Fiel, L.C.S.; Farias, V.D.S.; Sousa, D.P.; Nunes, H.G.G.C. 2019. Yield and water use efficiency of cowpea under water deficit. Revista Brasileira de Engenharia Agrícola e Ambiental 23: 119-125.
- Troccoli, A.; Di Fonzo, N. 1999. Relationship between kernel size features and test weight in Triticum durum Cereal Chemistry 76: 45-49.
- Zhang, X.; Chen, S.; Sun, H.; Wang, Y.; Shao, L. 2010. Water use efficiency and associated traits in winter wheat cultivars in the north China Plain. Agricultural Water Management 97: 1117–1125.
- Waitt, D.E.; Levin, D.A. 1998. Genetic and phenotypic correlations in plants: a botanical test of Cheverud's conjecture. Heredity 80: 310–319.
Edited by
Publication Dates
-
Publication in this collection
24 Aug 2020 -
Date of issue
2021
History
-
Received
29 Nov 2019 -
Accepted
15 Apr 2020