Abstract
Quality control is used to evaluate processes and products, and is a powerful tool for reducing variability. The objective of this study was to evaluate the quality of green sugarcane (Saccharum spp.) cutting for mechanized harvest, using statistical quality control tools. Cutting height and damage to ratoon stalks caused by different blade and disc combinations of the basecutter mechanism were used as indicators of quality. Cutting height showed high variability with a controlled process for some treatments. However, these treatments were incapable of producing satisfactory results. The damage index was lower in treatments that used tilted blades, but above the target for all treatments, which caused significant damage to the ratoons. In general, the process of mechanized harvest as assessed by these indicators was found incapable of achieving targeted results and staying below specification limits, and thus requires corrective actions to improve quality.
cut height; capability analysis; damage index; statistical process control
AGRICULTURAL ENGINEERING
Quality of cut and basecutter blade configuration for the mechanized harvest of green sugarcane
Anderson de Toledo§ § Present address: IAPAR, Rod. Celso Garcia Cid, km 375, C.P. 481 − 86001-970 − Londrina, PR Brasil. * * Corresponding author < anderson@iapar.br> Edited by: José Euclides Stipp Paterniani ; Rouverson Pereira da Silva; Carlos Eduardo Angeli Furlani
UNESP/FCAV Depto. de Engenharia Rural, Via de Acesso Prof. Paulo Donato Castellane 14884-900 Jaboticabal, SP Brasil
ABSTRACT
Quality control is used to evaluate processes and products, and is a powerful tool for reducing variability. The objective of this study was to evaluate the quality of green sugarcane (Saccharum spp.) cutting for mechanized harvest, using statistical quality control tools. Cutting height and damage to ratoon stalks caused by different blade and disc combinations of the basecutter mechanism were used as indicators of quality. Cutting height showed high variability with a controlled process for some treatments. However, these treatments were incapable of producing satisfactory results. The damage index was lower in treatments that used tilted blades, but above the target for all treatments, which caused significant damage to the ratoons. In general, the process of mechanized harvest as assessed by these indicators was found incapable of achieving targeted results and staying below specification limits, and thus requires corrective actions to improve quality.
Keywords: cut height, capability analysis, damage index, statistical process control
Introduction
The basal cutting of sugarcane stalks is a major cause of damage and losses in mechanical harvesting. Stalks are cut by the impact of cutting blades, but this impact usually causes damage to them. This impact is also a source of disturbance for the ratoons and may damage the root system.
Mello and Harris (2003) evaluated the influence of blade type on the cutting of sugarcane stalks and concluded that the tilted blade and a serrated step of 3 mm yielded the best result (i.e., the least stalk damage). Mello (2005) observed that the serrated step of 3 mm presented the lowest specific cutting force, but did not differ from the smooth cutting form, for both 450 and 600 rpm rotations of the tangential speed of the blades.
Taghijarah et al. (2011) studied the shearing of sugarcane stalks, found that shear strength and specific shear increased with the loading rate, and recommended lower rates to reduce energy demand. Although they studied Miscanthus x giganteus, Johnson et al. (2012) investigated how the cutting speeds of blades set at oblique angles affect cutting energy and concluded that an angle of 60º required the least amount of energy to cut stems. Liu et al. (2012) found that serrated blades require less energy and force than flat blades, and suggest that they may yield the desired cut quality.
Research on quality indicators for agricultural operations, and especially for sugarcane, has been carried out in Brazil since the 1990s. Salvi et al. (2007) evaluated the performance of a base cutting device for harvest using cutting height as a quality indicator; losses in mechanized sugarcane harvest were quantified and described by Silva et al. (2008); and variability in sugarcane billet dimensions between green and burnt conditions for mechanical harvest was reported by Peloia et al. (2010). All of these authors enumerated quality indicators for mechanized operations of sugarcane, and concluded that such monitoring can increase the quality of operations.
The hypothesis tested in this study is that cut height and damage caused to ratoons are quality indicators of the mechanized sugarcane harvest process, and that this quality is influenced by the sets of blades and base cutting discs. The aim of this study was to evaluate the quality of mechanized sugarcane harvests using five configurations of the basecutter mechanism.
Materials and Methods
The study was carried out in Guariba, São Paulo state, Brazil (21º25' S; 48º08' W, 530 m a.s.l., and climate classified as Aw under the Köppen-Geiger system). The soil at the site was an Oxisol (USDA, 1999) with a clayey texture (clay: 480 g kg−1, silt: 120 g kg−1 and sand: 400 g kg−1) and a slope of 6 %. The study was performed between 10 and 15 July 2008, during a mechanized harvest of sugarcane over an area of approximately 50 ha, using a harvester (average speed of harvest: 4.7 km h−1), with a basecutter mechanism equipped with sets of discs and blades as described in Table 1.
The sugarcane variety was 'SP 91-1049', first cut harvested. The stalk inclination of the sugarcane was evaluated to characterize the crop prior to harvest in ten points of each treatment with ten replicates, using the methodology of the standard triangle suggested by Ripoli (1996). Stalks were classified as erect (angle in relation to the ground greater than 45°), lodged (angle between 22.5 and 45°), or lying (angle less than 22.5°). Five treatments were evaluated, configured by three blades and three models of basecutter discs, with characteristics described in Tables 1, 2 and 3, combined with five settings (Table 1).
Cutting height and stalk damage to the ratoons were selected as quality indicators of the process, after a brainstorming session with the researchers and the manager of the farm. For each treatment of blade and disc combinations, evaluations were sequentially carried out in 40 ratoons and bounded by a square frame with sides of 0.50 m.
The height from the stalk to the ground level was measured in order to obtain the cutting height by using the point where the blades of the mechanism hit the stem as a reference. The arithmetic mean for each ratoon, based on the number of stems present, was used to represent the cutting height. All stalks enclosed by the frame were counted and classified based on Table 4, simultaneously by two evaluators. The number of stalks was the arithmetic mean of these counts for each classification.
To determine the quality of the cutting, a damage index of each ratoon was calculated by assigning weights for each classification set out in Table 4, calculated according to Equation (1):

where: pSD = weight given to undamaged stalks (‑1); nSD = number of undamaged stalks; pPD = weight given to partially damaged stems (‑0.33); nPD = number of partially damaged stalks; pED = weight given to severely damaged stalks (1); nED = number of severely damaged stalks; and N = total number of stalks in the plot. Thus, damage indices were assessed for each ratoon and used in Statistical Process Control (SPC) tools.
SPC is a dynamic and interactive method in which one compares the current performance of the process to specified standards so that decisions can be taken and changes to the process made so that it achieves the desired standard. The quality control tools used in this analysis are briefly described here. Control charts were used to verify the stability of the process. A stable process shows only common causes of inherent variability or natural data variation. Special causes are due to external factors, and directly affect the variation, and they must be identified and minimized, or even eliminated, when the focus is on quality improvement.
The type of control chart selected for quality indicators presents one graph for individual observations and another one for the variation of the process, obtained by the amplitude calculated between two successive observations. When an observation exceeds the control limits, as calculated using the actual variation in the process, it is highlighted in the control chart and the process is considered out of control because it is affected by special causes of variation.
Fundamentally, capability analysis determines the capacity of the process by comparing the variation dispersion of the process within the specification limits. It is thus estimated as the ratio between the extent of the variation of the process and the extent of the specification limits; this ratio quantifies the capability of the process to produce results, products, or services within these limits.
The capability index (Cpk) was adopted as a reference of the process, being classified as "capable" for values greater than 1.33, "partially capable" for values between 1.00 and 1.32, and "unable" for values lower than 1.00, and calculated as described by Montgomery and Runger (2003).
Based on previous assessments and suggestions by the farm management, the lower and upper specification limits (LSL and USL, respectively) were adopted and targets for quality indicators are shown in Table 5.

where: Cpk = capability index; min = only the lowest result of the two equations is the Cpk; USL = upper specification limit; LSL = lower specification limit; µ = average; and σ = standard deviation.
The calculated target of damage index -0.47 was obtained considering that 40 % of stalks were considered undamaged, 50 % partially damaged and 10 % severely damaged, using Equation (1).
Results and Discussion
Initially, the Pearson test of correlation between the variables was carried out and did not yield a significant correlation (p > 0.05) between sugarcane stalk inclination, cutting height, and the damage index. Univariate techniques were thus applied, using the SPC tools, and nothing could be said about the influence of one variable on another.
Sugarcane stalk angle was characterized as lying in the areas assessed for the FSDN, FLDI, FSDI and FDTR treatments (Table 1). For the FLDN treatment, the percentage of lodged stems was slightly higher than the percentage of lying stalks (Figure 1). Therefore, in general, angles classified as lying were considered disadvantageous, given that they may influence the quality of the mechanized harvest.
As illustrated by the control chart of variation of the process for cutting height (Figure 2), represented by the amplitude between two consecutive points (moving range), in the FLDI treatment the process is out of statistical control. This is also the case for FLDN in the individual value chart. Using the same indicator, Salvi et al. (2007) reported cutting height in mechanical harvests to be out of control, with or without the use of automatic control.
In the control chart showing the moving range for FLDI, the points highlighted above USL indicate that there was an abrupt change between one observation and the next, showing that the process variation is not due solely to natural causes. However, the control limits in this treatment are narrower than in the other treatments, due to the lower data dispersion. While the other treatments do have points with values that exceed those out of control points in the FLDI treatment, they did not exceed the limits due to the different variation in each treatment.
If the processes were analyzed only by average cutting height (lowest FLDI: 50.8 mm; highest FLDN: 71.5 mm), they could be said to have achieved satisfactory results, considering the specification limits. However, this interpretation may mask the temporal variability seen in cutting height, which in turn reduces the operational quality of the mechanical harvest.
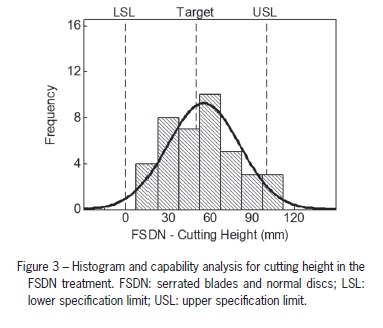
With regard to other tests of statistical control, capability analysis was applied for the variable cutting height in the treatments that were under control: FSDN, FSDI, and FDTR. The results of these analyses are presented in Table 6 and Figures 3, 4 and 5.
Table 6 presents capability indices (Cpk) for cutting height and damage index in the treatments that were under control. These index values ranked the process in the three treatments as unable to produce satisfactory results, based on the specification limits.
The treatment with the best results for cutting height was FSDN, for which 92 % of observations fell within the range of 0-100 mm. Looking at the graphs of capability analysis, one can see that the three treatments are not centered on the target of the process, and that the points that make the process unviable are above the USL.
The suggested damage index represents in a single value the classification given to the ratoons (Table 4) for undamaged, partially damaged, and severely damaged stalks. The closer this index is to 1.00, the greater the damage caused to stalks, since it shows that there were more stalks classified as severely damaged than in the other categories. Conversely, the closer the index is to -1.00, the less the damage to stalks, with -1.00 indicating no damage whatsoever.
The variation in damage index for the ratoons between treatments indicates that the process of mechanical harvest was out of control for the FSDN and FDTR treatments (Figure 6), as shown by the graph of the variation of the process (moving range), and also for the FLDI treatment, as seen in the chart for the observations with a point below the lower control limit. Therefore, for the FSDN and FDTR treatments the variation led the process out of statistical control, which means that the variation was high, and that special causes can be identified.
In the case of the treatment with smooth blades and tilted discs (FLDI), the moving range, which represents the variation of the process, was stable; however, one point for the absolute value of the damage index led the process out of control. At this point (observation 84), the damage index was -0.67, close to the target, which in this case is desirable. Therefore, the rest of observations presented non-desirable values, shifting the whole process in relation to the target. A similar situation occurred for the treatment with blades fast-exchange discs (FDTR), in which the damage index was calculated as -1.00 for observation 196. The average damage index of the treatments varied between 0.36 and 0.59, above the target, which was established as -0.47, indicating that damage caused to the ratoons during mechanical harvest was high in all treatments.
For the treatments with blades that were tilted with respect to the radial line of the support disc for the basecutter mechanism, the damage indices were lower: 0.36 and 0.42 for FDTR and FLDI, respectively. These treatments caused the least damage to the evaluated stalks, even though these values are not close to the target. Mello (2005) explains that due to the tilt of the blades, the cutting occurs by slipping, thus reducing the reaction force of the stalk, especially at higher angular speeds.
As for the serrated blades, Mello and Harris (2003) studied their performance in the laboratory and observed that blades with a forward tilt and serration yielded the best results, causing less damage. In this experiment, serrated blades yielded a higher damage index (0.52 for FSDI and for 0.59 FSDN), representing a higher percentage of severely damaged stalks per ratoon than the other treatments, contrary to the results presented by these authors.
Since the treatments FLDN and FSDI demonstrated a stable process for the damage index in the control charts for observations, their variation is presented in Table 6 and Figures 7 and 8, for the analysis process capability. In both cases, the process is shifted to the right relative to the target, with 95 and 87 % of observations above the upper specification limit (USL) for FLDN and FSDI, respectively, showing no capability to achieve the limits specified for the operation.
The situations where the damage index values exceeded the lower control limit (points highlighted in Figure 6) represent the highest harvest quality, since damage there was lowest. This finding corroborates the capability analysis of the process, which is the quality benchmark for the established target, which for the FLDN and FSDI treatments is displayed in Figures 7 and 8 as the shifting to the right of the process target.
The Cpk values of the FLDN (-0.53) and FSDI (-0.52) treatments were below 1.00, confirming that they are unable to reach the target or to remain in a controlled and stable process. Thus, cutting in the mechanized harvest of sugarcane, as measured by the damage index indicator, needs to be revised in order to identify which sources of variation interfere with the process.
Conclusions
Damage levels were lowest when using tilted cutting blades. With regard to cutting height, the treatment with serrated blades and normal discs (FSDN) yielded the best result. The proposed analysis of damage index to ratoons helped assess the quality of cutting by adding a single value to the classification assigned to the stalks. The process of mechanical harvesting was incapable of meeting the established targets, and thus unable to maintain the performance standard established for these indicators.
Acknowledgements
To the Brazil's National Council for Scientific and Technological Development (CNPq), for providing scholarships to the authors, and to the whole team at Fazenda Santa Izabel for the support they provided in carrying out this study.
Received November 16, 2011
Accepted June 27, 2013
- Johnson, P.C.; Clementson, C.L.; Mathanker, S.K.; Grift, T.E.; Hansen, A.C. 2012. Cutting energy characteristics of Miscanthus x giganteus stems with varying oblique angle and cutting speed. Biosystems Engineering 112: 42-48.
- Liu, Q.; Mathanker, S.K.; Zhang, Q.; Hansen, A.C. 2012. Biomechanical properties of miscanthus stems. Transactions of the ASABE 55: 1125-1131.
- Mello, R.C.; Harris, H. 2003. Performance of basecutter of sugarcane harvester with angled and serrated blades. Revista Brasileira de Engenharia Agrícola e Ambiental 7: 355-358 (in Portuguese, with abstract in English).
- Mello, R.C. 2005. Effect of blade shape and speed on cutting forces for sugar cane. Acta Scientiarum: Agronomy 27: 661-665 (in Portuguese, with abstract in English).
- Montgomery, D.C.; Runger, G.C. 2003. Applied Statistics and Probability for Engineers. 3ed. John Wiley, New York, NY, USA.
- Peloia, P.R.; Milan, M.; Romanelli, T.L. 2010. Capacity of the mechanical harvesting process of sugar cane billets. Scientia Agricola 67: 619-623.
- Ripoli, T.C.C. 1996. Testing & certification of machines to harvest sugar cane = Ensaio & certificação de máquinas para colheita de cana-de-açúcar. p. 635-673. In: Mialhe, L.G. Agricultural machinery: tests & certification = Máquinas agrícolas: ensaios & certificação. CNPQ-PADCT/TIB/FEALQ, Piracicaba, SP, Brazil (in Portuguese).
- Salvi, J.V.; Matos, M.A.; Milan, M. 2007. Evaluation of the performance of a base cutting device of a sugar cane harvester. Engenharia Agrícola 27: 201-209 (in Portuguese, with abstract in English).
- Silva, R.P.; Corrêa, C.F.; Cortez, J.W.; Furlani, C.E.A. 2008. Statistical control applied in the process of mechanical sugar cane harvest. Engenharia Agrícola 28: 292-304 (in Portuguese, with abstract in English).
- Taghijarah, H.; Ahmadi, H.; Ghahderijani, M.; Tavakoli, M. 2011. Shearing characteristics of sugar cane (Saccharum officinarum L.) stalks as a function of the rate of the applied force. Australian Journal of Crop Science 5: 630-634.
- United States Department of Agriculture [USDA]. 1999. Soil taxonomy: a basic system of soil classification for making and interpreting soil surveys. 2ed. Natural Resources Conservation Service, Washington, DC, USA.
Publication Dates
-
Publication in this collection
03 Dec 2013 -
Date of issue
Dec 2013
History
-
Received
16 Nov 2011 -
Accepted
27 June 2013