ABSTRACT
Traditional livestock productivity is hard to estimate, since it depends on a gamut of animal production indicators that are difficult to measure for many farms. Thus, we propose an analytical method for estimating productivity and understanding the importance of animal production indicators under different full-cycle cattle production systems in Brazil. To evaluate the impact of these indicators, equations were derived from a comutational model of herd evolution for estimating the output parameters of the system as follows: productivity per hectare (PH) and offtake rate (COR), as a function of the indicators; calving rate (CR), mating age (AM), age of slaughter (AS) and stocking rate (SR). For this analysis, twenty-seven scenarios (simulation data) of low to high productivity were used, resulting from the combination of the following factors and levels: 1) calving rate of 50, 65 and 80 %; 2) mating age of heifers of one, two and three, years of age; and 3) age at slaughter of one, two and three year old steers. The scenario with the highest impact for each parameter and the indicator of highest impact for each scenario were identified for the production conditions in the region. Under most scenarios, a reduction in mating age had a greater impact on the productivity indexes compared to a reduction in slaughter age. Appropriate management of available technologies enables farmers to compare the marginal impacts of specific indicators on full-cycle production systems for beef cattle.
adoption of technology; animal production; management; stocking rate
Introduction
Beef production is one of the main economic activities in the Brazilian Pampa Biome. Increases in system efficiency are possible through the improvement of animal productivity indicators, with the use of practices and technologies aimed at intensifying production ( Soussana et al., 2004Soussana, J.F.; Loiseau, P.; Vuichard, N.; Ceschia, E.; Balesdent, J.; Chevallier, T.; Arrouays, D. 2004. Carbon cycling and sequestration opportunities in temperate grasslands. Soil Use and Management 20: 219-230. ; Veysset et al., 2010Veysset, P.; Lherm, M.; Bébin, D. 2010. Energy consumption, greenhouse gas emissions and economic performance assessments in French Charolais suckler cattle farms: model-based analysis and forecasts. Agricultural Systems 103: 41-50. ; Veysset et al., 2014Veysset, P.; Lherm, M.; Bébin, D.; Roulenc, M.; Benoit, M. 2014. Variability in greenhouse gas emissions, fossil energy consumption and farm economics in suckler beef production: analysis of results from 59 French farms. Agriculture, Ecosystems & Environment 88: 180-191. ).
The technologies used to increase animal performance and the production output of the system should be evaluated to determine the effects of intensification ( Lampert et al., 2012Lampert, V.N.; Barcellos, J.O.J.; Kliemann Neto, F.J.; Canellas, L.C.; Dill, M.D.; Canozzi, M.E.A. 2012. Development and application of a bioeconomic efficiency index for beef cattle production in Rio Grande do Sul, Brazil. Revista Brasileira de Zootecnia 41: 775-782. ; Dill et al., 2015b). Economic simulation models have been used to analyze the interactions and impact of the use of resources on animal production indicators ( Beretta et al., 2002Beretta, V.; Lobato, J.F.P.; Mielitz Netto, C.G. 2002. Productivity and biological efficiency of alternative beef cattle life-cycle production systems in Rio Grande do Sul. Revista Brasileira de Zootecnia 31: 991-1001 (in Portuguese, with abstract in English). ; Villalba et al., 2010Villalba, D.; Ripoll, G.; Ruiz, R.; Bernués, A. 2010. Long-term stochastic simulation of mountain beef cattle herds under diverse management strategies. Agricultural Systems 103: 210-220. ; Parsons et al., 2011Parsons, D.; Nicholson, C.F.; Blake, R.W.; Ketterings, Q.M.; Ramírez-Aviles, L.; Cherney, J.H.; Fox, D.G. 2011. Application of a simulation model for assessing integration of smallholder shifting cultivation and sheep production in Yucatan, Mexico. Agricultural Systems 104: 13-19. ; Nasca et al., 2015Nasca, J.A.; Feldkamp, C.R.; Arroquy, J.I.; Colombatto, D. 2015. Efficiency and stability in subtropical beef cattle grazing systems in the northwest of Argentina. Agricultural Systems 133: 85-96. ).
The identification of the impact on production parameters is important in the definition of intensification strategies, since the improvement of animal production indicators and the increase in support capacity of the pasture can enhance the rate of herd offtake and the efficiency of the system ( Marques et al., 2017Marques, P.R.; Peripolli, V.; Lampert, V.N.; Dias, E.A.; Pereira, G.R.; Oliveira, T.E.; Rocha, M.K.; Barcellos, J.O.J. 2017. A proposal for the evaluation of the bioeconomic efficiency of beef cattle production systems. Revista Brasileira de Zootecnia 46: 65-71. ). However, the lack of data collection in livestock activities makes it difficult to evaluate production systems, effects of on-farm management and the calculation of these metrics (Rosado Jr. et al., 2011). Furthermore, there is a technological gap in the generation of metrics of livestock productivity, as very few studies deal with global indicators, with most of them using indicators on individual animals or herds ( Upton, 1989Upton, M. 1989. Livestock productivity assessment and herd growth models. Agricultural Systems 29: 149-164. ; Du Toit et al., 2013Du Toit, C.J.L.; Meissner, H.H.; Van Niekerk, W.A. 2013. Direct methane and nitrous oxide emissions of South African dairy and beef cattle. South African Journal of Animal Science 43: 320-339. ; Blignaut et al., 2017Blignaut, J.; Crookes, D.; Saki, A. 2017. The demand for ecosystem services by different calf-production systems in South Africa. African Journal of Agricultural and Resource Economics 12: 158-173. ).
Usually, the methods used to estimate production by area and offtake rate are complex, requiring a substantial amount of information, such as the number of animals sold per category, the average sale weight and the variation in body weight of the stock. Therefore, it becomes relevant to develop a simple model that simplifies the estimation of the productivity of full-cycle systems. Moreover, there is a need to develop a method that could be easily used by many farmers, as average productivity indicators of grass-fed animals in Brazil are still very low. This study proposes a simple analytical method for estimating productivity and understanding the effects of animal production indicators in different full-cycle production system scenarios for cattle ranching in southern Brazil.
Materials and Methods
To carry out this study, a computational model was developed that estimates the overall productivity from technical coefficients of beef cattle production. To estimate the marginal impact of the animal production indicators, it was necessary to estimate a linear regression using simulated data from 10,000 scenarios in the computational model with 138 production variables (Appendix I) to generate 10,000 data points. With this regression model it was possible to perform a sensitivity analysis of the marginal impact and thus understand the variation in productivity under different scenarios.
The computational model had no optimization framework ( Barbier and Bergeron, 1999Barbier, B.; Bergeron, G. 1999. Impact of policy interventions on land management in Honduras: results of a bioeconomic model. Agricultural Systems 60: 1-16. ) but presents the following characteristics: a) steady-state herd model; that is, a herd-growth model in which growth is assumed to be zero and is an effective method of making standardized comparisons ( Upton, 1989Upton, M. 1989. Livestock productivity assessment and herd growth models. Agricultural Systems 29: 149-164. ); b) the model was run at two different moments in time, without describing the intermediate processes or measuring the interval between processes necessary for the stabilization of the new structure of the herd; c) the distribution of the animal categories (quantity of animals of each category differentiated by sex and age) reflects the effects of technical indicators on the birth of calves, death and sale of steers, cows, heifers and culled bulls; d) sale was exclusive of animals for slaughter, with calves, rearing animals or lean animals for finishing not being sold; e) the herd was closed, with no purchase of animals (no beef cattle being purchased from another farm). Only animals produced on-farm were commercialized for slaughter.
The productivity analysis was performed using eleven variables under twenty-seven performance scenarios representing different levels of intensification of the production system.
The input variables of the model were: calving rate (CR: the number of calves weaned divided by the number of cows mated during breeding season of the previous year, %); mean herd mortality rate (%); animal stocking rate (SR: animal unit ha–1, in which an animal unit = 450 kg of body weight (BW)); annual rate of cow culling (%); annual cull rate of bulls (%); percentage of bulls in the herd (%); age at first mating (years); age at slaughter (years); weight at weaning (kg of BW); the average annual weights of different animal categories (kg of BW), and slaughter weights of these categories (kg, BW) ( Table 1 ). This model served to generate the data used to estimate the linear regression used in the present study.
Overall productivity of the system was represented by the output indicators of the model and was defined as the production of BW per hectare (PH, kg of BW ha–1) and offtake rate (COR, %) of the herd, the latter being defined as the proportion of animals sold or consumed in a year of beef production (Dill et al., 2015a). The productivity per hectare is the quotient between the BW of slaughtered animals and offtake rate divided by the BW of animals in stock (weight of the herd animals) in the region of interest. This is a complementary indicator that will not be used in all analyses, but is used to evaluate the efficiency of the herd without considering the effect of stocking rate as does PH.
The values of the input variables were defined based on information from similar research considered representative of the Pampa Biome in the south of Brazil ( Table 1 ). The extensive beef production system used here is also representative of the traditional southern Brazilian pastoral system. The main feature of this system is the use of large tracts of land with little or no subdivision where the animals are able to continuously graze on natural pasture throughout the year with little or no supplementation ( Dick et al., 2015Dick, M.; Silva, M.A.; Dewes, H. 2015. Life cycle assessment of beef cattle production in two typical grassland systems of southern Brazil. Journal of Clean Production 96: 426-434. ).
The parameters were specified with equal intervals between the levels ( Nordblom et al., 1994Nordblom, T.L.; Pannell, D.J.; Christiansen, S.; Nersoyan, N.; Bahhady, F. 1994. From weed to wealth? Prospects for medic pastures in Mediterranean farming systems of northwest Syria. Agricultural Economics 11: 29-42. ), totaling twenty-seven scenarios of low to high productivity, created from simulation data, resulting from the combination of the following factors and levels: 1) calving rate of 50, 65 and 80 %; 2) mating age (AM) of heifers of one, two or three year (s) of age; and 3) age at slaughter (AS) of one, two and three year old steers ( Table 1 ). These intervals were chosen based on bovine production in Brazil in which a pregnancy rate of 50 % is considered low and 80 % high.
Calculations and statistical analyses
The regression models used to predict PH and COR included the effects of CR, AM and AS (both linear and quadratic) as well as the interactions between the main effects. The prediction of PH and COR was determined by discrete values in a matrix and by continuous values by multiple regression equations estimated from the model obtained through the stepwise method as follows:
Yijk = values for dependent variables PH and COR obtained from the performance model for scenario ijk, for calving rate i, age at first mating j and slaughter age k; b0 to b10 are regression coefficients and εijk is the random error associated with each observation.
Validation of the model was performed using Embrapa’s Gerenpec® 1.0 software program which calculates the productivity of the system based on a complete survey of production and economic information, depending on the system evaluated. The results obtained with the regression were compared with the results obtained using the Embrapa system. The existence of high positive correlation was taken as an indication that the regression equations were adequate for estimating productivity. The equations estimated the productivity of the system, and through the sensitivity analyses the different impacts of changes in CR, AM and AS on PH and COR were evaluated. Variations in productivity were analyzed from scenarios representing different levels of intensification.
These productivity changes were analyzed by relative marginal (RMI), absolute marginal (AMI) and qualitative marginal impact (QMI). The relative marginal impact is the percentage variation of the system productivity indicators (PH and COR) for each unit of variation of the animal production input indicators (CR, AS and AM). The absolute marginal impact is the absolute variation in the same unit of the overall productivity indicators resulting from the unit variation of change in the animal production indicators. The qualitative marginal impact is a scale that qualitatively compares the absolute impact on each other, making it possible to identify the scenario with the greatest impact for each output indicator in addition to the animal production indicator with the greatest impact for each scenario. This methodology was developed to help identify the best strategies that increase the overall productivity of the system from a marginal gain perspective.
For QMI, the individual impact of each indicator in the change of PH and COR was represented by a scale of “+” signs between 1 and 5 to facilitate the comparative systemic analysis of several sources of information in a single table. The higher the number of signals (+), the greater the impact of the indicator on the overall increase in productivity of the system. The structured evaluation model for beef cattle production systems, which ends with the assessment of the QMI, are presented in Figure 1 .
– Structured evaluation model for productivity in beef cattle production systems in the Brazilian Pampa.
In this model, the reproduction and weight indicators are interpreted differently than in most other studies, since they are not indicators of input, but of output. Instead of seeking to know the effect that feeding has on indicators such as birth rate, age of slaughter and age of mating, for example, independent of nutrition, changes in these indicators were used to estimate the composition of the structure of the herd and, as a consequence, of the overall productivity of the system.
To our knowledge, there are as yet no studies that address area productivity analyses and herd efficiency from this perspective, which would provide a way to predict productivity with the use of only a few variables. The main advantage of this approach is the possibility of identifying a pattern, in the form of an equation, which can be used to calculate the productivity and efficiency of the production system. The absence of the need to know the performance of the pasture to calculate productivity, such as the effect of pasture quality on animal performance, is taken into consideration in the indicators of the overall performance of the herd. This can expedite productivity estimates of a much greater number of properties, facilitating data mining from the collection and storage in a geographical information system of a given territory, biome or country.
Results
With the computational model, equations (1) and (2) were derived to estimate the overall productivity of systems (PH and COR) under different productivity scenarios. Stocking rate was included in model (1) using regression analysis, assuming its effect to be directly proportional to PH and had no effect on COR.
where PH is productivity per hectare, SR the stocking rate, CR the calving rate, AM the mating age, AS the age of slaughter and COR the offtake rate.
The model showed that the increase in productivity depends on the combination of changes in stocking rate and herd performance, evaluated by its main animal production indicators (CR, AM and AS) ( Table 2 ).
– Scenarios of intensification of productivity of beef cattle per hectare (PH) and offtake rate (COR) calculated by the computational model, through varying calving rate (CR), age of mating (AM), age of slaughter (AS) and animal stocking rate (SR).
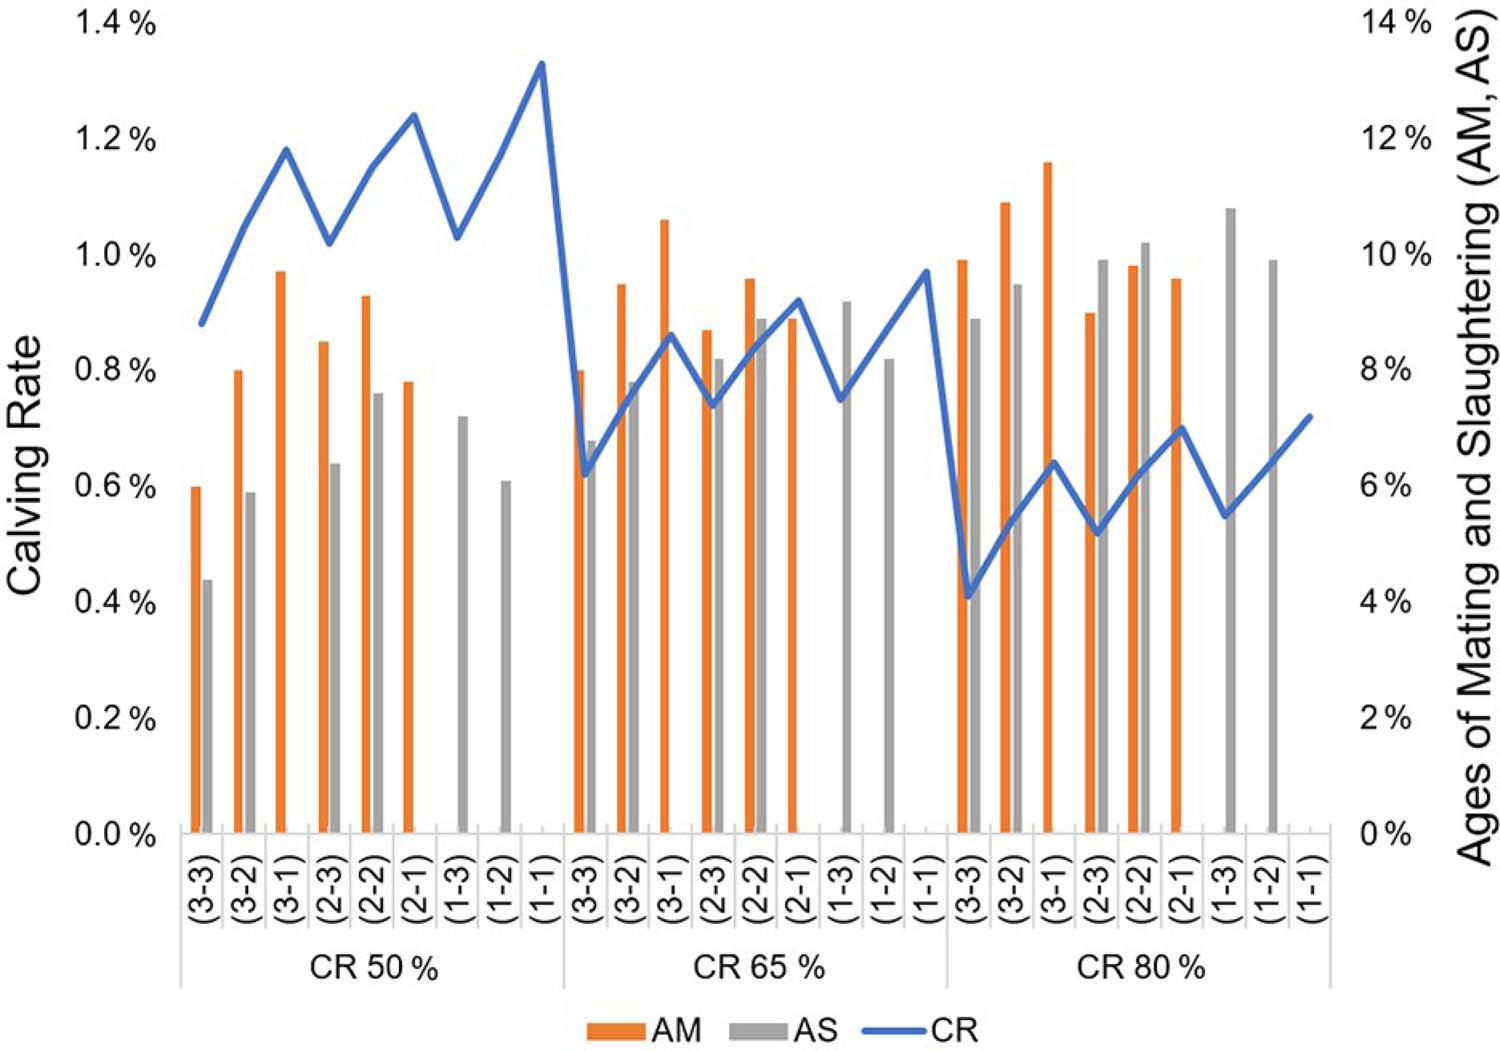
In the AMI analysis, obtained by subtracting the productivity of each scenario, it is evident that the productivity of a livestock production system does not solely depend on the animal stocking rate. This, if informed in isolation, without taking into account the herd performance, indicates only the stock of animals in the system, that is, the amount of animals per area. This measurement is sometimes confusing as an indicator of productivity. The animal production indicators (CR, AM and AS) have different effects on PH and COR that can be observed in RMI ( Table 3 ). The scenarios in which the indicators show the highest RMIs are 50-1-1 (1.33 % for CR); 80-3-1 (11.60 % for AM) and 80-1-3 (10.80 % for AS). The marginal impact of the indicators follow a clear pattern, recording higher numbers in scenarios where the value of the indicator is lower and the other indicators are high. It is not possible to directly compare CR with AM and AS, but it is possible to compare AM with AS because they use the same units.
The importance of increasing the calving rate is measured by its marginal impact and increases with the reduction in slaughter age (CR-AM-AS scenarios: 50-3-3, 50-3-2 and 50-3-1) and reduction of mating age (CR-AM-AS: 50-3-3, 50-2-3 and 50-1-3). On the other hand, its relative impact decreases with an increase in CR (CR-AM-AS: 50-3-3, 65-3-3 and 80-3-3).
Although there is a growing impact for AM and AS, a pattern in their variation was not identified, as observed for CR. Thus, the understanding of a regularity in change of marginal impacts of AM and AS can be obtained from equations for specific systems, with less variability. However, by taking a systemic view, one can understand the pattern of joint variation in the CR, AM and AS indicators due to their relative marginal impacts ( Figure 2 ), as RMI is dependent on PH and COR, and these independent variables change with the variations in CR, AM and AS.
– Relative marginal impacts of beef cattle production on yield per hectare (PH, kg BW ha–1) and offtake rate (COR, %), due to changes in Age mating (AM, years) and Age slaughter (AS, years) (on the curve) and Calving rate (CR, %), AM and AS (between curves).
QMI ( Table 4 ) shows the variations of PH and COR under different scenarios. The greater the number of “+” signs, the greater the impact of the indicator on the increase in system productivity. The “+” were obtained from percentiles. The top 20 % were represented by +++++, the top 40 % by ++++, the top 60 % by +++, and so on up to the top 20 % with lower impact that were represented by just one “+”. With QMI, it was possible to compare the impact of CR, AS and AM with each other and to understand the magnitude of this change when switching scenarios. The absolute impacts were not presented, as they were used to calculate the qualitative impacts.
Discussion
Increased stocking, if not accompanied by the corresponding energy input into the system, can result in a significant reduction in reproductive and weight indicators (AS and AM) and a consequent decrease in production per hectare. In this study, the simulation showed that an increase in stocking rate by 33 % (from 0.75 to 1.00 animal unit ha–1), together with a reduction of animal production indicators (CR-AM-AS: 80-2-2 to 50-3-3) produced a decrease in PH of 8.70 % (from 119.50 to 109.20 kg BW ha–1) and in COR of 31.00 % (from 37.40 % to 25.80 %). However, with this same increase in stocking rate, maintaining animal production indexes, COR did not change, but PH increased by 33.40 % (from 119.50 to 159.40 kg BW ha–1). Therefore, the best intervention results are achieved when using technologies that combine the increase in stocking rate with an improvement in herd production indicators. In animal production, these technologies may be related to feeding, health, genetic, husbandry or management aspects (Dill et al., 2015b).
Reproductive efficiency is one of the most important components for the productivity of cow-calf systems ( Trenkle and Willham, 1977Trenkle, A.; Willham, R.L. 1977. Beef production efficiency. Science 198: 1009-1015. ). However, scenarios exist where the impact of reproductive indicators on the overall productivity of a system should be analyzed through interaction with other animal production indicators. In our simulation, the impact of the marginal increase in CR on PH decreased as CR increased. When CR increased from 50 % to 65 %, with AM and AS constant over three years, production per hectare increased by 6.50 kg (54.60 - 61.10). However, if the calving rate rose from 65 % to 80 %, PH decreased by 4.90 kg ha–1 (66.00 - 61.10). The PH grows as CR increases, presenting an increasingly smaller slope of the line ( Figure 2 ). This indicates the. Existence of an “optimal” limit that can be achieved by taking into account factors of production, land prices, livestock performance, production value and costs. Thus, farmers who aim to maximize the profitability of their farms, and minimize risks, need to efficiently allocate their resources to optimize production ( Lampert et al., 2012Lampert, V.N.; Barcellos, J.O.J.; Kliemann Neto, F.J.; Canellas, L.C.; Dill, M.D.; Canozzi, M.E.A. 2012. Development and application of a bioeconomic efficiency index for beef cattle production in Rio Grande do Sul, Brazil. Revista Brasileira de Zootecnia 41: 775-782. ; Dill et al., 2015a).
The most effective intervention in increasing overall productivity in livestock farming is through investing in production indicators that are relatively low. This “relativization” can be obtained by comparing the value of the indicator with the mean and variability in a sample or region of farmers with similar production systems. Productivity is limited by the less available resource, when the others are at adequate levels. Thus, one of the contributions of this analysis is to help decision making indicating in each scenario, which is the animal production indicator that, relatively, best responds and contributes to the increase in production per hectare.
Currently, the calculation of PH and COR is complex and requires a substantial amount of information, such as the number of animals sold per category, the average sale weight and the variation in stock in kilos of body weight. As this information is not always available and qualified human resources are required to obtain these metrics ( Soraya et al., 2013Soraya, T.; Nabinger, C.; Becker, J.L. 2013. Bioeconomic model of decision support system for farm management. Part I. Systemic conceptual modeling. Agricultural Systems 115: 104-116. ), the calculation of productivity by these traditional methods is difficult. The regression model simplifies the estimation of the productivity of full-cycle systems, and data need to be collected on only three variables on-farm. Thus, the computational models and simplified regression equations proposed here did not consider all the details of the production systems but provided a first approximation of productivity (Rosado Jr. et al., 2011).
The data were entered into the Gerenpec software program tool and the results compared with the estimates obtained in the regression model. Correlations of 0.76 for yield per hectare and 0.88 for offtake rate were found suggesting this model was shown to present an adequate representation of reality ( Pidd, 1996Pidd, M. 1996. Tools for Thinking: Modelling in Management Science. John Wiley, Chichester, UK. ). The regression showed an adjusted R2 of 0.98 for PH and 0.96 for COR. The advantage of using the regression equations with a reduced number of variables is the simplification of data collection and processing, which is not the case in many agricultural planning software programs.
An improvement in CR was seen with PH at decreasing rates. It should be noted that decreasing impact does not mean a decrease in productivity, but that the increment decreases in intensity with each increase in the calving rate ( Pang et al., 1999Pang, H.; Makarechian, M.; Basarab, J.A.; Berg, R.T. 1999. Structure of a dynamic simulation model for beef production systems. Canadian Journal of Animal Science 79: 409-417. ). For this reason, it is necessary to evaluate the bioeconomic response of the process. On the other hand, when analyzing the improvements in AM or AS, CR is maximized as its marginal impact increases at increasing rates. Even so, persistently increasing CR alone reduces the value of its impact and has a greater response when the calving rate is low and the other indicators are already high.
It is important to emphasize that the model was simplified and was able to explain significantly the productivity of beef cattle per hectare (PH) with the variables calving rate (CR), age of mating (AM), age of slaughter (AS) and animal stocking rate (SR). Thus, the reduction in AM shows a greater impact on productivity indices than the reduction in AS in almost all scenarios evaluated. Therefore, the effects of AM on the increase of PH and COR are higher in less technology-intense production systems. Under these systems, PH and COR are determined fundamentally by CR. However, this difference decreases as productivity increases. Consequently, the impact of AM on the increase of PH and COR is relatively higher under low and medium productivity scenarios, while that of AS is relatively higher in medium and high productivity scenarios. This fact shows that productivity increases faster with increases in scarce resources. In order to determine the age of slaughter or mating a minimum weight of each animal has to be taken into account, and the reduction in one year for both indicators presupposes the elimination of an animal category from the herd. The impact of this elimination on PH is lower when the heifer is excluded compared with excluding steer for slaughter, since the numerator denominator–1 of the calculation of PH has a greater magnitude when the slaughter age is reduced.
The RMI values increase in a linear fashion ( Figure 2 ), since they are derived from the first derivative of the second-degree regression equations. The behavior of the impact in each of these figures occurs in two ways: 1) on the curve (fixed CR): the RMI grows at constant rates with the increase of AM and AS; and 2) between curves (variable CR): the RMI grows at decreasing rates with the increase of CR, AM and AS. With these simultaneous increases, PH and COR grow at increasing rates (RMI increases). Although the behavior of changes is similar, one cannot rule out the importance of using PH and COR together, since this reveals the origin of productivity gains, i.e. they become evident if they were a result of increasing the amount of animals per area (PH) or by improving the performance of livestock (COR), which can present the same value with different stocking rates.
In this context, the following order of priority can be highlighted to achieve increases in production per hectare ( Table 4 ): 1) raise the calving rate (+++); 2) reduce the age of mating (++) and 3) reduce the age of slaughter (+) for the scenario with 50 % pregnancy, mating age at two years and age of slaughter at three years. In addition, an inspection of each line reveals which indicator impacts most strongly each scenario and in the column which scenario responds most strongly to an improvement in any of the three indicators. With QMI, it was easy to identify the scenario with the greatest impact for each indicator and the indicator of greatest impact for each scenario. Reproductive traits are not always the ones that show most impact or help increase productivity in full-cycle systems. The impact of animal production indicators in increasing production per hectare varies within the scenarios. However, when the productive system reaches 80 % pregnancy, maintaining the age of mating and slaughter at two and three years, respectively, the predominant strategy for increasing productivity changes from reproductive indicators (CR) to growth characteristics (AS) (++ / ++ / +++). Moreover, with an increase in pregnancy from 50 % to 65 %, this trend can still be observed, since all three indicators have identical QMIs (++ / ++ / ++). Thus, the practical implications of CR, AM and AS variations and the overall productivity of the full-cycle system show that the impact of the calving rate in increasing production per hectare is greater in more extensive systems with low calving rates. Its marginal impact, and consequently its relative importance, decreases as the rate rises. Therefore, raising calving rates that are no longer limiting ceases to be a priority ( Figure 3 and 4).
– Graphical summary of relative marginal impacts (RMI) of Calving rate (CR, %), Age mating (AM, years) and Age Slaughter (AS, years) in production per hectare (PH, kg BW ha–1) of beef cattle.
In systems with high calving rates, reducing the age at slaughter and producing younger animals has a greater impact on productivity per hectare than reducing the age at mating. This behavior is explained by the structure of the herd, in which, with high rates of calving, the participation of reproductive questions are already partially met and thus the reduction in the age of mating becomes less important than the reduction in the age of slaughter. Therefore, investing in growth traits in more intensive systems is a useful strategy because their relative importance increases with high calving rates.
The strategies presented here can be used when there are insufficient financial resources or infrastructure on-farm to invest and improve all the aspects of production, thereby making it necessary to invest in one strategy at a time. However, the effect of the modification of productivity indexes was enhanced with simultaneous improvements in CR, AM and AS. Furthermore, the impact increases in tandem with the risk, as several modifications are proposed, and these interventions occur simultaneously. This lack of understanding of the effects of interventions on global productivity makes it difficult to prioritize and weakens decision-making. Perhaps the lack of knowledge about the integral response of biological and economic systems is limiting the adoption of technologies. In this case, it is fundamental to understand the principles that govern the functioning of the system productivity resulting from changes in animal production indicators ( Marques et al., 2015Marques, P.R.; Barcellos, J.O.J.; Dill, M.D.; Dias, E.A.; Azevedo, E.V.T.; Lampert, V.N.; McManus, C.M. 2015. Competitiveness levels in cattle herd farms. Ciência Rural 45: 480-484. ). An example of this customization of impacts and costs can be verified by analyzing the advantages and disadvantages of mating heifers at earlier ages. In this case, the return on investment is faster, the productive life of each cow increases, and the number of female replacements is reduced ( Short et al., 1994Short, R.E.; Staigmiller, R.B.; Bellows, R.A.; Greer, R.C. 1994. Breeding heifers at one year of age: biological and economic considerations. In: “Factors Affecting Calf Crop”, Boca Raton, United States. ). However, mating heifers at earlier ages may present drawbacks, such as increased feed costs and increased calving problems ( Seidel and Whittier, 2015Seidel Jr., G.E.; Whittier, J.C. 2015. Beef species symposium: beef production without mature cows. Journal of Animal Science 93: 4244-4251. ).
Other studies with a systemic approach may also complement this study, helping to understand the productive effects by improving the indicators in an isolated or simultaneous manner, mainly by including prices and costs. Improving production efficiency would mean not concentrating efforts on a single component, but rather understanding and managing productive activities as a system ( Gomes et al., 2015Gomes, E.G.; Abreu, U.G.P.; Mello, J.C.C.B.S.; Carvalho, T.B.; Zen, S. 2015. Economic and socio-environmental performance assessment of beef cattle production systems: a data envelopment analysis (DEA) approach with weight restrictions. Revista Brasileira de Zootecnia 44: 219-225. ). In this sense, identifying the impact of the changes of the animal production indicators on the productivity of the farming system can help in the definition of strategies and the ordering of investment priorities ( Pereira et al., 2016Pereira, M.A.; Fairweather, J.R.; Woodford, K.B.; Nuthall, P.L. 2016. Assessing the diversity of values and goals amongst Brazilian commercial-scale progressive beef farmers using Q-methodology. Agricultural Systems 144: 1-8. ). Finally, it seems plausible to consider that the risks of investments in the system are lower when the indicators have a higher QMI.
In the future, with the development of computerized tools and more intense use of information technologies in the range sector, it may be possible to predict the estimation of new QMI matrices customized to each production system, offering greater accuracy in choosing the best path to increase productivity.
Conclusions
Production per unit area and offtake are important parameters for estimating productivity in beef cattle farming systems. These can be estimated using birth rates, age at first mating and slaughter age. System efficiency also includes stocking rate.
The integrated evaluation presented here allows for the quantification of the magnitude of effects of the indicators used over time, pursuant to system intensification. As such, reductions in mating or slaughter age act in a way that is different from birth rate on the productivity of the system. A reduction in mating age presents greater impact than slaughter age in lower productivity systems.
Finally, specifically for the systems of the Pampa Biome in the south of Brazil, the decision support tools should consider maximum investment limits or additional local costs for feed to reduce the age at slaughter and mating.
– Graphical summary of the qualitative marginal impacts of Calving rate (CR, %), Age mating (AM, years) and Age Slaughter (AS, years) in the production per hectare (PH, kg BW ha–1) of beef cattle, with the increase of the calving rate (CR).
Appendix
Acknowledgments
To the Fundação de Apoio ao Desenvolvimento do Ensino, Ciência e Tecnologia do Estado de Mato Grosso do Sul (FUNDECT), the Conselho Nacional de Desenvolvimento Científico e Tecnológico (CNPq) and Coordenação de Aperfeiçoamento de Pessoal de Nível Superior (CAPES) – Programa Nacional de Pós-Doutorado (PNPD) (Project - 2842/2017).
References
- ANUALPEC. 2017. Brazilian Livestock Yearbook = Anuário da Pecuária Brasileira. FNP, São Paulo, SP, Brazil (in Portuguese).
- Barbier, B.; Bergeron, G. 1999. Impact of policy interventions on land management in Honduras: results of a bioeconomic model. Agricultural Systems 60: 1-16.
- Beretta, V.; Lobato, J.F.P.; Mielitz Netto, C.G. 2002. Productivity and biological efficiency of alternative beef cattle life-cycle production systems in Rio Grande do Sul. Revista Brasileira de Zootecnia 31: 991-1001 (in Portuguese, with abstract in English).
- Blignaut, J.; Crookes, D.; Saki, A. 2017. The demand for ecosystem services by different calf-production systems in South Africa. African Journal of Agricultural and Resource Economics 12: 158-173.
- Dick, M.; Silva, M.A.; Dewes, H. 2015. Life cycle assessment of beef cattle production in two typical grassland systems of southern Brazil. Journal of Clean Production 96: 426-434.
- Dill, M.D.; Emvalomatis, G.; Saatkamp, H.; Rossi, J.A.; Pereira, G.R.; Barcellos, J.O.J. 2015a. Factors affecting adoption of economic management practices in beef cattle production in Rio Grande do Sul State, Brazil. Journal of Rural Studies 42: 21-28.
- Dill, M.D.; Pereira, G.R.; Costa Jr., J.B.G.; Canellas, L.C.; Peripolli, V.; Braccini Neto, J.; Sant’Anna, D.M.; McManus, C.M.; Barcellos, J.O.J. 2015b. Technologies that affect the weaning rate in beef cattle production systems. Tropical Animal Health and Production 47: 1255-1260.
- Du Toit, C.J.L.; Meissner, H.H.; Van Niekerk, W.A. 2013. Direct methane and nitrous oxide emissions of South African dairy and beef cattle. South African Journal of Animal Science 43: 320-339.
- Gomes, E.G.; Abreu, U.G.P.; Mello, J.C.C.B.S.; Carvalho, T.B.; Zen, S. 2015. Economic and socio-environmental performance assessment of beef cattle production systems: a data envelopment analysis (DEA) approach with weight restrictions. Revista Brasileira de Zootecnia 44: 219-225.
- Lampert, V.N.; Barcellos, J.O.J.; Kliemann Neto, F.J.; Canellas, L.C.; Dill, M.D.; Canozzi, M.E.A. 2012. Development and application of a bioeconomic efficiency index for beef cattle production in Rio Grande do Sul, Brazil. Revista Brasileira de Zootecnia 41: 775-782.
- Marques, P.R.; Barcellos, J.O.J.; Dill, M.D.; Dias, E.A.; Azevedo, E.V.T.; Lampert, V.N.; McManus, C.M. 2015. Competitiveness levels in cattle herd farms. Ciência Rural 45: 480-484.
- Marques, P.R.; Peripolli, V.; Lampert, V.N.; Dias, E.A.; Pereira, G.R.; Oliveira, T.E.; Rocha, M.K.; Barcellos, J.O.J. 2017. A proposal for the evaluation of the bioeconomic efficiency of beef cattle production systems. Revista Brasileira de Zootecnia 46: 65-71.
- Nasca, J.A.; Feldkamp, C.R.; Arroquy, J.I.; Colombatto, D. 2015. Efficiency and stability in subtropical beef cattle grazing systems in the northwest of Argentina. Agricultural Systems 133: 85-96.
- Nordblom, T.L.; Pannell, D.J.; Christiansen, S.; Nersoyan, N.; Bahhady, F. 1994. From weed to wealth? Prospects for medic pastures in Mediterranean farming systems of northwest Syria. Agricultural Economics 11: 29-42.
- Pang, H.; Makarechian, M.; Basarab, J.A.; Berg, R.T. 1999. Structure of a dynamic simulation model for beef production systems. Canadian Journal of Animal Science 79: 409-417.
- Parsons, D.; Nicholson, C.F.; Blake, R.W.; Ketterings, Q.M.; Ramírez-Aviles, L.; Cherney, J.H.; Fox, D.G. 2011. Application of a simulation model for assessing integration of smallholder shifting cultivation and sheep production in Yucatan, Mexico. Agricultural Systems 104: 13-19.
- Pereira, M.A.; Fairweather, J.R.; Woodford, K.B.; Nuthall, P.L. 2016. Assessing the diversity of values and goals amongst Brazilian commercial-scale progressive beef farmers using Q-methodology. Agricultural Systems 144: 1-8.
- Pidd, M. 1996. Tools for Thinking: Modelling in Management Science. John Wiley, Chichester, UK.
- Pötter, L.; Lobato, J.F.P.; Mielitz Netto, C.G.A. 2000. Economic analyses of a production model to primiparous beef heifers at two, three and four years of age. Revista Brasileira de Zootecnia 29: 861-870 (in Portuguese, with abstract in English).
- Rosado Júnior, A.G.; Lobato, J.F.P.; Müller, C.J. 2011. Building consolidated performance indicators for an agribusiness company: a case study. Revista Brasileira de Zootecnia 40: 454-461.
- Seidel Jr., G.E.; Whittier, J.C. 2015. Beef species symposium: beef production without mature cows. Journal of Animal Science 93: 4244-4251.
- Serviço Brasileiro de Apoio às Micro e Pequenas Empresas [SEBRAE]. 2005. Diagnosis of Beef Cattle Production Systems in the state of Rio Grande do Sul = Diagnóstico de Sistemas de Produção de Bovinocultura de Corte no estado do Rio Grande do Sul. Editora SENAR, Porto Alegre, RS, Brazil (in Portuguese).
- Short, R.E.; Staigmiller, R.B.; Bellows, R.A.; Greer, R.C. 1994. Breeding heifers at one year of age: biological and economic considerations. In: “Factors Affecting Calf Crop”, Boca Raton, United States.
- Soraya, T.; Nabinger, C.; Becker, J.L. 2013. Bioeconomic model of decision support system for farm management. Part I. Systemic conceptual modeling. Agricultural Systems 115: 104-116.
- Soussana, J.F.; Loiseau, P.; Vuichard, N.; Ceschia, E.; Balesdent, J.; Chevallier, T.; Arrouays, D. 2004. Carbon cycling and sequestration opportunities in temperate grasslands. Soil Use and Management 20: 219-230.
- Trenkle, A.; Willham, R.L. 1977. Beef production efficiency. Science 198: 1009-1015.
- Upton, M. 1989. Livestock productivity assessment and herd growth models. Agricultural Systems 29: 149-164.
- Veysset, P.; Lherm, M.; Bébin, D. 2010. Energy consumption, greenhouse gas emissions and economic performance assessments in French Charolais suckler cattle farms: model-based analysis and forecasts. Agricultural Systems 103: 41-50.
- Veysset, P.; Lherm, M.; Bébin, D.; Roulenc, M.; Benoit, M. 2014. Variability in greenhouse gas emissions, fossil energy consumption and farm economics in suckler beef production: analysis of results from 59 French farms. Agriculture, Ecosystems & Environment 88: 180-191.
- Villalba, D.; Ripoll, G.; Ruiz, R.; Bernués, A. 2010. Long-term stochastic simulation of mountain beef cattle herds under diverse management strategies. Agricultural Systems 103: 210-220.
-
Edited by: Gerson Barreto Mourão
Publication Dates
-
Publication in this collection
04 Nov 2019 -
Date of issue
2020
History
-
Received
08 Aug 2018 -
Accepted
18 Jan 2019