ABSTRACT
Experiments where the response is a categorical variable are usually carried out in many fields such as agriculture. In addition, in some situations this response has three or more levels without an order between them characterizing a multinomial (nominal) response. Statistical models for scenarios where the observations of a nominal response can be considered independent have an extensive literature, such as the baseline-category logit models. However, situations where this assumption is violated (as in longitudinal studies) require specific models that take into consideration the dependence between observations. In this paper, a fairly new extension of the generalized estimating equations is applied to analyze an experiment carried out to investigate the type of vegetation observed in an elephant grass pasture, according to some management conditions over time. This extension uses local odds ratios to explain the dependence among the categories of the outcome over the repeated measurements. Two different structures were compared to describe this dependence, and the Wald test was used to select the significant variables. Further, we built confidence intervals for the predicted probabilities of occurrence of each category and assessed the results comparing observed/predicted values and using the diagnostic analysis. The results allowed to conclude that there are various significant effects for treatments and for time. The structure of local odds ratio also proved as a good way to describe the dependence between categorical responses over time.
Keywords:
type of vegetation; longitudinal multinomial data; generalized estimating equations; local odds ratio
Introduction
Understanding forage plant growth and colonization abilities (horizontal and vertical distribution of plant organs and parts) is important to provide a sound basis for planning and idealizing grazing management practices that ensure pasture productivity and persistence. For tall-tufted tussock forming species like elephant grass (Pennisetum purpureum Schum. cv. Napier), horizontal distribution is especially important because it is related to efficiency of carbon (energy) uptake (Ryel et al., 1994Ryel, R.J.; Beyschlag, W.; Caldwel, L.M.M. 1994. Light field heterogeneity among tussock grasses: theoretical considerations of light harvesting and seedling establishment in tussocks and uniform tiller distributions. Oecologia 98: 241-246.), competitive ability and stability of plant population and pasture productivity (Pereira et al., 2015aPereira, L.E.T.; Paiva, A.J.; Geremia, E.V.; Silva, S.C. 2015a. Grazing management and tussock distribution in elephant grass. Grass and Forage Science 70: 406-417.,bPereira, L.E.T.; Paiva, A.J.; Geremia, E.V.; Silva, S.C. 2015b. Regrowth patterns of elephant grass (Pennisetum purpureum Schum) subjected to strategies of intermittent stocking management. Grass and Forage Science 70: 195-204.).
In many research fields, the analysis of categorical data is present, including agriculture. A categorical variable has its measurement scale formed by a set of categories (Agresti, 2007Agresti, A. 2007. An Introduction to Categorical Data Analysis. 2ed. John Wiley, Hoboken, NJ, USA.), for example, the type of vegetation present on an area. This type of variable can be classified as binary (2 categories) or polytomous (3 or more) and as ordinal and nominal. An ordinal categorical variable means that its categories have a natural order, while the nominal category has no order between the levels. This paper focuses on the nominal case for polytomous variables and the generalized linear models framework is commonly used to analyze these data. However, in some cases, the studies are carried out in such a way that several measurements are taken from the same subject (or sample unit). When measurements are taken over time, these studies generate data sets known as longitudinal data and it is necessary to consider some correlation measure (Diggle et al., 2002Diggle, P.J.; Heagerty, P.J.; Liang, K.Y.; Zeger, S.L. 2002. Analysis of Longitudinal Data. Oxford University Press, New York, NY, USA.).
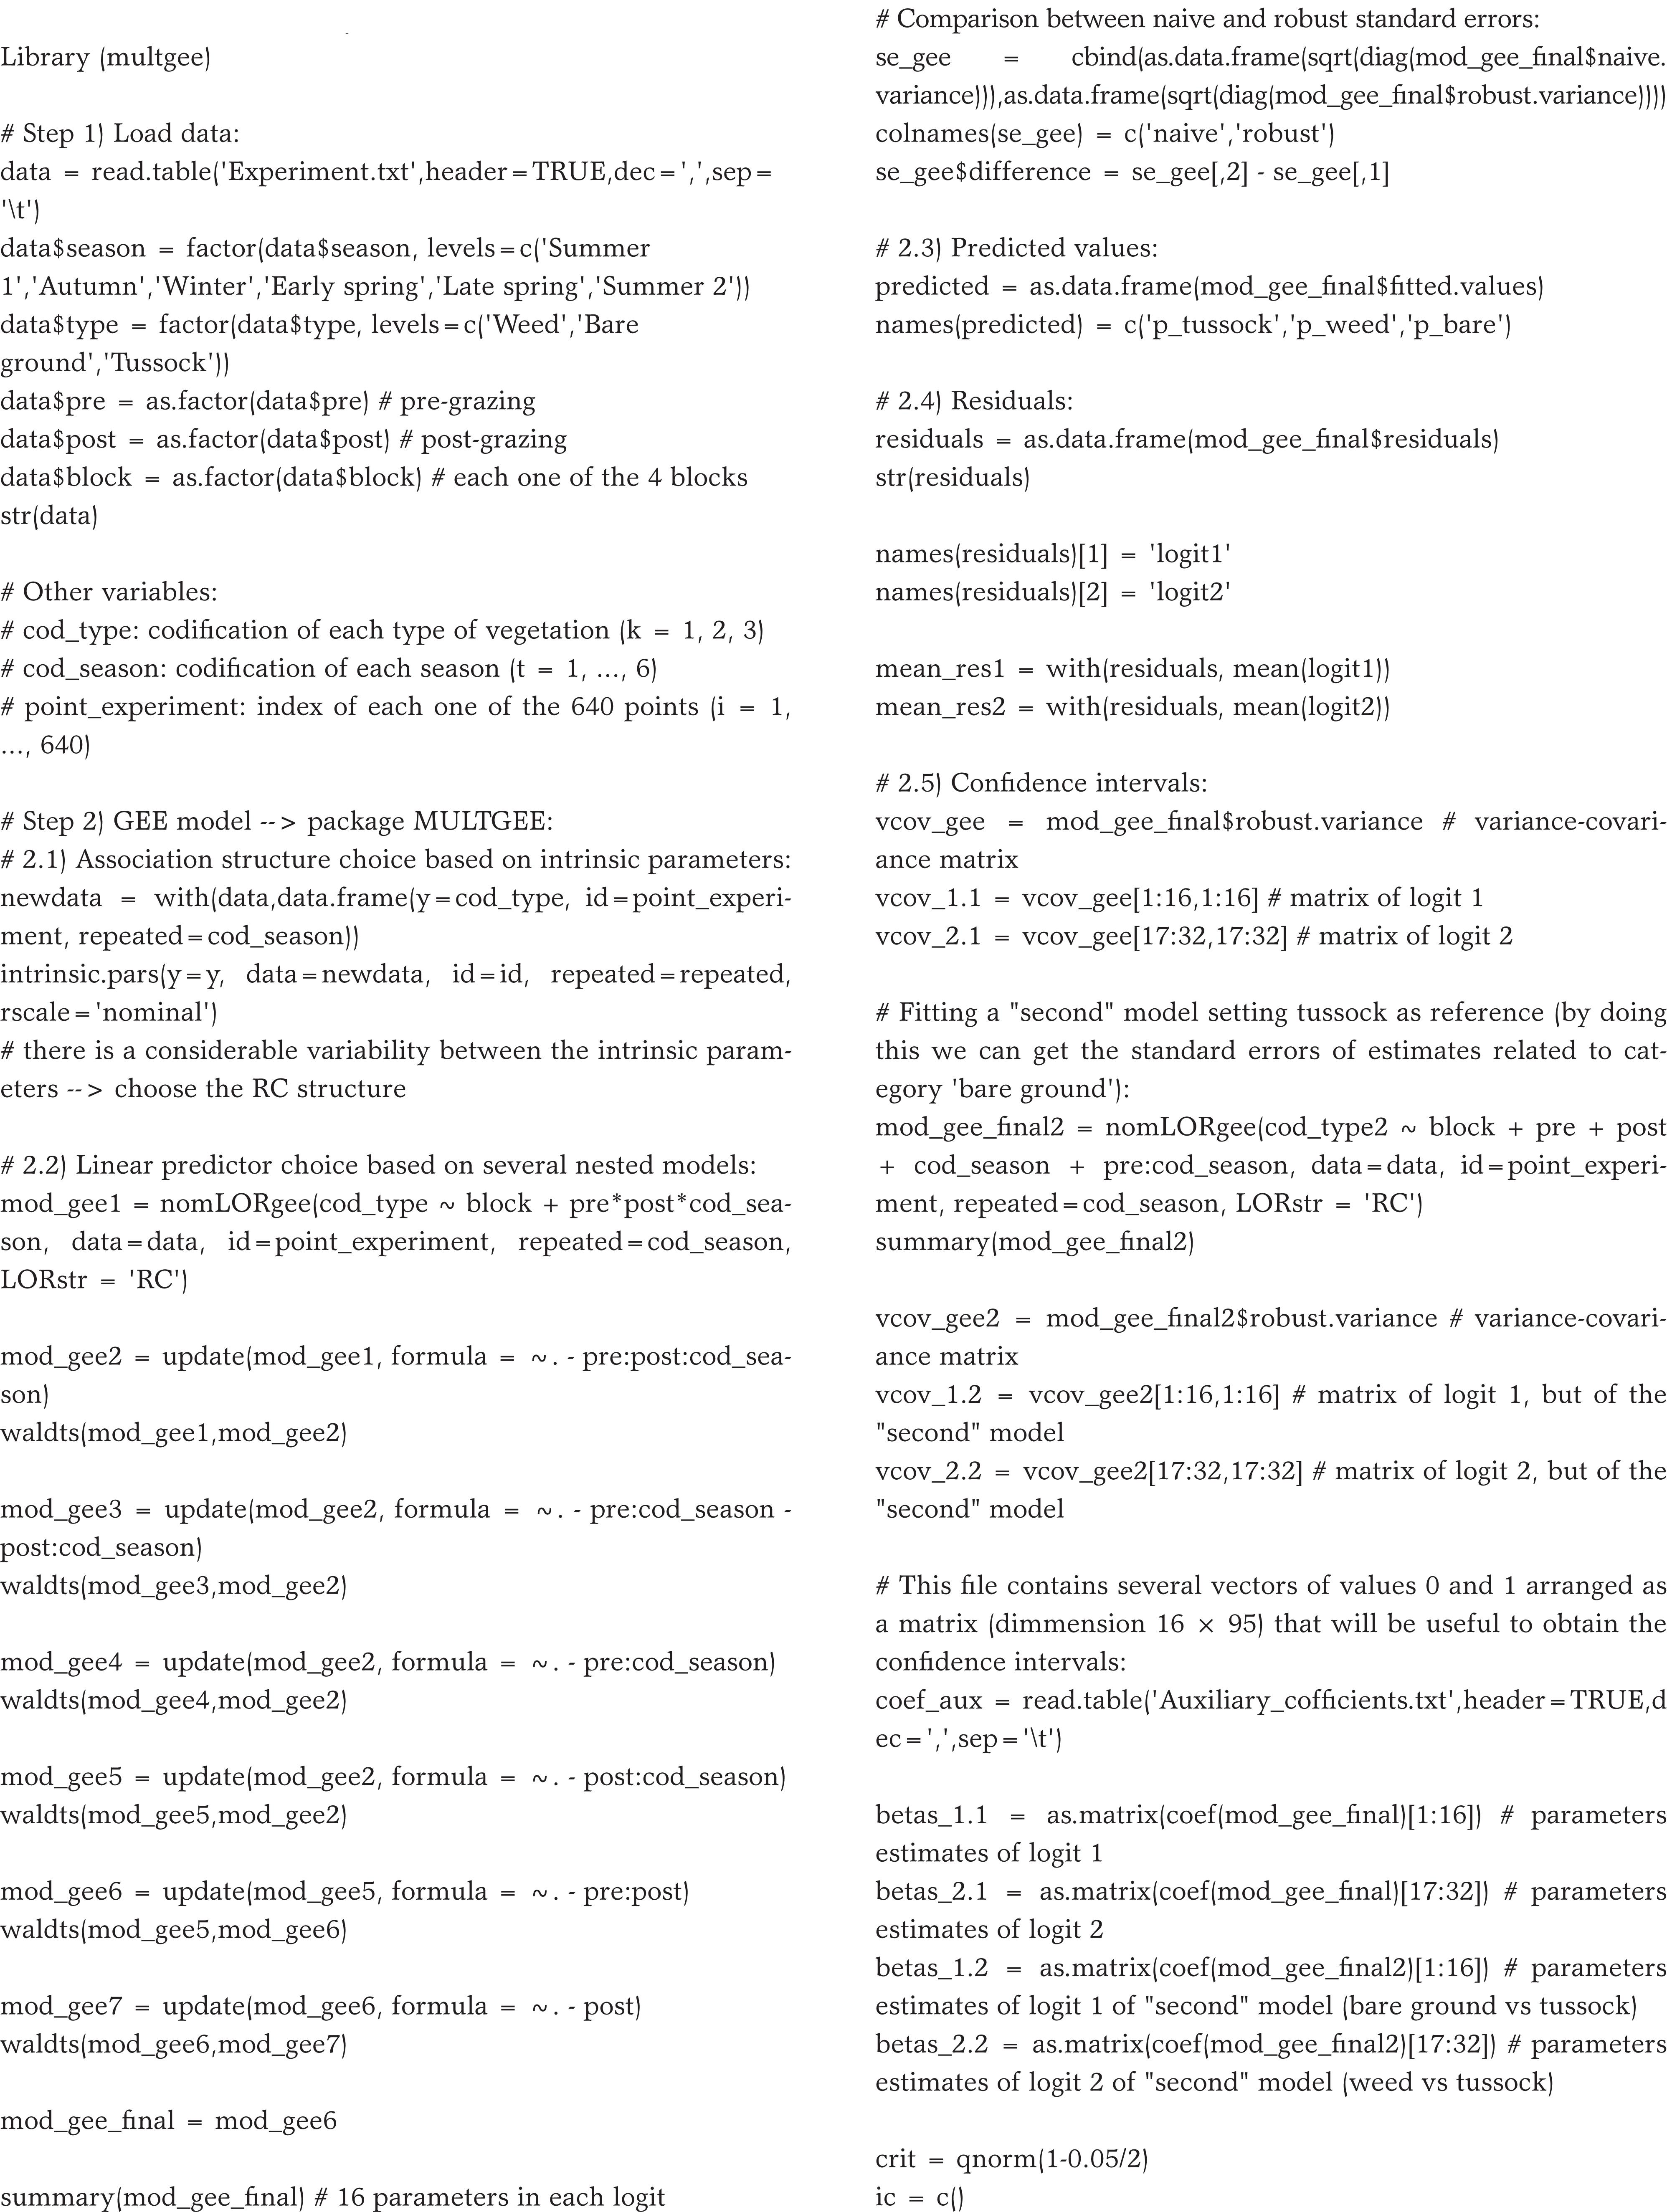
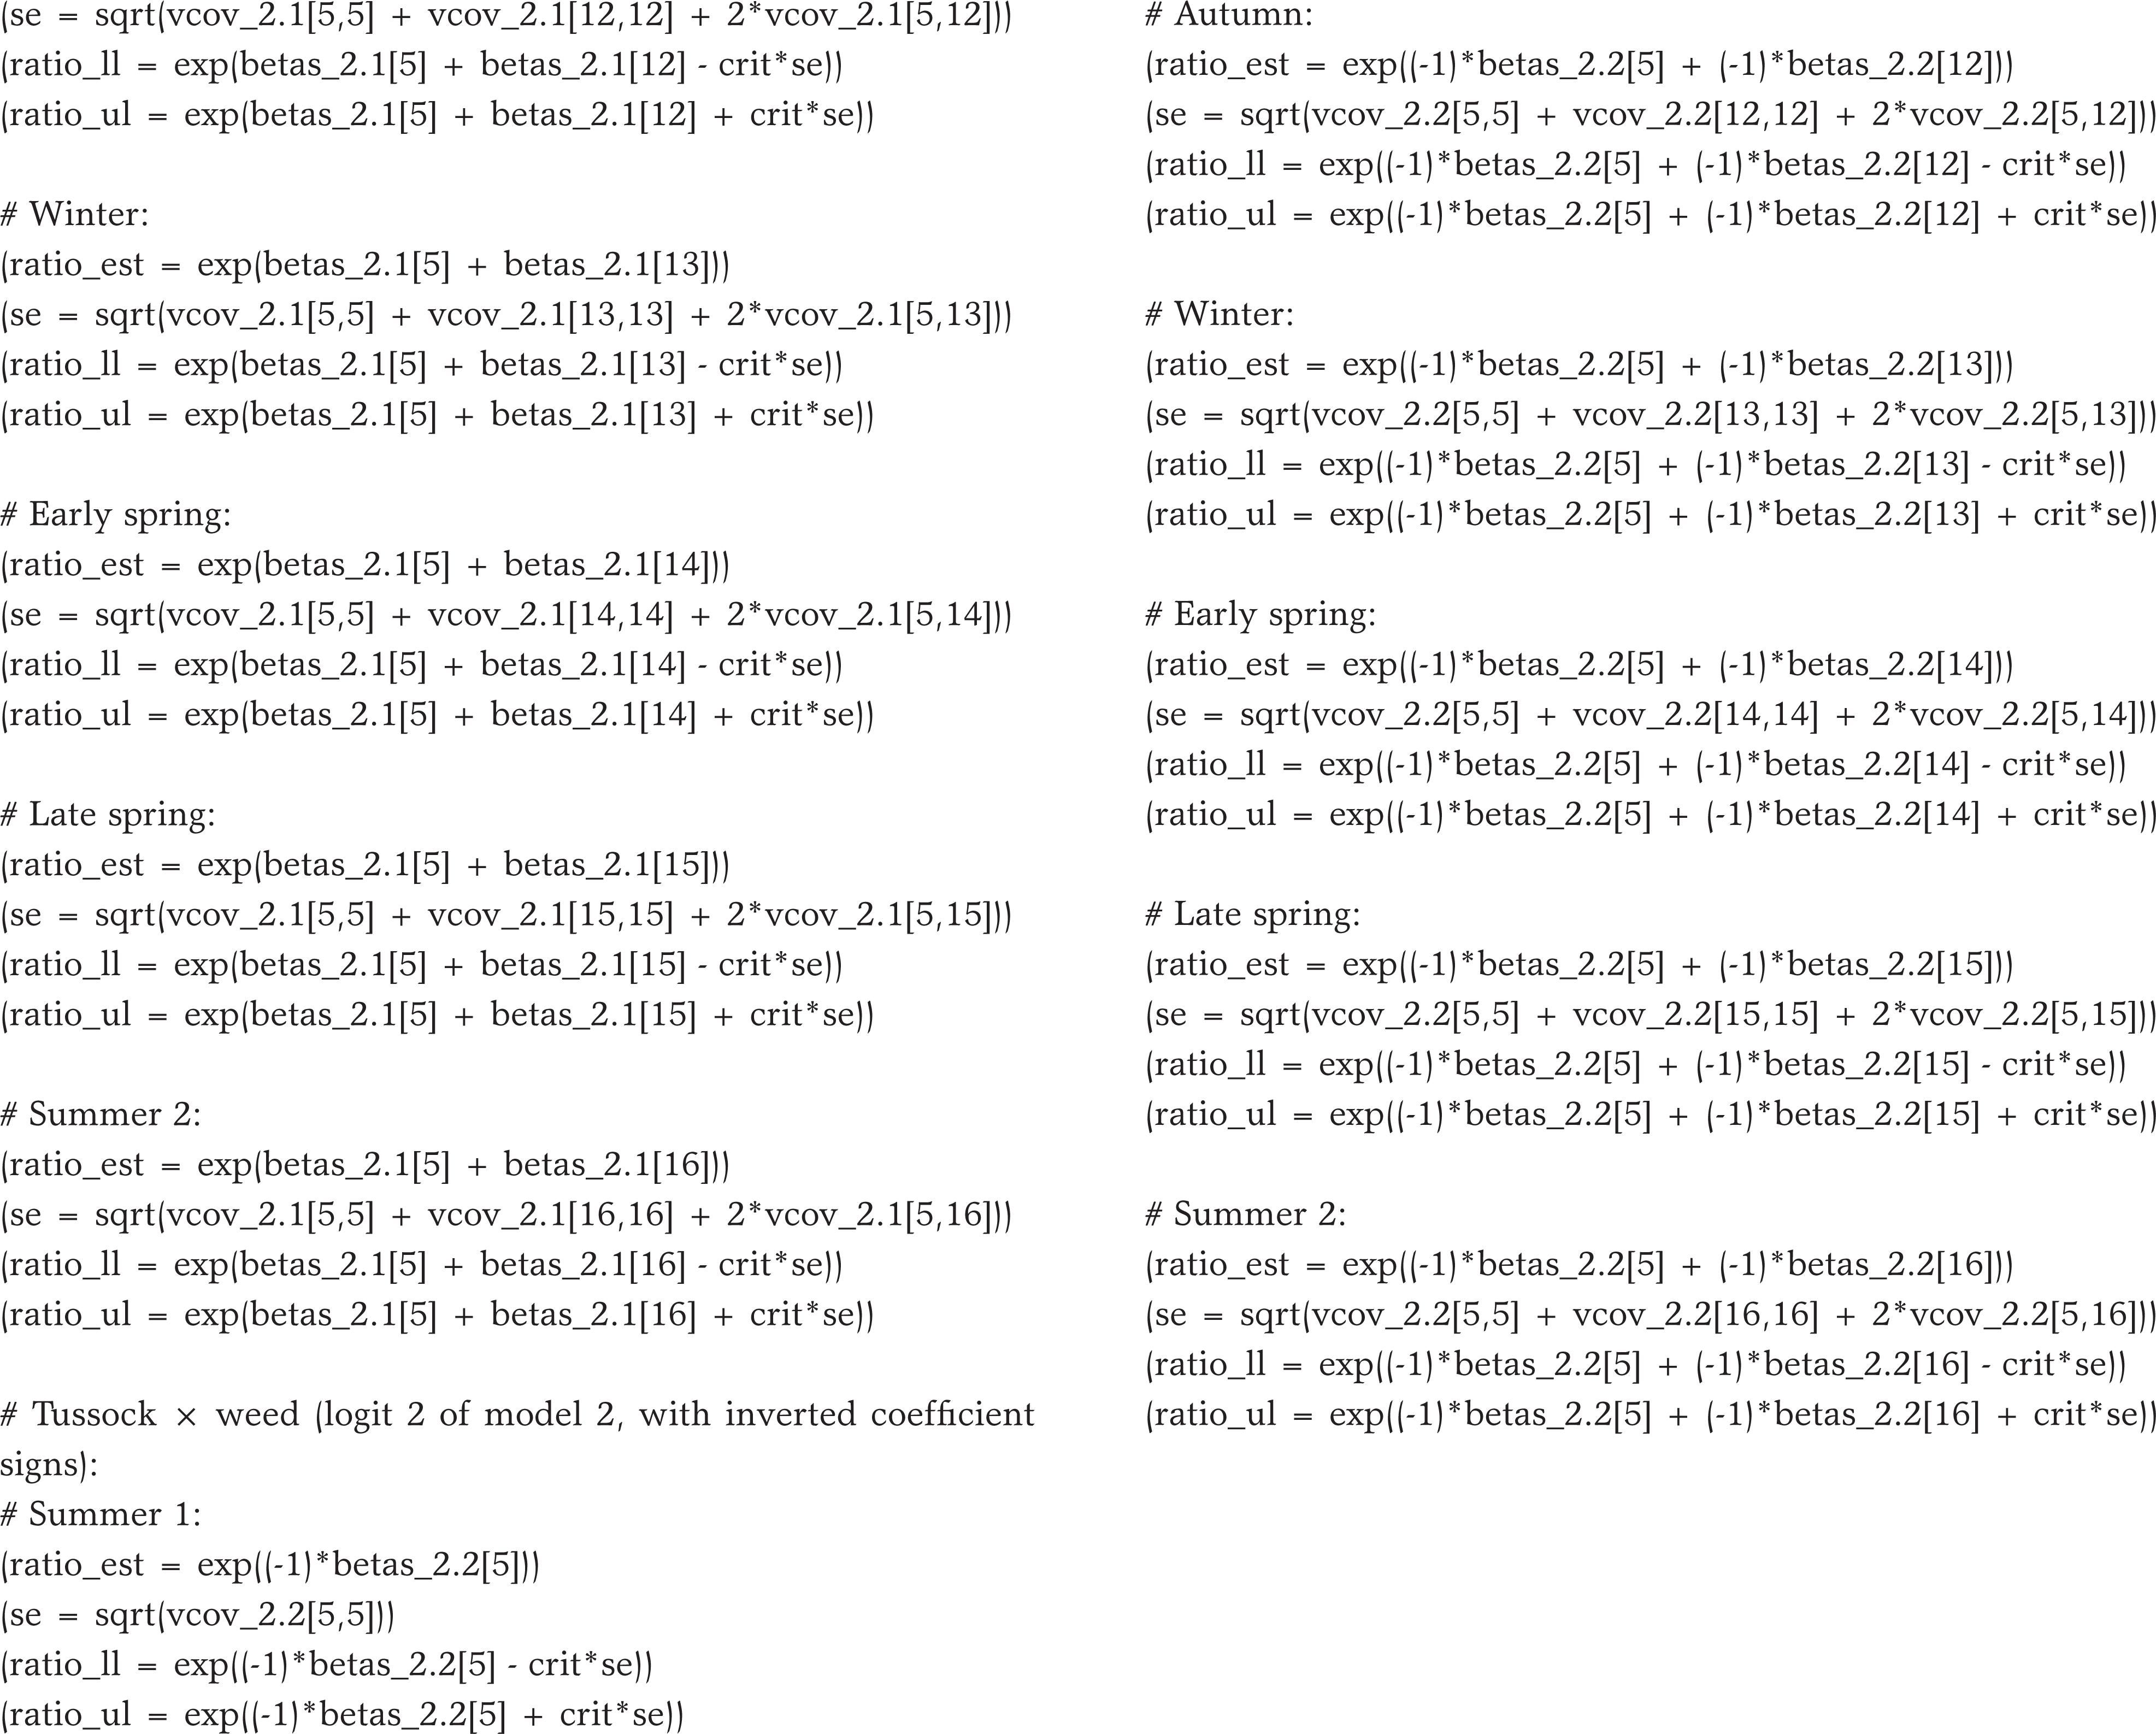
Among the several available approaches in the literature (Diggle et al., 2002Diggle, P.J.; Heagerty, P.J.; Liang, K.Y.; Zeger, S.L. 2002. Analysis of Longitudinal Data. Oxford University Press, New York, NY, USA.; Pinheiro and Bates, 2000Pinheiro, J.C.; Bates, D.M. 2000. Mixed-Effects Models in S and S-PLUS. Springer, New York, NY, USA.; Verbeke and Molenberghs, 2000Verbeke, G.; Molenberghs, G. 2000. Linear Mixed Models for Longitudinal Data. Springer, New York, NY, USA.), the generalized estimating equations (GEE) consist in a useful methodology for longitudinal data to consider the dependence between the observations (Liang and Zeger, 1986Liang, K.Y.; Zeger, S.L. 1986. Longitudinal data analysis using generalized linear models. Biometrika 73: 13-22.). However, when the response variable is multinomial, the original GEE approach does not apply and Lipsitz et al. (1994)Lipsitz, S.R.; Kim, K.; Zhao, L.P. 1994. Analysis of repeated categorical data using generalized estimating equations. Statistics in Medicine 13: 1149-1163. and Touloumis et al. (2013)Touloumis, A.; Agresti, A.; Kateri, M. 2013. GEE for multinomial responses using a local odds ratios parameterization. Biometrics 69: 633-640. have developed some extensions. The objective of this paper was to describe some aspects of the GEE methodology and show an application in agriculture, where, in general, this methodology is not usual. Confidence intervals are not commonly used in this type of model thus, as a contribution, in this paper they are obtained for each of the response categories. Finally, the appendix Appendix presents the R code used in the analysis.
Materials and Methods
The data used in this work are results from an experiment carried out in Piracicaba, São Paulo State, Brazil, on an elephant grass pasture (Pennisetum purpureum Schum. cv. Napier) grazed by dairy cows (Pereira et al., 2015aPereira, L.E.T.; Paiva, A.J.; Geremia, E.V.; Silva, S.C. 2015a. Grazing management and tussock distribution in elephant grass. Grass and Forage Science 70: 406-417.,bPereira, L.E.T.; Paiva, A.J.; Geremia, E.V.; Silva, S.C. 2015b. Regrowth patterns of elephant grass (Pennisetum purpureum Schum) subjected to strategies of intermittent stocking management. Grass and Forage Science 70: 195-204.). It is a complete randomized block design with the treatments allocated according to a 2 × 2 factorial arrangement, where treatments are the combinations of two pre-grazing conditions (95 % and maximum (98 %) canopy light interception during regrowth) and two postgrazing heights (35 and 45 cm). The experiment was carried out from Jan 2011 until Apr 2012, period classified into six seasons presented in Table 1.
The response analyzed in the study is the type of vegetation observed in the field, which can be tussocks, bare ground and weeds. Forty (40) points were observed in each one of the four paddocks in each block (Figure 1). Since there are always 40 points observed in each paddock, we can analyze the proportions of each type of vegetation under the total, characterizing a multinomial outcome with three levels. There are 40 × 16 = 640 points per season, but in the early spring, one of the paddocks was affected by climate conditions and thus the total number of observations was N = 640 × 6 × 40 = 3800. Furthermore, there might be a spatial correlation between the observations, but it is not the main focus of this paper and the spatial coordinates of the points were not available.
Logit models
For independent observations of a multinomial outcome, the baseline logit models (also known as baseline-category logit models) are a well-known theory in the literature. These models are an extension of logistic regression models used to model binary outcomes (Agresti, 2002Agresti, A. 2002. Categorical Data Analysis. 2ed. John Wiley, Hoboken, NJ, USA.; Agresti, 2007Agresti, A. 2007. An Introduction to Categorical Data Analysis. 2ed. John Wiley, Hoboken, NJ, USA.; Dobson, 2008Dobson, A.J. 2008. An Introduction to Generalized Linear Models. 2ed. Chapman and Hall, New York, NY, USA.). Denoting the categories by (k = 1, …, K), the model pairs each category with a baseline one and is defined as
where: ηk denotes the linear predictor, x is the design matrix and β is a vector of covariates, according to the generalized linear models (GLM) theory (Nelder and Wedderburn, 1972Nelder, J.A.; Wedderburn, R.W.M. 1972. Generalized linear models. Journal of the Royal Statistical Society Series A 135: 370-384.). The index k in the linear predictor indicates that each one of the (k – 1) ogits has separate parameters. Clearly, when k = 2, the model reduces to an ordinary logistic regression for binary outcomes. However, as this model is part of the GLM theory, it is suitable only when observations are independent from each other, requiring modifications to handle the temporal dependence.
Generalized estimating equations using a local odds ratios approach
A very important extension of GLMs for longitudinal data, the generalized estimating equations (GEE) briefly consist of an approach where the regression and within-subject correlation are modelled separately, i.e., besides the regression parameters β, we need to specify a “working” correlation matrix Ri(α) consider the dependence between the repeated measurements, reducing the standard errors of the parameter estimates. The parameter estimation methods are based in quasi-likelihood methods, no more in full-likelihood methods, as in GLM (Liang and Zeger, 1986Liang, K.Y.; Zeger, S.L. 1986. Longitudinal data analysis using generalized linear models. Biometrika 73: 13-22.; Zeger and Liang, 1992Zeger, S.L.; Liang, K.Y. 1992. An overview of methods for the analysis of longitudinal data. Statistics in Medicine 11: 1825-1839.).
Even though this original approach can be used for discrete and continuous outcomes, it does not apply for the multinomial case (only for the binary) and Lipsitz et al. (1994)Lipsitz, S.R.; Kim, K.; Zhao, L.P. 1994. Analysis of repeated categorical data using generalized estimating equations. Statistics in Medicine 13: 1149-1163. extended it to handle this type of data. This extension seems to be a very useful tool, but it is implemented in statistical software only for the ordinal case. Thus, as the focus of this paper is the nominal scenario, no more details will be discussed here and the referred reference can be used.
Another extension of the original GEE approach that deals with nominal and ordinal responses, in some aspects very similar to Lipsitz et al. (1994)Lipsitz, S.R.; Kim, K.; Zhao, L.P. 1994. Analysis of repeated categorical data using generalized estimating equations. Statistics in Medicine 13: 1149-1163., was proposed by Touloumis et al. (2013)Touloumis, A.; Agresti, A.; Kateri, M. 2013. GEE for multinomial responses using a local odds ratios parameterization. Biometrics 69: 633-640.. This approach uses local odds ratios to describe the association between the response categories across the repeated measurements. It is implemented in the R package multgee and further details will be discussed later.
Introducing notes used by Lipsitz et al. (1994)Lipsitz, S.R.; Kim, K.; Zhao, L.P. 1994. Analysis of repeated categorical data using generalized estimating equations. Statistics in Medicine 13: 1149-1163. and Touloumis et al. (2013)Touloumis, A.; Agresti, A.; Kateri, M. 2013. GEE for multinomial responses using a local odds ratios parameterization. Biometrics 69: 633-640., Y is the categorized response with K levels (k = 1, …, K), K > 2. K defines indicator variables Yitk = I(Yit = k) showing if the i-th subject presented category k at time t (t = 1, …, Ti). These indicator variables can be converted into a (K – 1) × 1 vector of responses Yit = [Yit1, Yit2, …, Yit(K-1)]’ and Yi, = [Yi1, Yi2, … YiTi]’. The marginal distribution of Yit is multinomial
where: πitk the probability of occurrence of category k at time t and denotes the T1(K – 1) × p matrix of covariate values for subject i. The probabilities of interest πitk are also converted into a vector πit = [πit1, … πit(K-1)]’. The marginal expected vector E[Yit‖xi]=πit, is modelled by
where: the choice of link vector g is the baseline-category logit model for the multinomial case.
Briefly, the association structure is described by the vector of local odds ratios α = [ψ1121, …,ψ112(K-1)’ …,ψ(T — 1)1T1 …, ψ(T — 1)(K — 1)T(K — 1)]’ These local odds ratios ψtkt’k’ are taken at the cutpoints (k, k’) at the marginalized contingency table for the time pair (t, t’). A generalized version of the rows and columns (RC) model (Becker and Clogg, 1989; Goodman, 1985Goodman, L.A. 1985. The analysis of cross-classified data having ordered and or unordered categories: association models, correlation models, and asymmetry models for contingency tables with or without missing entries. Annals of Statistics 13: 10-69.) is fitted and, under this model, the local odds ratios satisfy
where: the sets of parameters γ and ω are called intrinsic and score parameters, respectively. All these odds ratios may be presented as a matrix of dimensions T(K — 1) × T(K — 1):
Each block has dimension (K — 1) × (K — 1) and each element (k, k’) is the local odds ratio estimate . This matrix can assume two different types representing the two association structures available for the multinomial case (Touloumis et al., 2013Touloumis, A.; Agresti, A.; Kateri, M. 2013. GEE for multinomial responses using a local odds ratios parameterization. Biometrics 69: 633-640.): i) Time exchangeable: under this simpler structure the local odds ratios are simplified to ln (ψtkt’k’) = γ(ωk — ωk +1) (ωk, — ωk’ +1), which does not assume any time dependency and implies that the matrix blocks are equal. ii) RC structure allows different odds ratios between the time pairs, i.e., there is time dependency. In this case, we have .
As described by Touloumis et al. (2013)Touloumis, A.; Agresti, A.; Kateri, M. 2013. GEE for multinomial responses using a local odds ratios parameterization. Biometrics 69: 633-640., cases when the intrinsic parameters have a large variability should be analyzed with the RC structure; otherwise, if this variability is small, one should choose the time exchangeable structure.
The significance of effects of covariates can be assessed by the Wald statistical test described in Touloumis (2013)Touloumis, A.; Agresti, A.; Kateri, M. 2013. GEE for multinomial responses using a local odds ratios parameterization. Biometrics 69: 633-640.. Two nested models can be tested and the rejection of the null hypothesis of the Wald test suggests that the model with fewer parameters is more appropriate.
Overall, the procedure for parameters estimation is very similar to the original GEE approach from Liang and Zeger (1986)Liang, K.Y.; Zeger, S.L. 1986. Longitudinal data analysis using generalized linear models. Biometrika 73: 13-22., more details can be seen in Touloumis et al. (2013)Touloumis, A.; Agresti, A.; Kateri, M. 2013. GEE for multinomial responses using a local odds ratios parameterization. Biometrics 69: 633-640. and a description of the functions available in multgee package is available in Touloumis (2015).
Statistical model and procedures for selection
Here we present the methods used to select the statistical model. The procedure can be understood as two steps where the first is the choice of the association structure and the second one is the way that the covariates enter the linear predictor. This is done in this order because the parameter estimates depend on the selected association structure, according to Touloumis (2013)Touloumis, A.; Agresti, A.; Kateri, M. 2013. GEE for multinomial responses using a local odds ratios parameterization. Biometrics 69: 633-640..
The range of intrinsic parameter estimates under the RC structure can be assessed to select the association structure: if these estimates do not differ much, we select the time exchangeable structure; otherwise, we use the RC one.
Once the association structure is selected, we proceed to the second step and selection of the linear predictor. Here, as previously described, we can use the Wald test to compare several nested models, available in the multgee package. As the experiment analyzed here is a factorial in a complete randomized block design, we proposed the models presented in Table 2, where the pre and post-grazing factors were abbreviated as pre and post respectively. These models allow to test the effects of interactions and main effects of the covariates and the selected model will be presented later. Note: the first model considers all the interactions between pre, post and seasons.
Let πitk the probability of i-th point (i = 1, …, 640) be classified in the k-th category in season t. The model is given by two logits
The types of vegetation were ordered as tussock, weeds and bare ground in the model fitting (k = 1, 2, 3). Hence, the first logit relates tussocks and bare ground and the second logit is the relationship between weeds and bare ground. Furthermore, as an example for the first point (i = 1), Yi is given by Yi = [(1,0,0)’, (1,0,0)’, (0,0,1)’, (1,0,0)’, (0,1,0)’, (0,0,1)’]’ because the first point was observed as tussock, tussock, bare ground, tussock, weed and bare ground in each of the six seasons (t = 1, 2, …, 6).
Confidence intervals for the predicted probabilities can be obtained as described in Agresti (2002)Agresti, A. 2002. Categorical Data Analysis. 2ed. John Wiley, Hoboken, NJ, USA., as this model is an extension of a baseline logit model. The difference is that here, we use the robust standard errors to build the intervals instead of the naive ones. The assessment of the goodness-of-fit of the model is done with plots of residuals and comparisons between observed and predicted proportions.
Results and Discussion
Descriptive analysis
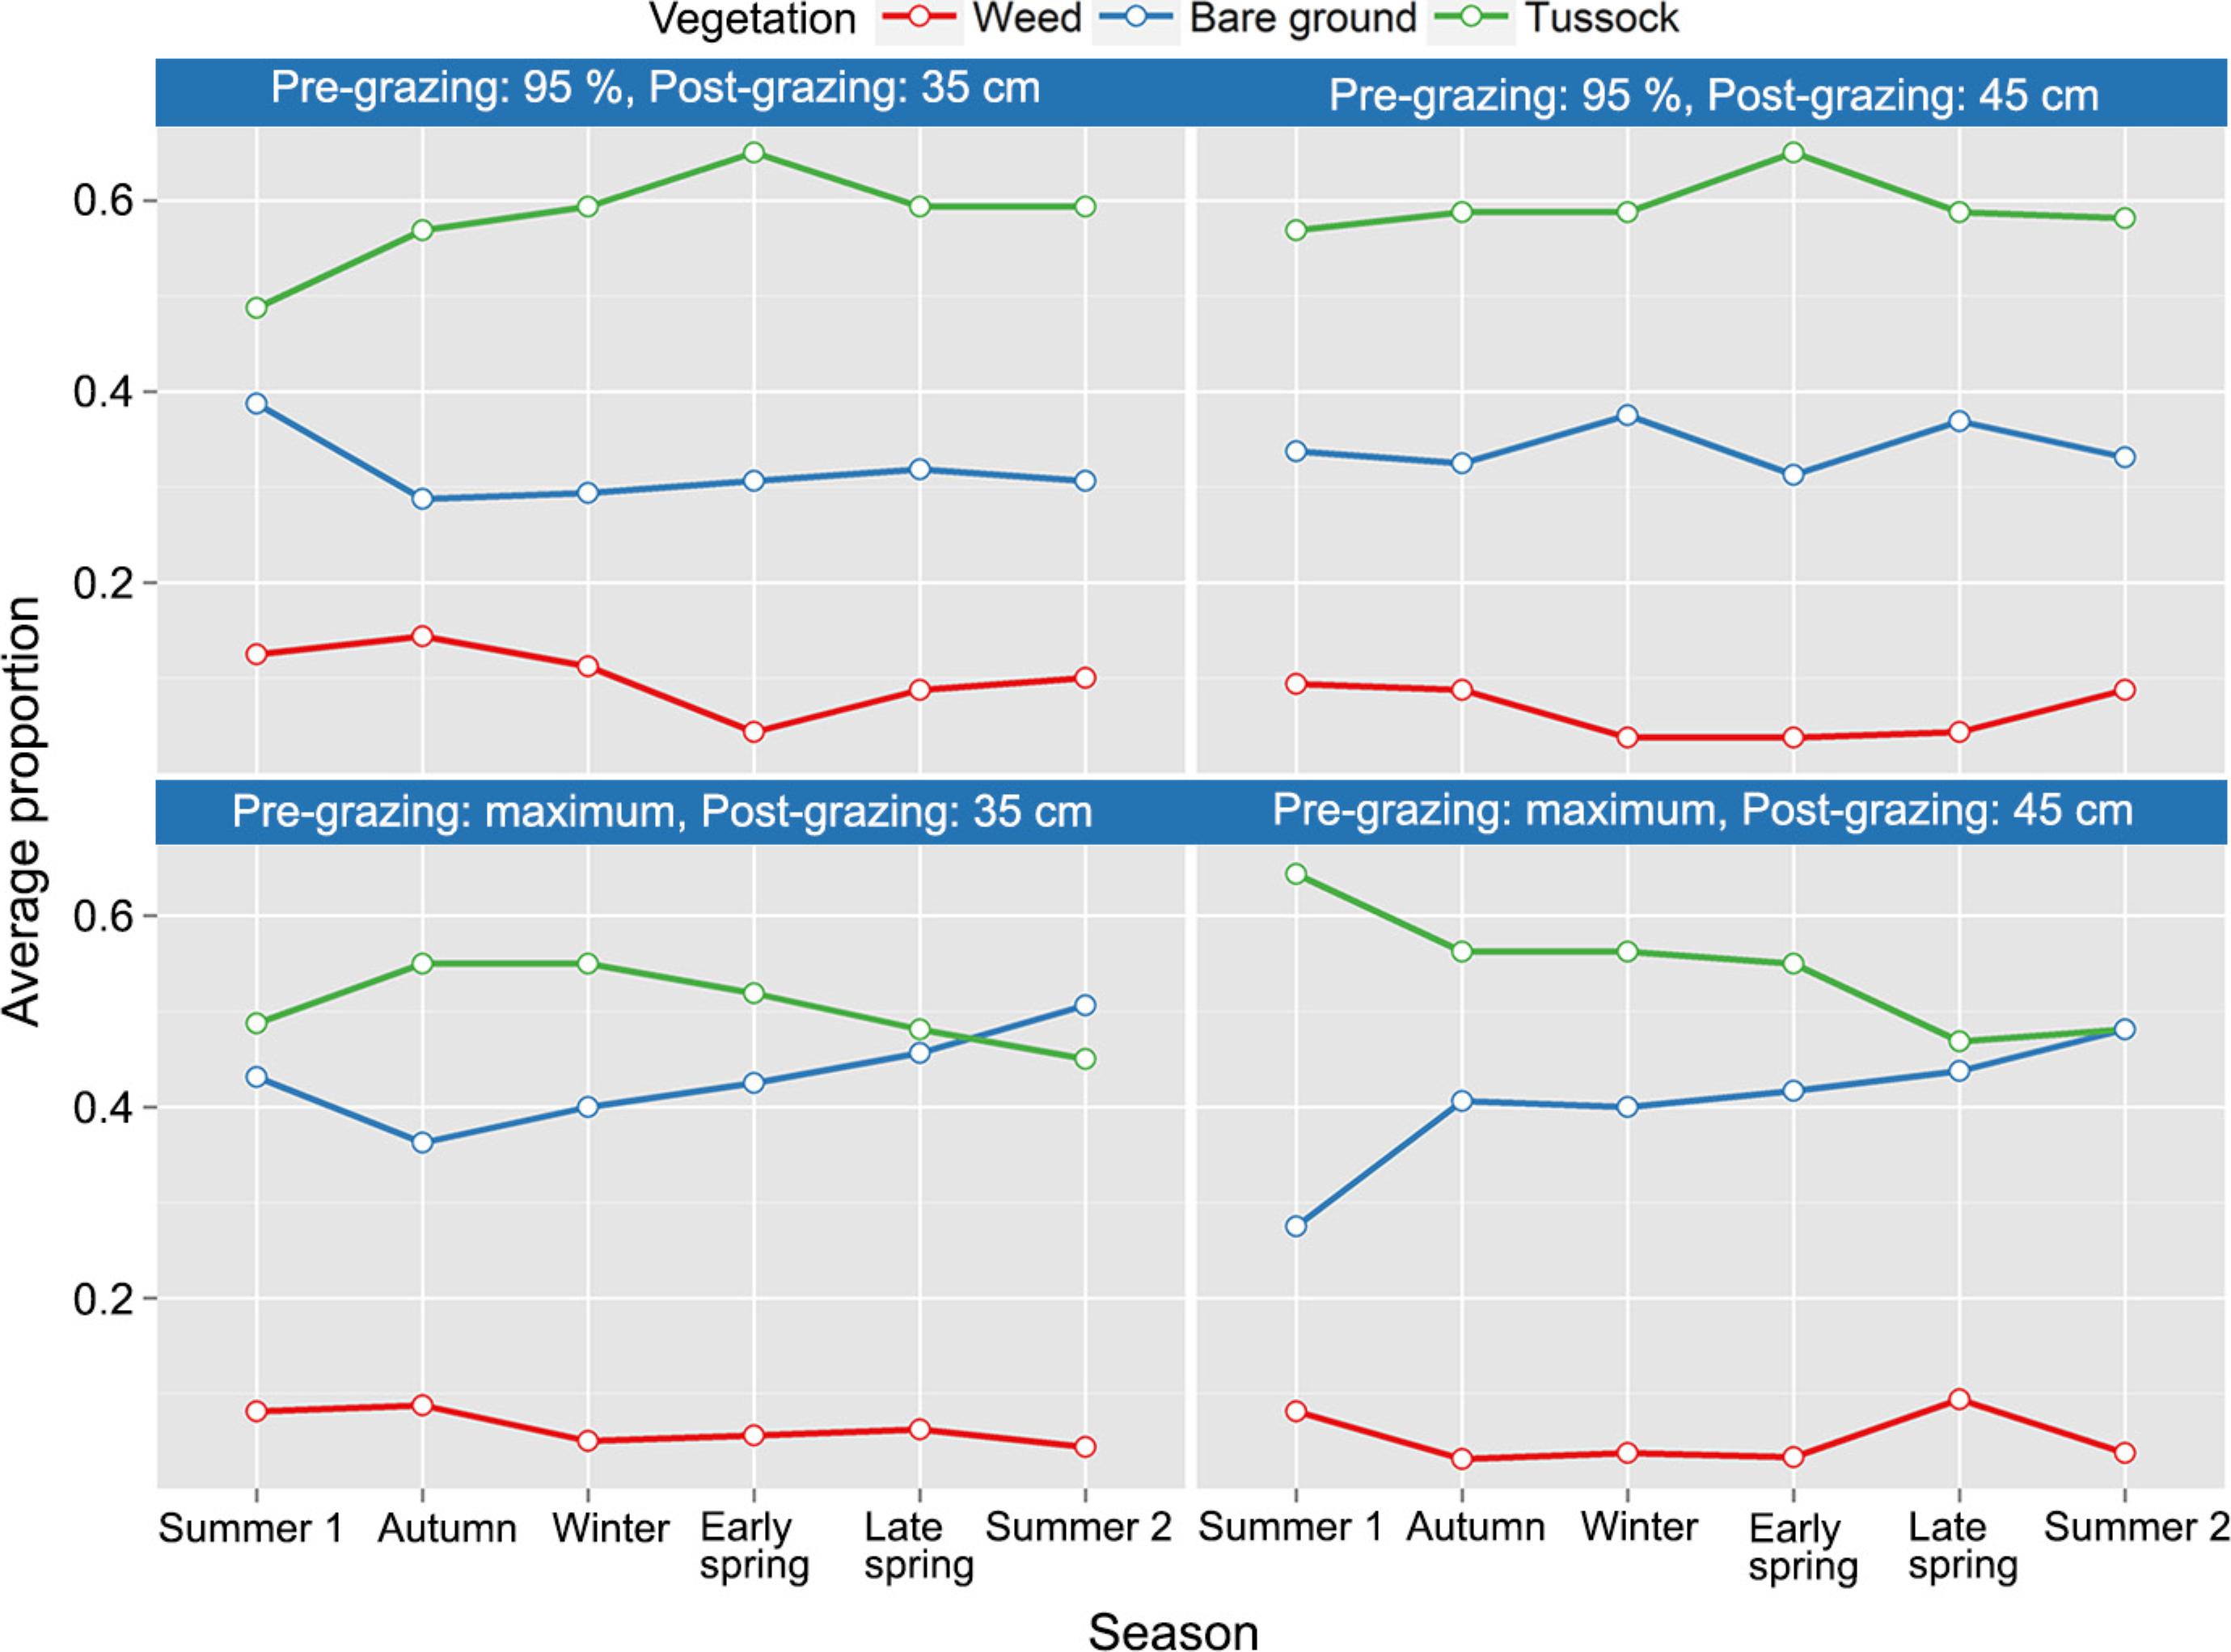
First, we present a description of the data. Figure 2 shows the proportions of each type of vegetation observed according to treatments and seasons. Tussocks are predominant over the other two types of vegetation, but when light interception is maximum, there are more places with bare ground and fewer with tussocks. Both the pre and post-grazing factors seem to influence the type of vegetation. Also, analyzing this graph, we can see a possible interaction between the pre-grazing factor and the seasons. For 95 % of light interception, the behavior of the trajectories of tussocks and bare ground is quite different for trajectories at maximum interception.
Statistical model
As the first step of the model building, the range of the estimates of intrinsic parameters (γ) varies from -0.0833 to 0.8438 indicating that the RC structure may be more appropriate in this case, as these estimates are not so close and cover positive and negative values.
Now we fit the models presented in Table 2 under the RC structure and compare them using the Wald test described above. According to Table 3, which displays the results of these comparisons, model 6 is selected to describe the data and considers the following effects: blocks, pre and post-grazing, season, and the interaction between pre-grazing and season already remarked in the descriptive analysis (Figure 1).
Therefore, the model can be written using dummy variables (first level as reference) as:
where: i= 1, …, 640 is the measurement point in the field, t is the season and k = 1, 2. Table 4 displays the parameters estimates with the standard errors shown between parentheses, and significant parameters at 5 % of significance are followed by the * symbol.
Estimates for the regression parameters of the fitted GEE model using local odds ratios to describe the association structure.
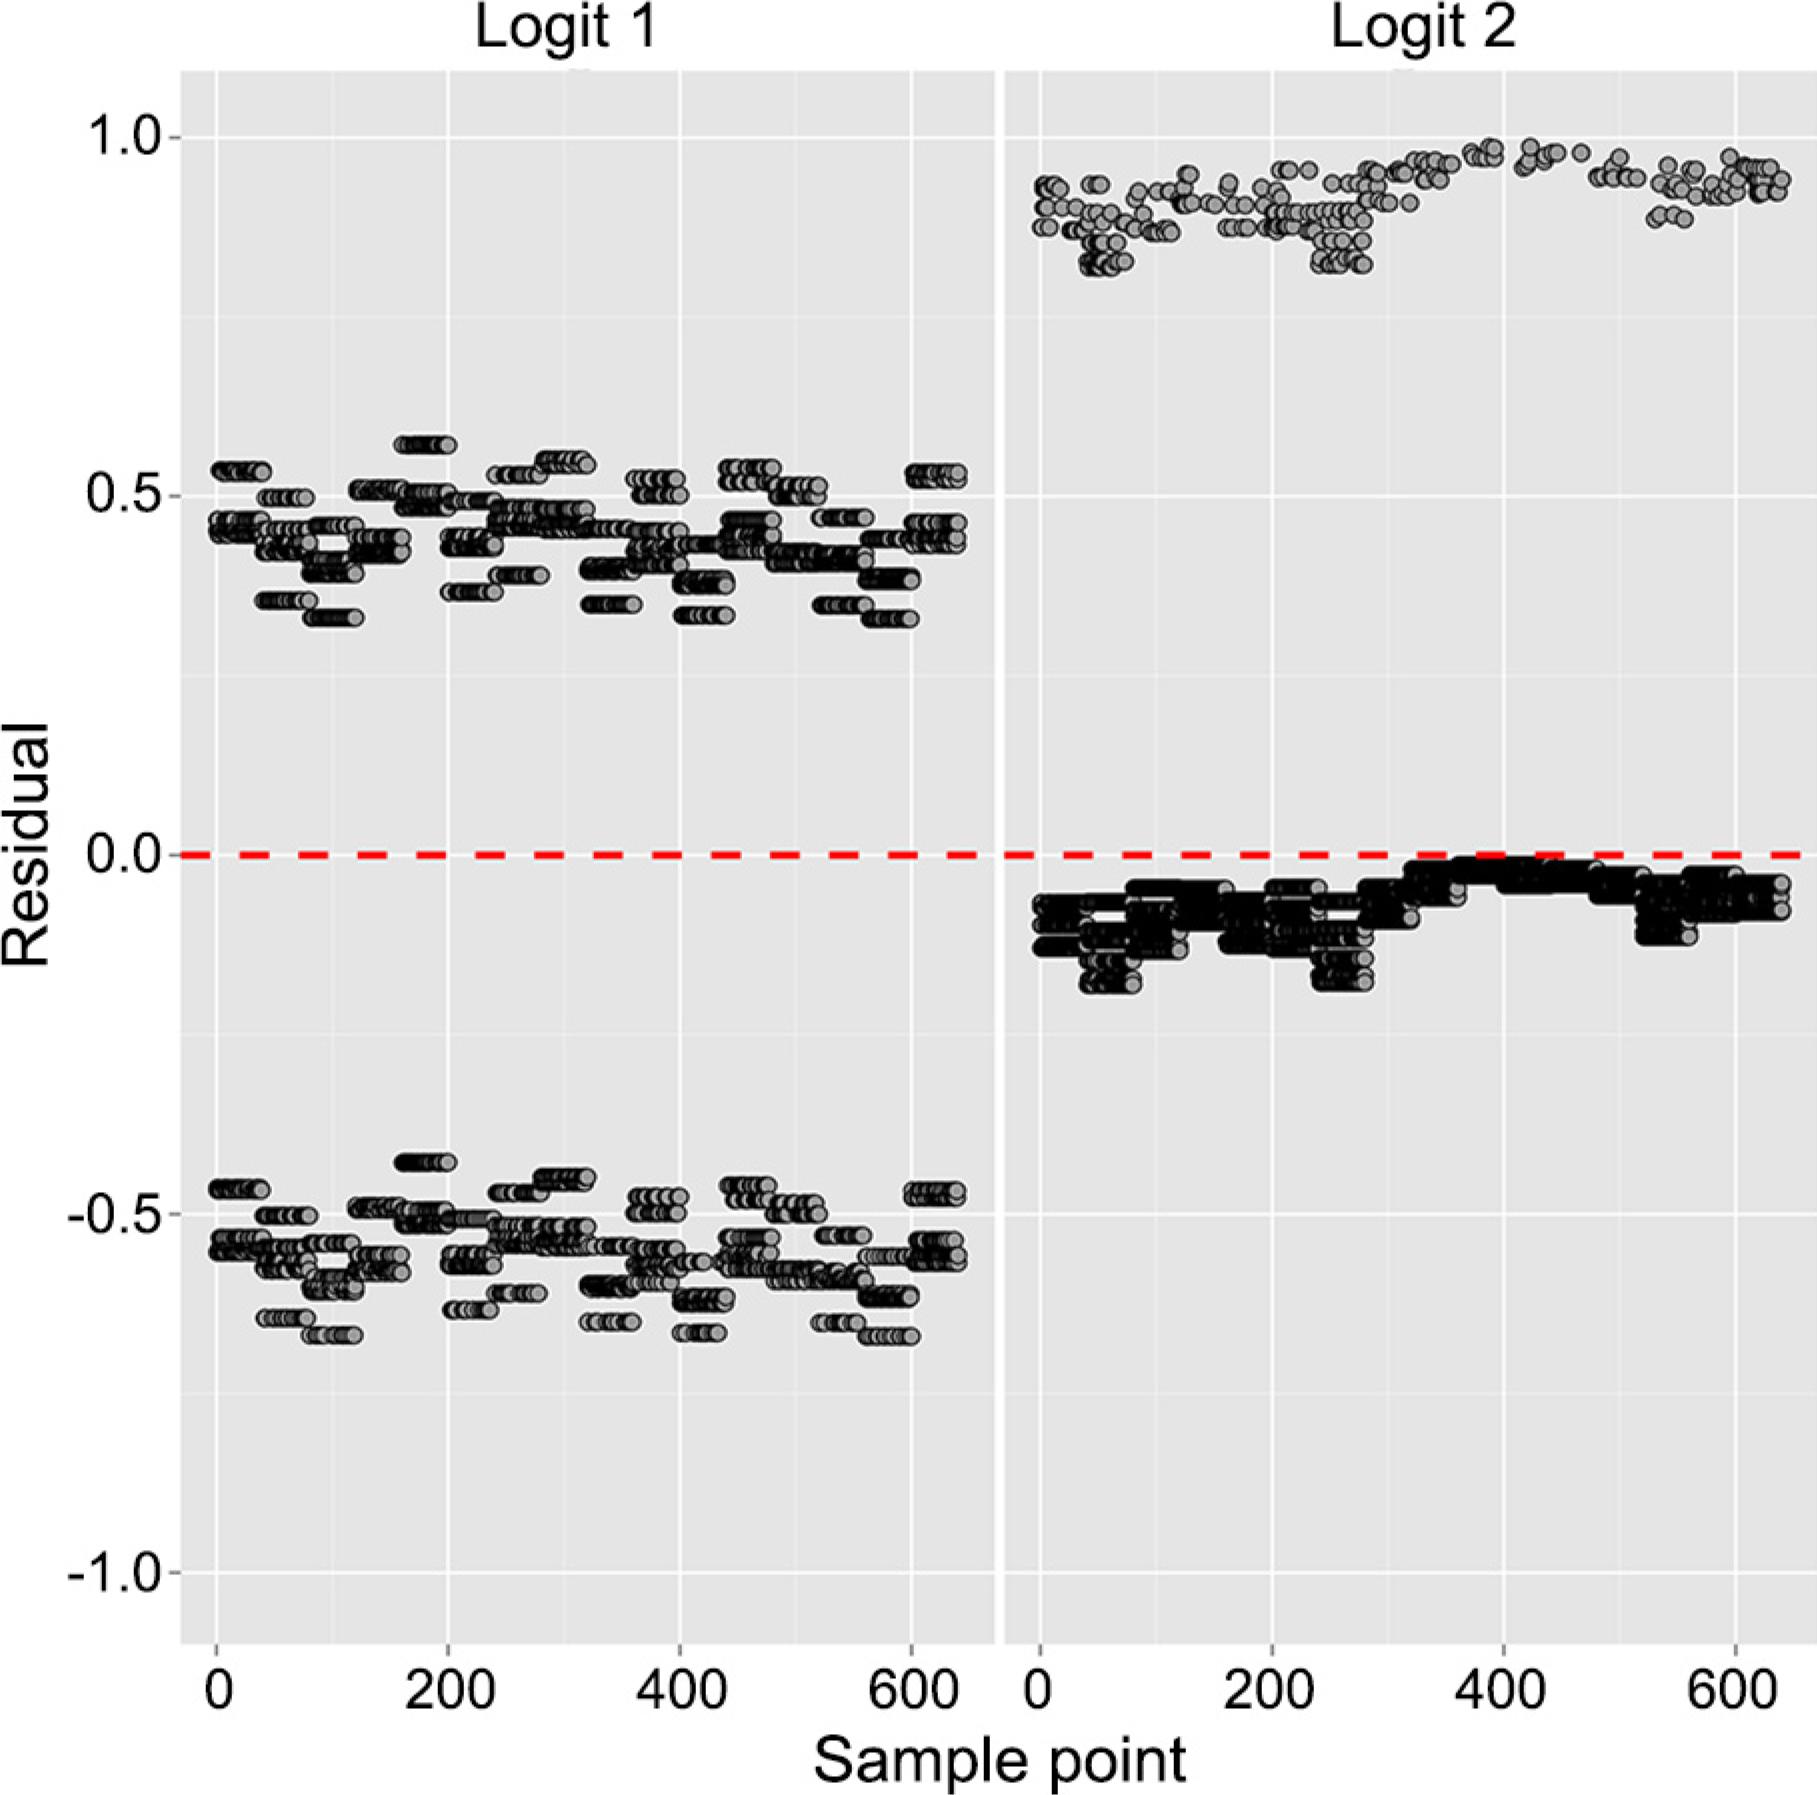
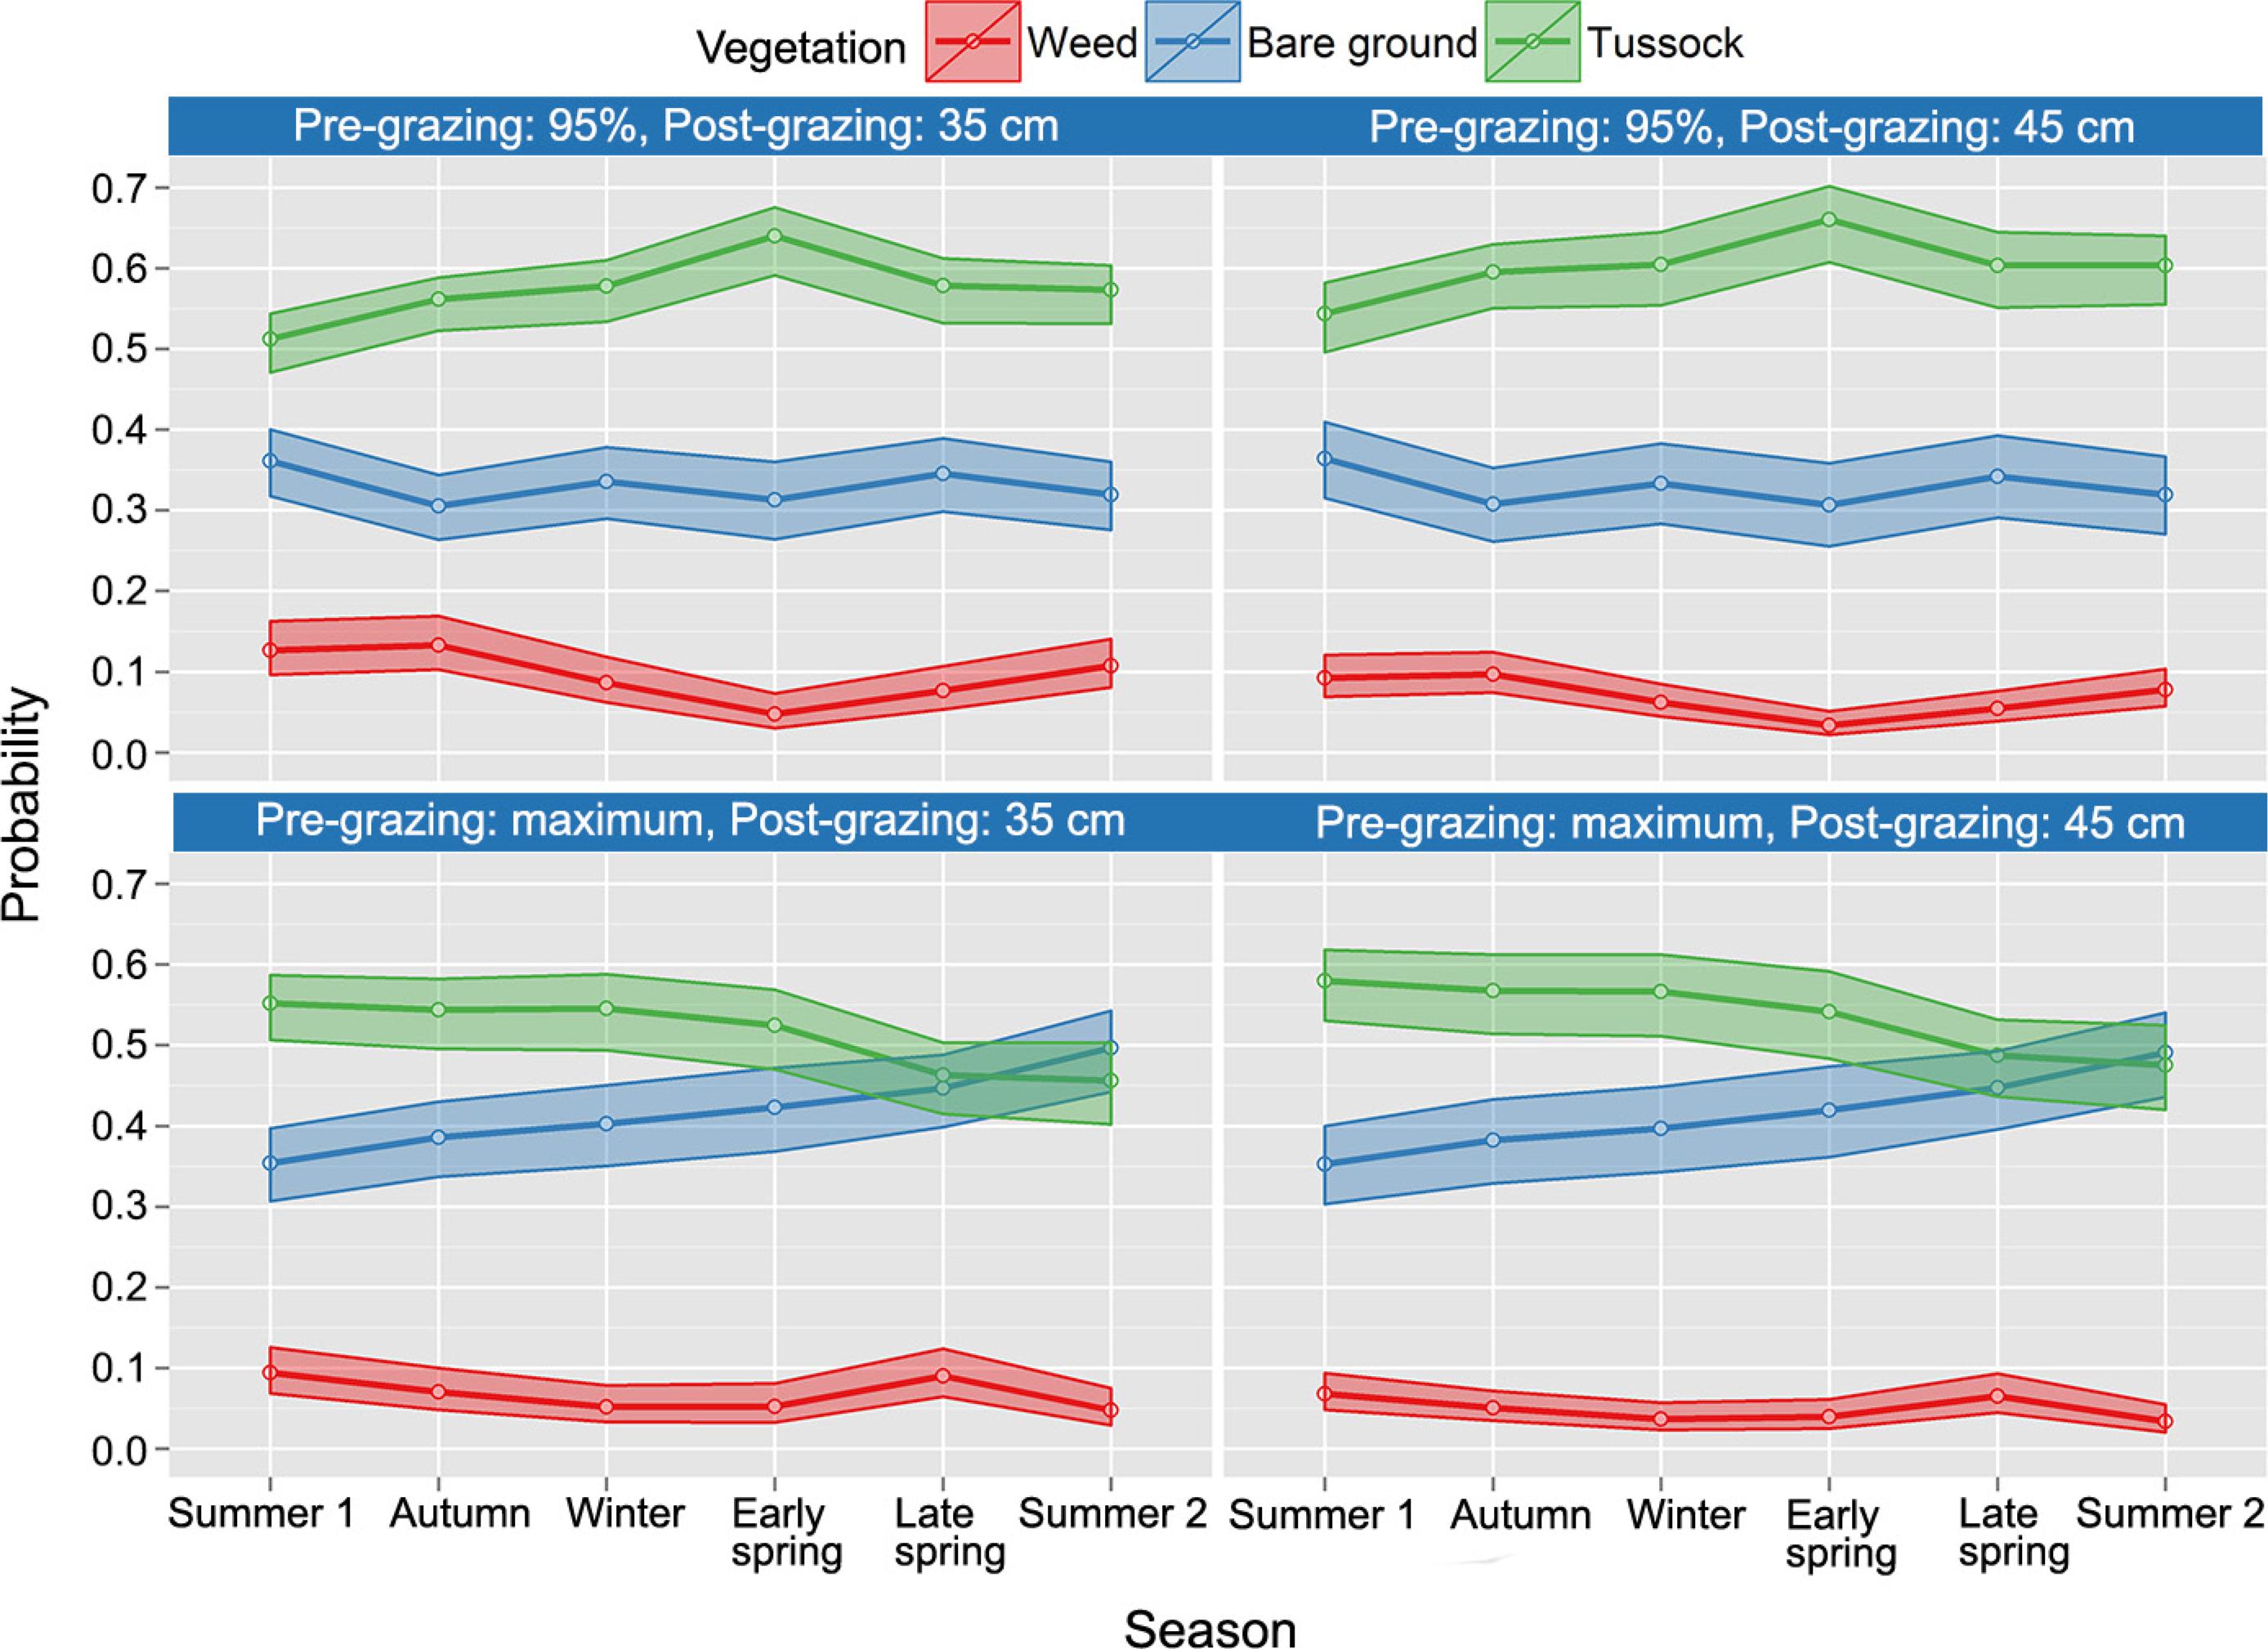
Figure 3 presents a very satisfactory plot of observed and predicted values. In Figure 4, the ordinary residuals of the model are displayed confirming a good fit (there are no outliers or patterns in residuals, which have their means close to 0 – red line). Confidence intervals for the predicted probabilities are presented in Figure 5.
Interpretations about the parameter estimates in baseline logit models are usually done by odds ratios. Among several interpretation that can be done (between blocks, seasons, pre and post-grazing), here the focus is only on the pre and post-grazing conditions, as they are of practical interest and are the main covariates. Table 5 summarizes the odds ratios and respective confidence intervals (CI) comparing places with maximum light interception versus 95 % (pre-grazing). Further, because of the interaction between these factors with seasons, there are different odds ratios for each season.
As an illustration, according to Table 5, the estimated odds of tussock is around 60 % of the odds of bare ground, for places where there is maximum light interception against those where there is 95 % in the early spring season:
Also, the estimated odds of tussock is 1.85 times greater than the odds of weeds, for places where there is maximum light interception against those with 95 %, in the autumn:
Similar interpretations are done for the rest of the table, remarking that confidence intervals containing the value 1 do not indicate significant differences.
Table 6 presents the estimated odds ratios estimates and respective 95 % confidence intervals comparing the levels of post-grazing (45 cm versus 35 cm). These results are simpler those in Table 5 because there is no interaction with seasons. As an example of interpretation, the estimated odds of weed are around 70 % of the odds of bare ground for places with height of 45 cm for 35 cm. Moreover, the estimated odds of tussocks is 1.46 times greater than the odds of weeds for places with height of 45 cm against 35 cm.
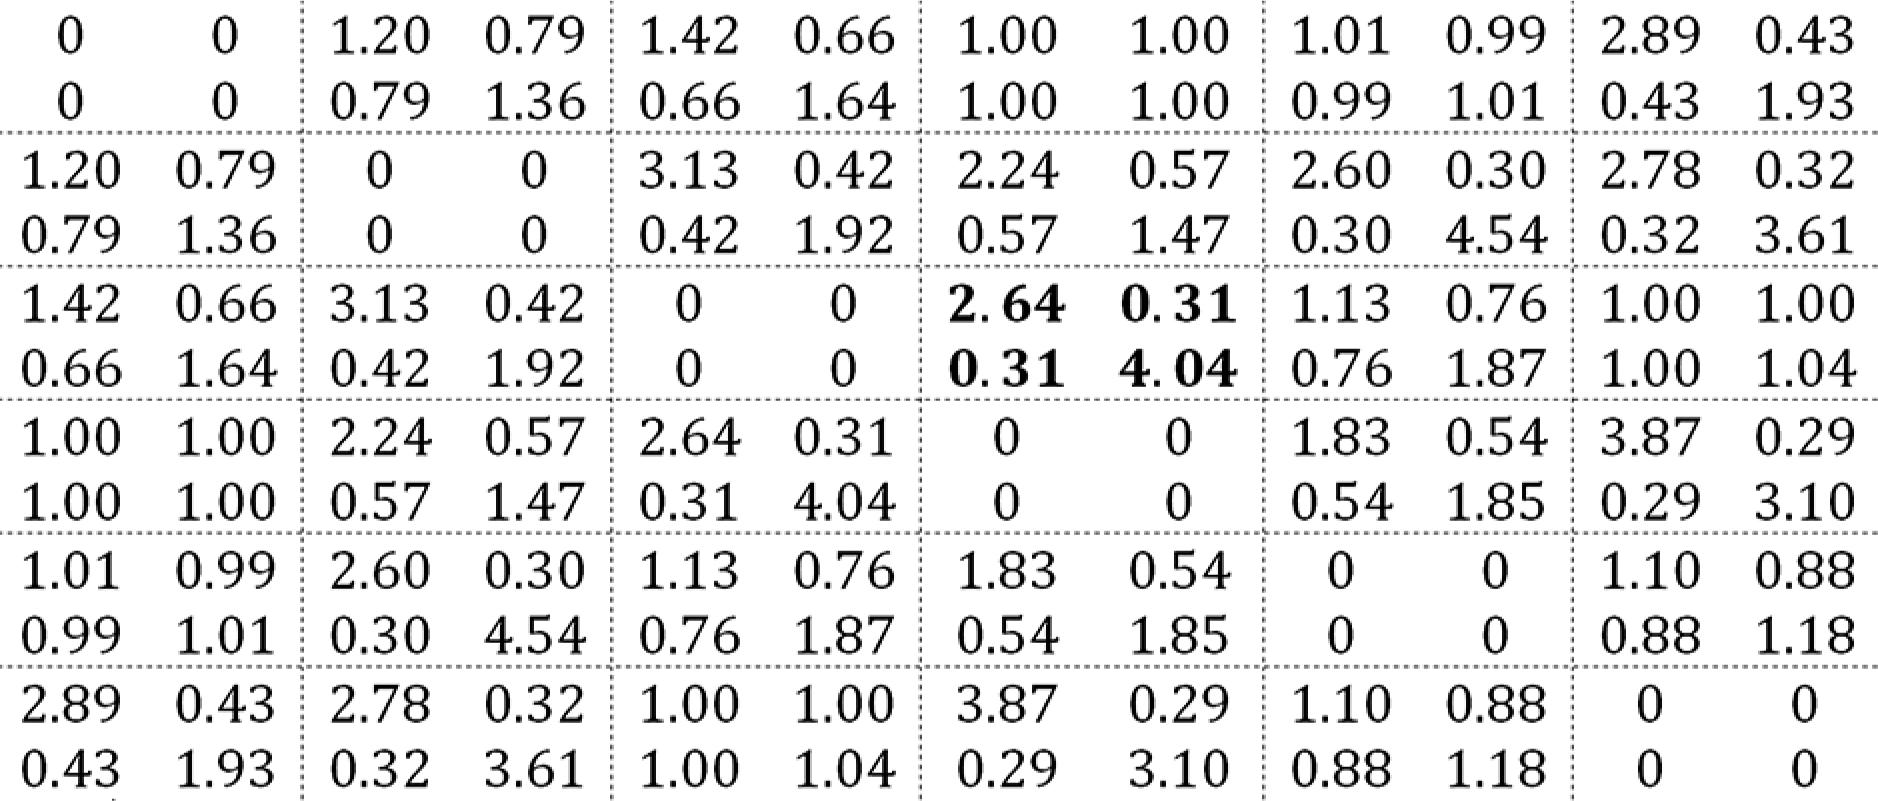
With less relevance to the model, we have the local odds ratios estimating related to the association structure (these parameters are treated as nuisance, i.e., of secondary interest), displayed in the following matrix:
The bold highlighted block is interpreted as: i) the estimated odds of a point that was a tussock in the winter becomes a weed instead of a tussock in early spring is 2.6 times the corresponding odds for a point that was a weed in the winter; ii) the estimated odds of a point that was a tussock in the winter becomes bare ground instead of a weed in early spring is 30 % of the corresponding odds for a point that was a weed in the winter; iii) the estimated odds of a point that was a weed in the winter becomes bare ground instead of a weed in early spring is 4 times the corresponding odds for a point that was bare ground in the winter. We notice that many of the local odds ratios in the matrix are close to 1, which suggests that the association between the correlated measurements is not so strong as expected. Comparing the naive and robust standard errors of the parameter estimates (i.e., a model that does not consider the dependence compared to the proposed model here) the difference between them is quite small.
Lastly, as a practical brief of Table 5 and Table 6 (the main results of the model), if the objective is to stimulate the occurrence of tussocks instead of weeds, it is advisable to choose maximum light interception (only in the autumn) and/or 45 cm height (for any season). These management options either stimulate the occurrence of bare ground instead of weeds (for any season considering the post-grazing and in the autumn and the second summer for pre-grazing). If the objective is the occurrence of tussocks, instead of bare ground, the suggestion is to choose 95 % of light interception in the spring and the second summer.
Conclusions
This paper presented an application of a recent methodology for multinomial correlated responses. This methodology is an extension of the well-known generalized estimating equations (GEE) approach that consists in describing the dependence structure among correlated measurements in a way that makes sense for categorized (nominal) responses, using local odds ratios for that.
In the experiment, the purpose was to investigate how the management conditions affect the type of vegetation observed in the field. We conclude that both pre and post-grazing conditions affect the proportion of tussocks, weeds and places with bare ground, and there is also an effect of the season. The statistical model allows to choose a management procedure according to the type of vegetation of interest for any season. Further, with the association structure, we can understand how one place with some type of vegetation can change to another type in the other seasons. The confidence intervals obtained are certainly more correct than if we had used a model that did not consider the dependence between the repeated measurements.
Other possible approaches to analyze this experiment are in the context of random effects models (generalized linear mixed models) or transition models, but in these cases, the interpretations are different and cannot be compared to the results showed in this study. Briefly, in a generalized linear mixed model, the interpretations are made in a subject-specific level while in a model-like, as presented in this paper, are done for the population average. Other aspects that should be taken in account are the presence of missing values, if there are different numbers of observations per subject, equal/unequal time spacing. Therefore, as the results found here were satisfactory and answer the objectives of the study, these other approaches were not applied. Future studies can investigate them and be done to improve the residual analysis to check the goodness-of-fit obtained, whose tools for categorical data are still limited.
References
- Agresti, A. 2002. Categorical Data Analysis. 2ed. John Wiley, Hoboken, NJ, USA.
- Agresti, A. 2007. An Introduction to Categorical Data Analysis. 2ed. John Wiley, Hoboken, NJ, USA.
- Diggle, P.J.; Heagerty, P.J.; Liang, K.Y.; Zeger, S.L. 2002. Analysis of Longitudinal Data. Oxford University Press, New York, NY, USA.
- Dobson, A.J. 2008. An Introduction to Generalized Linear Models. 2ed. Chapman and Hall, New York, NY, USA.
- Goodman, L.A. 1985. The analysis of cross-classified data having ordered and or unordered categories: association models, correlation models, and asymmetry models for contingency tables with or without missing entries. Annals of Statistics 13: 10-69.
- Liang, K.Y.; Zeger, S.L. 1986. Longitudinal data analysis using generalized linear models. Biometrika 73: 13-22.
- Lipsitz, S.R.; Kim, K.; Zhao, L.P. 1994. Analysis of repeated categorical data using generalized estimating equations. Statistics in Medicine 13: 1149-1163.
- Nelder, J.A.; Wedderburn, R.W.M. 1972. Generalized linear models. Journal of the Royal Statistical Society Series A 135: 370-384.
- Pereira, L.E.T.; Paiva, A.J.; Geremia, E.V.; Silva, S.C. 2015a. Grazing management and tussock distribution in elephant grass. Grass and Forage Science 70: 406-417.
- Pereira, L.E.T.; Paiva, A.J.; Geremia, E.V.; Silva, S.C. 2015b. Regrowth patterns of elephant grass (Pennisetum purpureum Schum) subjected to strategies of intermittent stocking management. Grass and Forage Science 70: 195-204.
- Pinheiro, J.C.; Bates, D.M. 2000. Mixed-Effects Models in S and S-PLUS. Springer, New York, NY, USA.
- Ryel, R.J.; Beyschlag, W.; Caldwel, L.M.M. 1994. Light field heterogeneity among tussock grasses: theoretical considerations of light harvesting and seedling establishment in tussocks and uniform tiller distributions. Oecologia 98: 241-246.
- Touloumis, A.; Agresti, A.; Kateri, M. 2013. GEE for multinomial responses using a local odds ratios parameterization. Biometrics 69: 633-640.
- Verbeke, G.; Molenberghs, G. 2000. Linear Mixed Models for Longitudinal Data. Springer, New York, NY, USA.
- Zeger, S.L.; Liang, K.Y. 1992. An overview of methods for the analysis of longitudinal data. Statistics in Medicine 11: 1825-1839.
Edited by
Publication Dates
-
Publication in this collection
Jul-Aug 2017
History
-
Received
22 Feb 2016 -
Accepted
07 Sept 2016


