ABSTRACT:
Brazil is the largest sugarcane producer in the world and the leader in the production of sugar and ethanol. Although sugarcane has become an important factor in the Brazilian economy, cultivation has presented many issues, for example, the problems due to burning before the manual harvest. The Brazilian authorities have approved a law that prohibits this practice and mechanized harvesting has thus become the most fitting approach. Given this development, areas for sugarcane plantation must be properly rebuilt to accommodate the new way of harvesting. The main characteristic demanded of sugarcane plots to use harvesting machines is that they must be rectangular. In the present paper, we propose a methodology for dividing the plantation area into plots and planning their allocation so as to accommodate mechanized harvesting. In view of the requirement for plots to be rectangular, we represented this problem as a two-dimensional cutting problem, and to find a solution we adopted the AND/OR graph approach. The computational experiments were conducted using real cases, and the proposed strategy was shown to perform well.
Keywords:
planting planning; sugarcane culture; mechanized harvesting; AND/OR graph approach
Introduction
Due to the growth in the consumption of ethanol and sugar, the sugarcane production process has undergone important changes, mainly in terms of harvesting methods. The manual harvesting systems once used have been replaced by mechanized procedures. This change is attributable to several factors such as the reduction in harvesting cost, the decreasing supply of skilled labor and, principally, the Agro Environmental Protocol proposed by the sugarcane industry association UNICA (União da Indústria de Cana-de-Açúcar) and the government of the state of São Paulo. This protocol established the complete elimination of the practice of sugarcane burning in 2017 (Cervi et al., 2015Cervi, W.R.; Lamparelli, R.; Berni, M.; Rocha, J. 2015. Identification, assessment and ordering of concepts for agro-energy planning and possibilities of spatial analysis. Engenharia Agrícola 35: 1210-1223.).
Solano et al. (2017)Solano, C.S.; Ponciano, N.J.; Azevedo, H.J.; Souza, P.M. 2017. Factors limiting the implementation of mechanical harvesting of sugarcane in Campos dos Goytacazes, RJ, Brazil. Revista Ceres 64: 40-46. identified the main technical factors that affect the implementation of mechanized harvesting systems. The authors identified important technical constraints in the system of planting, particularly the size and shape of the plots, the appropriate row spacing and the selection of sugarcane varieties suitable for mechanical harvesting. For efficient use of mechanized harvesting it is necessary to adopt larger and more uniform plots.
According to Florentino et al. (2015)Florentino, H.O.; Pato, M.V.; Jones, D.; Cantane, D.R. 2015. Production and management of sugarcane biomass process optimization. biomass production and uses. InTech 1: 11-28., for maximum efficiency of the harvesting machine and minimal cost, it is necessary to plan the plot design and sugarcane rows in such a way as to necessitate the fewest possible maneuvers. The plots should have a rectangular form at least 600 m long, well-leveled ground, parallelism between rows and adequate spacing to obtain maximum efficiency (Paixão et al., 2016Paixão, C.S.S.; Silva, R.P.; Voltarelli, M.A.; Cassia, M.T.; Tavares, T.O. 2016. Efficiency and losses in mechanical harvesting of soybeans due to the plots format. Australian Journal of Crop Science 10: 765-770.). Benedini and Conde (2008)Benedini, M.S.; Conde, A.J. 2008. Systematization of an area for mechanized harvesting of sugarcane = Sistematização de área para a colheita mecanizada de cana-de-açúcar. Revista Coplana 53: 23-25 (in Portuguese). affirm that the plots should have a furrow length of 500-800 m and a width of 150-400 m and the spacing between rows should be 1.5 m. Bharati et al. (2017)Bharati, R.C.; Chaudhary, K.K.; Singh, A.K.; Kumar, A.; Kumar, U.; Chandra, N. 2017. Efficiency of optimum plot size using information of previous experiments conducted in split plot design. Journal of AgriSearch 4: 60-67. recommend that most plots be rectangular with the greatest possible length for more efficient use of the harvesting machines. The sugarcane rows must be strategically placed to avoid excessive maneuvers and, consequently, lost time. According to Rossatto et al. (2015)Rossatto, O.B.; Crusciol, C.A.C.; Guerra, S.P.S.; Zimback, C.R.L. 2015. Implications of soil sampling processes on recommendations of phosphate and potassium fertilizers on sugarcane. Energia na Agricultura 30: 109-118., the plots are generally subdivided based on topography and soil homogeneity and should present an average area of between 10 and 20 hectares.
In this study we proposed a methodology to aid the division of the sugarcane planting areas in rectangular plots, so as to minimize the number of harvesting machine maneuvers. This methodology uses a two-dimensional cutting stock problem approach. Two-dimensional cutting stock problems have been intensively researched due to their importance in several industrial processes (Gilmore and Gomory, 1965Gilmore, P.; Gomory, R. 1965. Multi-stage cutting stock problems of two and more dimensions. Operations Research 14: 1045-1074.; Hertz, 1972Herz, J. 1972. Recursive computational procedure for two-dimensional stock cutting. IBM Journal of Research and Development 16: 462-469.; Neidlein et al., 2008Neidlein, V.; Vianna, A.C.G.; Arenales, M.N.; Waschrer, G. 2008. The Two-Dimensional, Rectangular, Guillotineable-Layout Cutting Problem with a Single Defect. Otto-von-Guericke University Magdeburg, Magdeburg, Germany. (FEMM Working Papers, 8035)., Kim et al., 2014Kim, K.; Kim, B-I.; Cho, H. 2014. Multiple-choice knapsack-based heuristic algorithm for the two-stage two-dimensional cutting stock problem in the paper industry. International Journal of Production Research 52: 5675-5689.; Malaguti et al., 2014Malaguti, E.; Durán, R.M.; Toth, P. 2014. Approaches to real world two-dimensional cutting problems. Omega 47: 99-115.). Due to the difficulty in solving these problems, there are a large number of heuristic procedures proposed in the literature to solve them (Morabito et al., 1992Morabito, R.; Arenales, M.; Arcaro, V. 1992. An AND/OR-graph approach for two-dimensional cutting problems. European Journal of Operational Research 58: 263-271.; Lodi et al., 2002Lodi, A.; Martello, S.; Monaci, M. 2002. Two-dimensional packing problems: a survey. European Journal of Operational Research 141: 241-252.; Wei et al., 2017Wei, L.; Zhu, W.; Lim, A.; Liu, Q.; Chen, X. 2017. An adaptive selection approach for the 2D rectangle packing area minimization problem. Omega: doi.org/10.1016/j.omega.2017.09.002.
doi.org/10.1016/j.omega.2017.09.002...
). Among these strategies, we chose the AND/OR graph approach, developed by Morabito et al. (1992)Morabito, R.; Arenales, M.; Arcaro, V. 1992. An AND/OR-graph approach for two-dimensional cutting problems. European Journal of Operational Research 58: 263-271., due to the flexibility and efficiency of this technique to solve problems in two dimensions.
Materials and Methods
Brazil expands annually approximately 5 % of the sugarcane planting area and about 18 % of the cane fields are replanted. Consequently, there is a large area that needs to be divided into plots or the current plots need to be rebuilt, for the sugarcane that is planted to meet the recommendations for mechanized harvesting. Thus, the present paper proposes a methodology for planning the division of the planting area into plots that address such characteristics and their allocation.
The problem addressed here consists of generating and allocating rectangular plots in planting areas in such a way as to minimize the number of harvesting machine maneuvers. Our methodology proposes approximating this issue in the real world in a two-dimensional cutting stock problem. Initially, we proposed a mathematical model to generate all possible plots. To solve the problem of selecting and allocating the plots, we used the AND/OR graph approach. Since a number of planted areas are in regions where it is not possible or permitted to plant sugarcane, certain peculiarities of the two-dimensional cutting stock problem were considered, so that no plot would be allocated to these regions. Computational experiments were conducted using real cases.
Plot generation problem
Consider an available area for planting sugarcane of H hectares, and let J be the set of all possible plots that can be allocated to this area. The plot generation problem is defined as follows:
A planting area must be divided into rectangular plots with dimensions (lj, wj), where lj is the length and wj the width of the plot j ∈ J, in order to increase yield, reduce traffic and minimize the maneuvers of the sugarcane harvesting machine.
An acceptable space between sugarcane rows is 1.5 m, as discussed above. Thus, the calculation of the number of harvesting machine maneuvers in plot j is given by
where: denotes the greatest integer less than or equal to .
Based on Paixão et al. (2016)Paixão, C.S.S.; Silva, R.P.; Voltarelli, M.A.; Cassia, M.T.; Tavares, T.O. 2016. Efficiency and losses in mechanical harvesting of soybeans due to the plots format. Australian Journal of Crop Science 10: 765-770. and Benedini and Conde (2008)Benedini, M.S.; Conde, A.J. 2008. Systematization of an area for mechanized harvesting of sugarcane = Sistematização de área para a colheita mecanizada de cana-de-açúcar. Revista Coplana 53: 23-25 (in Portuguese)., who described the appropriate size of plots for better machine performance, we proposed a nonlinear bi-objective mathematical model to determine the optimal dimensions (lj, wj), j ∈ J, of rectangular plots in plantation areas in order to minimize the total number of machine maneuvers as follows:
subject to:
In the model (1)–(7), lj and wj represent, respectively, the length and width of plot j in meters, j ∈ J, and H is the total area in hectares (and when multiplied by 10,000, it is converted into m2).
Recommendations presented in the literature which were reviewed in this paper (Benedini and Conde, 2008Benedini, M.S.; Conde, A.J. 2008. Systematization of an area for mechanized harvesting of sugarcane = Sistematização de área para a colheita mecanizada de cana-de-açúcar. Revista Coplana 53: 23-25 (in Portuguese).; Bharati et al., 2017Bharati, R.C.; Chaudhary, K.K.; Singh, A.K.; Kumar, A.; Kumar, U.; Chandra, N. 2017. Efficiency of optimum plot size using information of previous experiments conducted in split plot design. Journal of AgriSearch 4: 60-67.; Paixão et al., 2016Paixão, C.S.S.; Silva, R.P.; Voltarelli, M.A.; Cassia, M.T.; Tavares, T.O. 2016. Efficiency and losses in mechanical harvesting of soybeans due to the plots format. Australian Journal of Crop Science 10: 765-770.; Solano et al., 2017Solano, C.S.; Ponciano, N.J.; Azevedo, H.J.; Souza, P.M. 2017. Factors limiting the implementation of mechanical harvesting of sugarcane in Campos dos Goytacazes, RJ, Brazil. Revista Ceres 64: 40-46.) included the objective function (1) which aimed to minimize the number of harvest machine maneuvers in the plot j and, simultaneously, take advantage of the plantation area with constraints on the dimensions and area of the plots. Constraint (2) imposed boundaries, lower (Arealow) and upper (Areaupp), on the areas of the plots. Constraint (3) ensured that the plots had the shape of a long rectangle. Therefore, the width (wj), j ∈ J, of the plot was smaller than or equal to a percentage (p) of the length (lj), j ∈ J. Constraint (4) ensured that the area of the plot (ljwj), j ∈ J, was lower than or equal to 15 % of the total area to be planted. This constraint was included to comply with the recommendations of the mills. Per constraint (5), the sum of the plot areas had to be less than or equal to the total area. Constraint (6) imposed lower (llow) and upper (lupp) bounds on the lengths of the plots. Finally, constraint (7) imposed lower (wlow) and upper (wupp) boundaries on the widths of the plots.
Due to the complexity of the nonlinear model (1)–(7), the problem was solved by a heuristic procedure which took into account the constraints of the model. From the lower and upper boundaries for the lengths and widths of the plots (constraints (6)–(7)), the lengths were generated and when combined, created rectangles (plots) that satisfied constraints (2)–(5). Consequently, the objective function (1) was also satisfied.
With suitable plots generated, the AND/OR graph approach was used to select and allocate the plots in the most strategic way. This strategy is presented in the next section.
Plot allocation using the AND/OR graph approach
According to real maps of sugarcane planting regions, the areas used have irregular forms, and a number of them contain preservation areas, construction projects, rivers, lakes or other areas that are not appropriate for plot allocation.
To solve the rectangular plot allocation problem in a sugarcane plantation area, we related this problem to a two-dimensional cutting stock problem, which consists of allocating small rectangular pieces within the confines of larger rectangular plates. Initially, the plantation area, which was irregular, was manually approximated to the plate, and these plots were thus considered as rectangular pieces. The allocation of plots in the plantation area was similar to the generation of a cutting pattern (the way items are allocated on a plate) in the cutting stock problem. Figure 1A illustrates the representation of one irregular area and Figure 1B the approximation made with a rectangular plate.
Using a sample number of plots (pieces), a possible plot allocation for the rectangular plate using the two-dimensional cutting stock problem strategy is shown in Figure 2.
Note that the allocation of the plots does not take into account the regions in which it was not possible or permitted to plant sugarcane. Due to the plot allocation restrictions in certain areas, we deferred to a particularity of the two-dimensional cutting stock problem, namely, the possibility of including a defect in the plate (Neidlein et al., 2008Neidlein, V.; Vianna, A.C.G.; Arenales, M.N.; Waschrer, G. 2008. The Two-Dimensional, Rectangular, Guillotineable-Layout Cutting Problem with a Single Defect. Otto-von-Guericke University Magdeburg, Magdeburg, Germany. (FEMM Working Papers, 8035).). Figures 3A and B show the same region presented in Figure 2, but certain areas are considered defects in the plate (hatched rectangles). Plots may not be allocated in these areas.
To solve the two-dimensional cutting stock problem with a defective plate, Neidlein et al. (2008)Neidlein, V.; Vianna, A.C.G.; Arenales, M.N.; Waschrer, G. 2008. The Two-Dimensional, Rectangular, Guillotineable-Layout Cutting Problem with a Single Defect. Otto-von-Guericke University Magdeburg, Magdeburg, Germany. (FEMM Working Papers, 8035). modified the AND/OR graph approach proposed by Morabito et al. (1992)Morabito, R.; Arenales, M.; Arcaro, V. 1992. An AND/OR-graph approach for two-dimensional cutting problems. European Journal of Operational Research 58: 263-271.. An AND/OR graph can be defined to represent all possible cutting patterns for the problem. In such a graph, the nodes represent the rectangles and the arcs the cuts. In our problem, the cuts were the guillotine type, that is, when the plate was cut, two new rectangles were generated. An AND-arc (cut) establishes a relationship between an N node on the graph (rectangle) with two nodes, N1 and N2 (rectangles obtained after cutting). The cutting patterns were then generated, verifying all cut possibilities (OR-arc), and one of them reproduced the same rectangle (N). At this point, cutting was discontinued.
The cuts made to the plate (vertical or horizontal) can be restricted, without loss of generality, to a finite set, called the “discretization set”, which is formed by non-negative linear combinations of the item sizes (Herz, 1972Herz, J. 1972. Recursive computational procedure for two-dimensional stock cutting. IBM Journal of Research and Development 16: 462-469. and Morabito et al., 1992Morabito, R.; Arenales, M.; Arcaro, V. 1992. An AND/OR-graph approach for two-dimensional cutting problems. European Journal of Operational Research 58: 263-271.). Using the AND/OR graph, it was possible to represent a cutting pattern as a complete path in a graph and enumerate the sizes implicitly with the objective of finding the optimal solution.
The cutting patterns in a defective plate were represented in the AND/OR graph analog to the case without defect (Neidlein et al., 2008Neidlein, V.; Vianna, A.C.G.; Arenales, M.N.; Waschrer, G. 2008. The Two-Dimensional, Rectangular, Guillotineable-Layout Cutting Problem with a Single Defect. Otto-von-Guericke University Magdeburg, Magdeburg, Germany. (FEMM Working Papers, 8035).), with some modifications presented next. A cut sequence in a plate with one or more defects is illustrated in Figures 4A and B, respectively.
A) Possible cuts in a plate with one defect; B) Possible cuts in a plate with more than one defect.
Where the plate had one or more defects, the modifications in the AND/OR graph were performed during both the utilization of the discretization set and the calculation of the lower bound used to branch the graph. In general, the defects were enclosed by a rectangle (Figure 3A), and the allocation of the pieces (rectangles) in the plate was performed around the defect (Figure 3B). The discretization set, which generates the cuts for the plate, is used sequentially until a defect is found. From the localization of the defect, we returned to the beginning of the discretization set, which was again followed sequentially until a new defect was found or the discretization set exhausted. In general, where the plate had one or more defects, the discretization set was generated so as to entirely contain the defect in a rectangle (Figure 4A and B). Details about the discretization set can be found in Herz (1972)Herz, J. 1972. Recursive computational procedure for two-dimensional stock cutting. IBM Journal of Research and Development 16: 462-469..
To calculate the lower boundary, a trivial solution consisted of filling the plate with the same pieces. This solution was called the homogeneous solution. Where the plate had one or more defects, horizontal and vertical bands were inserted around the defect. Each one of these bands was filled with the same item type (homogeneous solutions). For example, in Figure 5 the plate presents four rectangles that had to be filled.
Using the AND/OR graph approach, it was possible to determine the best way to allocate a set of rectangles inside a plate. Details of the implementation of the AND/OR graph approach can be found in Morabito et al. (1992)Morabito, R.; Arenales, M.; Arcaro, V. 1992. An AND/OR-graph approach for two-dimensional cutting problems. European Journal of Operational Research 58: 263-271. and Neidlein et al. (2008)Neidlein, V.; Vianna, A.C.G.; Arenales, M.N.; Waschrer, G. 2008. The Two-Dimensional, Rectangular, Guillotineable-Layout Cutting Problem with a Single Defect. Otto-von-Guericke University Magdeburg, Magdeburg, Germany. (FEMM Working Papers, 8035)..
After approximating the planting area using a plate and defining the allocation of all possible plots using the AND/OR graph approach, the next step consisted of approximating the solution to the real area that would be used to plant sugarcane.
Treatment of the solution
To present the plot allocation in sugarcane planting areas, a post-optimization was necessary in order to approximate the solution generated by the AND/OR graph approach to the real area. This is a simple process and was performed manually. From Figure 3B, the planting area with defined plots is presented in Figure 6.
Relating this solution to that in Figure 3B, we observed that the plots allocated to the edge of the defined region were not rectangular, as recommended. This was, however, an acceptable solution since the planting area was not regular. Furthermore, in the post-optimization process, a number of plots on the edge presented dimensions larger or smaller than the rectangle previously defined. This was also an acceptable situation because the solution presented by the AND/OR graph related to the rectangle (plate) that circumscribed the planting area, and in some places, the rectangle was smaller or larger than the area.
When the post-optimization was performed, a quantity of the waste generated (large hatch in Figure 3B) was conveniently incorporated into the nearest allocated rectangle. Despite all the modifications, we must emphasize that the limitations on the dimensions of the plots were respected within an acceptable level of tolerance. Another important consideration was the observing of agricultural management practices, which recommend that cane rows should be aligned with terrain contour lines to minimize soil erosion. This means slightly round, contour shapes, even for small incline terrains. Although our strategy provided straight cuts, it gave the manager an accurate assessment during the division of the plantation area and, from the proposed approximation of the plots into rectangles, it was possible to improve the adjustment relating to the terrain contour lines.
Next, specific computational experiments are presented with real regions used for planting sugarcane.
Results and Discussion
For a real trial of the plot generation and allocation methodology, we considered two regions (slope less than 12 %) on a farm located in the South of the state of São Paulo, Brazil. Currently, this farm is run by a mill also located in this region which will soon reformulate the planting area for mechanized harvesting. The first region has an area of 178.84 hectares and the second, 101.69 hectares. For both regions, we calculated the number of harvesting machine maneuvers beforehand using the current division and after applying the proposed methodology.
The solution consisted of three phases. Initially, we generated the plots using the strategy proposed in the last section. As the discretizing of the length or width of the plots was done by one unit, many rectangles were generated. To limit this quantity, we discretized the length and the width into 20 units. Using the rectangles generated, we defined a set J of plots that satisfied constraints (1)–(7) which was used in the AND/OR graph approach. Plots from J were selected by the AND/OR graph, and the plot allocation implemented. It is important to highlight that the AND/OR graph allows for a 90° rotation of the plots to be allocated. The final phase of the solution was a post-optimization adjustment.
The plot generation was performed using the values proposed by Benedini and Conde (2008)Benedini, M.S.; Conde, A.J. 2008. Systematization of an area for mechanized harvesting of sugarcane = Sistematização de área para a colheita mecanizada de cana-de-açúcar. Revista Coplana 53: 23-25 (in Portuguese). which were acceptable to the mill manager: llow = 500 m, lupp = 800 m, wlow = 150 m, wupp = 400 m, Arealow = 80,000 m and Areaupp = 190,000 m. We also define p = 50 (constraint (3)) to guarantee that the generated rectangles were elongated and the mechanical harvest could realize its full potential.
The computational results were found using two real maps, Map 1 and Map 2. For these maps, two different adjustments for defects were made. However, other adjustments could be performed. The algorithm used to generate and allocate the plots in the planting area was developed using Pascal-language and was run on an Intel Core 2 Duo processor.
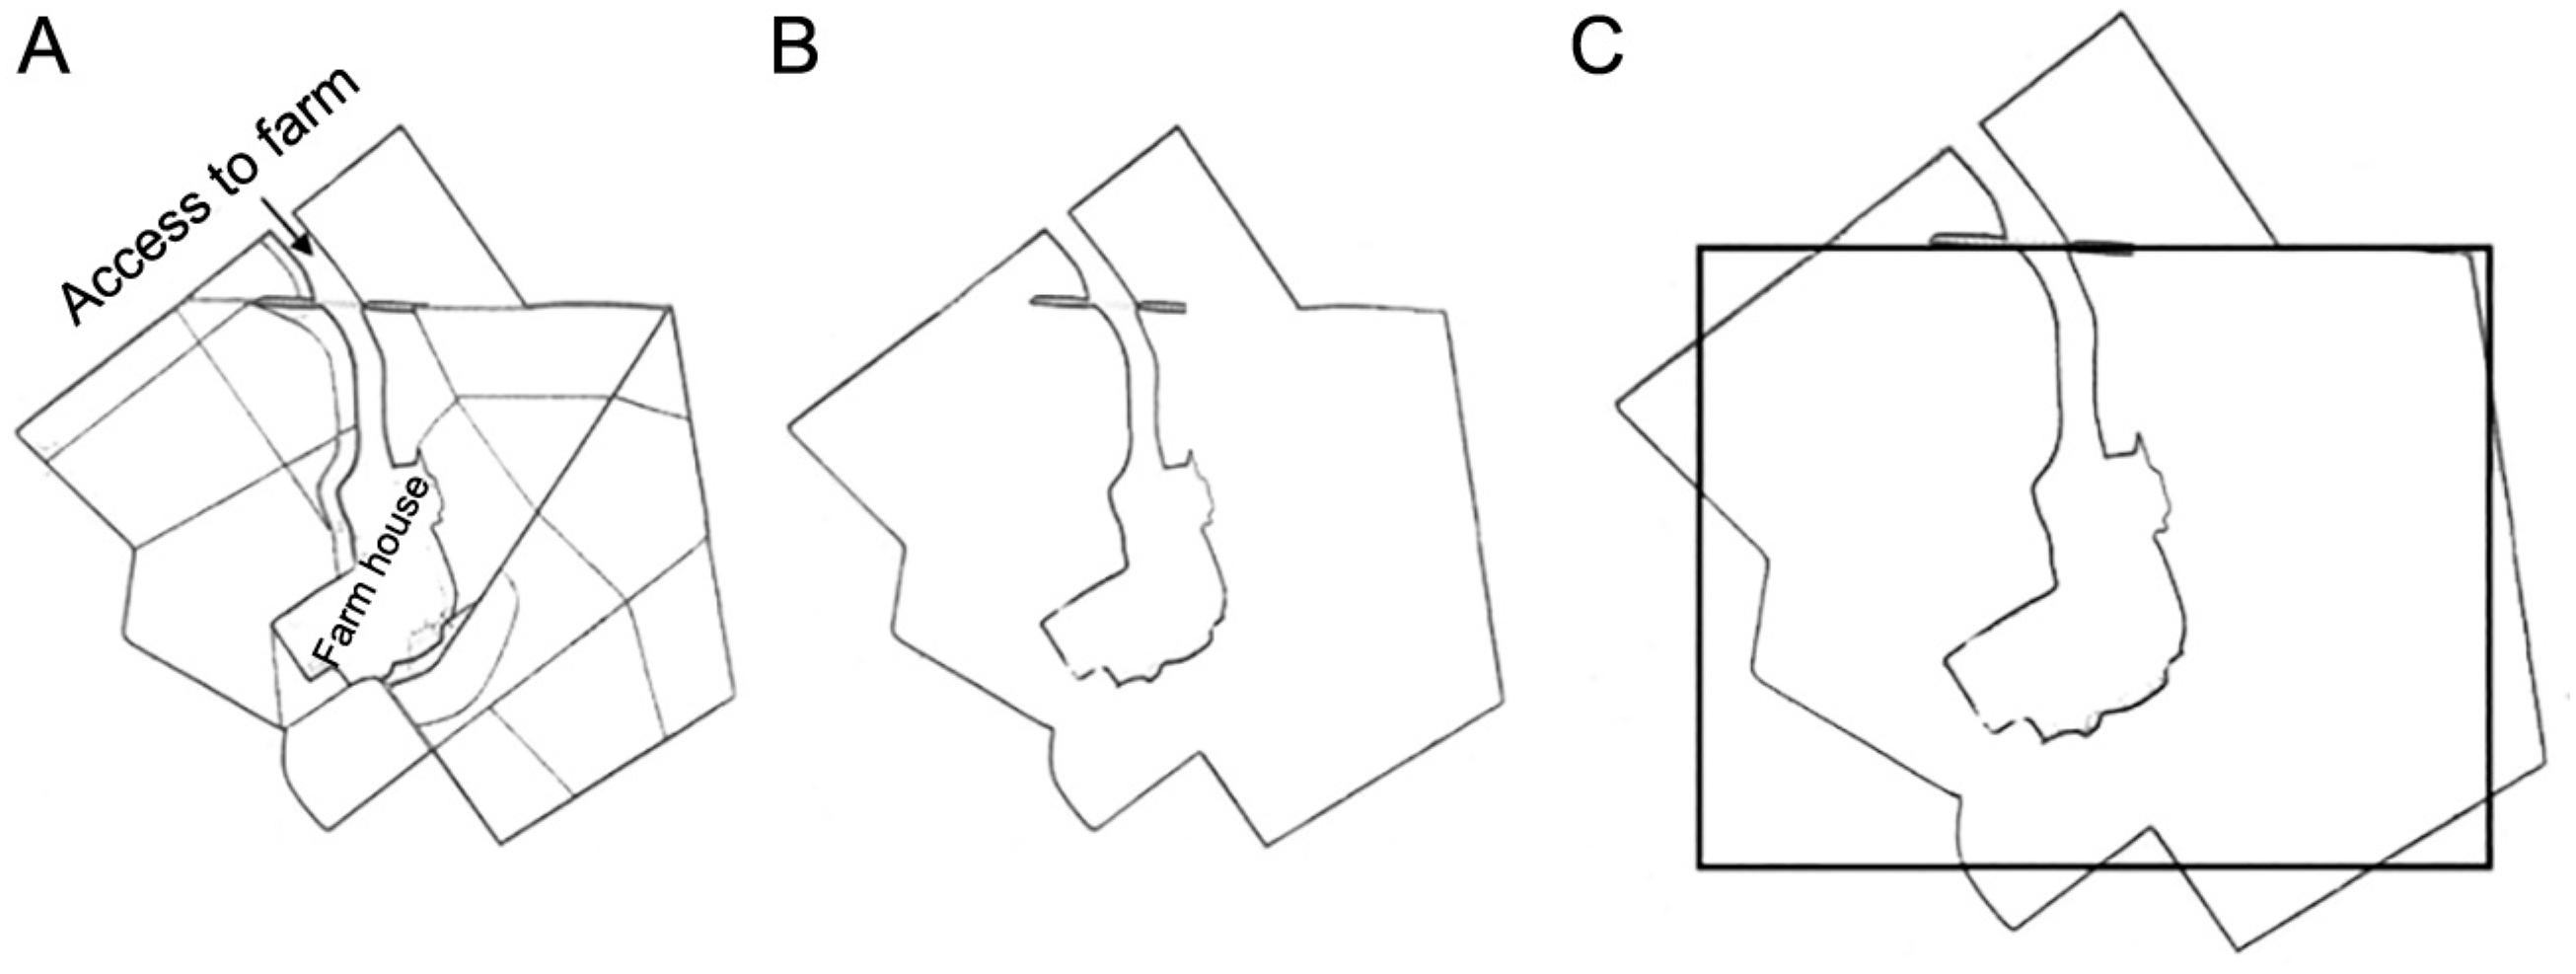
Figure 7A shows Map 1 with the regions currently used for sugarcane planting and the plots divided for manual harvest. The total planting area of this region is 171.09 hectares. Figures 7B and C show the region without plot allocation and with rectangle approximation, respectively. It should be noted that there is a large region encompassed by the rectangle that does not belong to Map 1, and there is a large region of the map that is not encompassed by the rectangle. This region has a shape that is similar to the rectangle and dimensions that satisfy the imposed limits, and was, therefore, addressed during the post-optimization process. Clearly, the planting area could have been rotated (including observing the possible contour lines) and encompassed in another way by the rectangle. The strategy proposed is very flexible, and the way of encompassing the plantation areas is ultimately the responsibility of the manager.
A) Map 1 with plots currently allocated; B) Map 1 used for the application of the methodology; C) Rectangle adjustment in Map 1.
According to Map 1, there is a farmhouse and an access path to the farm in this region. To avoid plot allocation in these areas, we defined defects in these places. Figure 8A shows the two defects (other defects could have been defined). In Figure 8B, we present the solution obtained using the AND/OR graph approach. In the representation, there are no plots overlapping the defects, and there are some places within the rectangle that were not allocated to plots (large hatch). These areas were considered waste for the cutting stock problem. For example, in Figure 8B there is a large rectangle (upper-right corner with a large hatch) that was not allocated to any plot. This occurred because no rectangle generated matched these dimensions. To cover this area, the border of the plots was adjusted (Figure 8C) during the post-optimization process. Figure 8C shows the final solution after the adjustment to the real planting area.
A) Definition of the defects in Map 1; B) Solution of the AND/OR graph approach; C) Adjustment of the solution to Map 1.
To analyze the solution, we compared the number of maneuvers that the harvesting machine performed using solution 8C with the current plot division presented in Figure 7A. With the plots defined in Figure 7A, the number of maneuvers was 3,694, and after applying our methodology (Figure 8C) the number of maneuvers was 2,193. This solution shows a reduction of 41 % in the number of maneuvers performed by the harvesting machine and, consequently, a reduction in machine use time, the hours worked by the machine operator and an increase in fuel economy that is also reflected in environmental benefits.
Figure 9A shows the new adjustment to the defects in Map 1 and, consequently, a new solution (Figure 9B) and approximation (Figure 9C) to the real area.
A) Redefinition of the defects in Map 1; B) Solution of the AND/OR graph approach; C) Adjustment of the solution to Map 1.
The defects redefined in Map 1 (Figure 9A) are smaller than those defined in Figure 8A. Thus, with the new plot allocation the number of maneuvers by the harvesting machine in Figure 9C was reduced to 2,097, which is a reduction of 43 % for this region (Figure 7A), in addition to the benefits already cited.
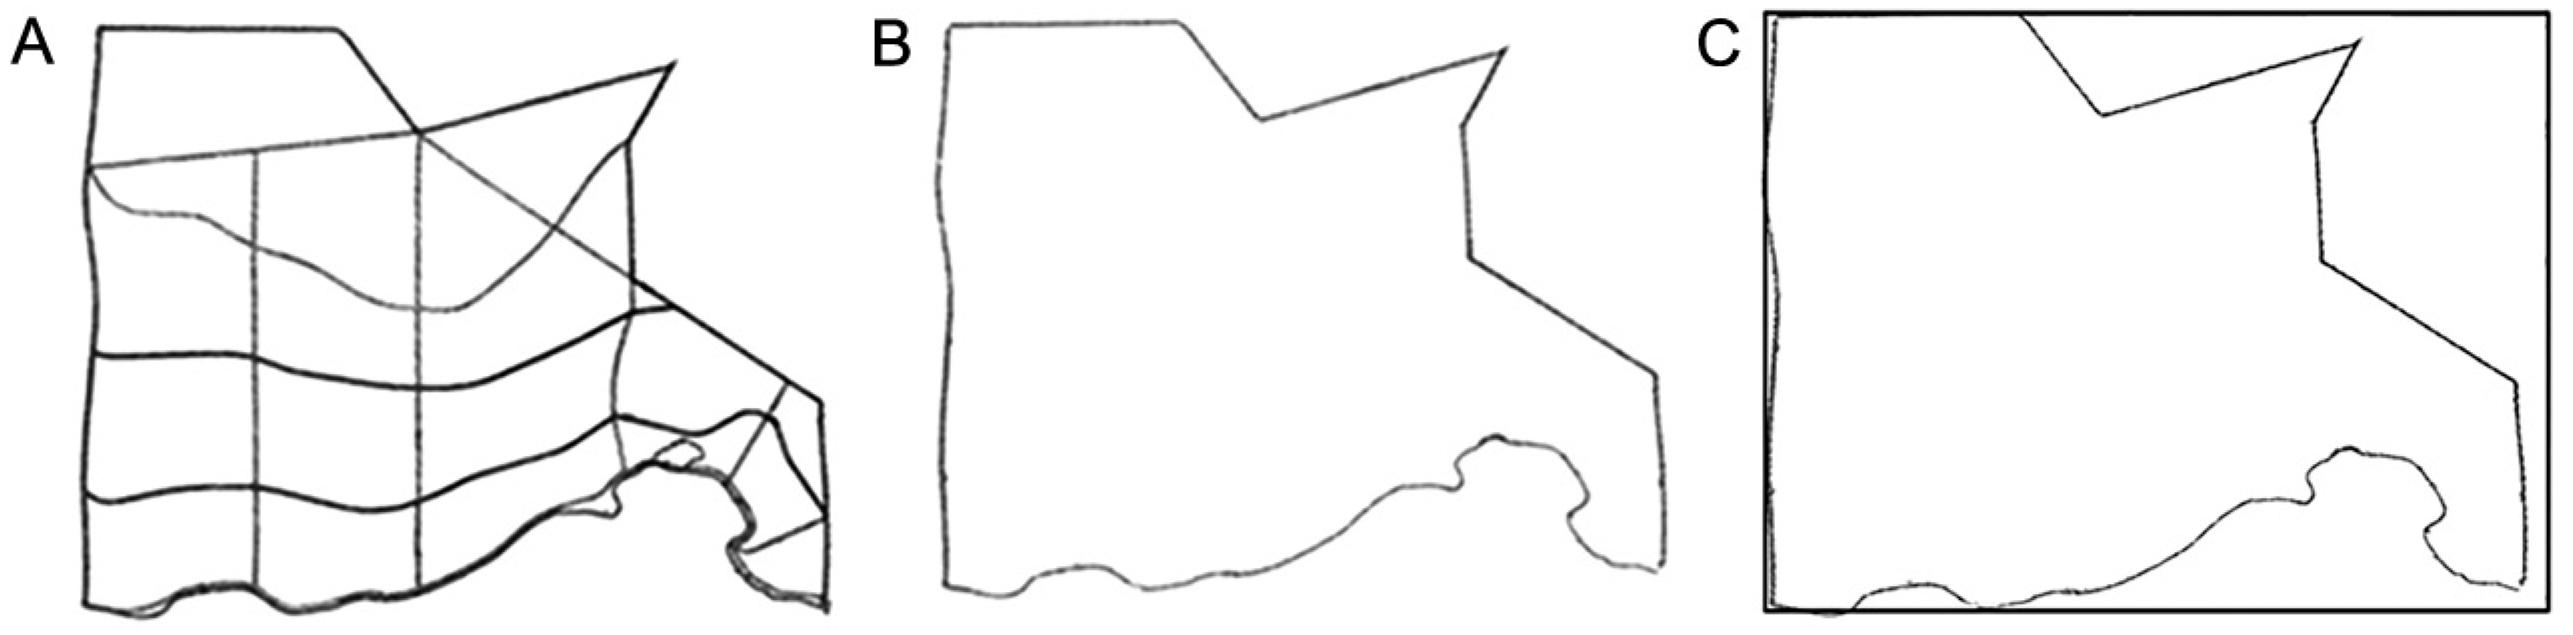
Figure 10A shows Map 2 of the farm with the plots currently allocated and total planting area with 96.84 hectares. Figures 10B and C show the region without plot allocation and with rectangle approximation, respectively. In this representation, the region is completely encompassed by the rectangle.
A) Map 2 with plots currently allocated; B) Map 2 used for the application of the methodology; C) Rectangle adjustment to Map 2.
In the planting area presented in Map 2, there are no nature preservation areas, construction areas, rivers, lakes or other areas that do not allow the allocation of plots. Therefore, there are no defects inside the region. The defects were allocated outside of the region as presented in Figure 11A. Figure 11B presents the solution obtained using the AND/OR graph approach. As expected, this solution includes map areas not allocated to plots (large hatch) that would be dealt with by the post-optimization process. Figure 11C shows the final solution after the adjustment to the real planting area.
A) Map 2 with plots currently allocated; B) Map 2 used for the application of the methodology; C) Adjustment to Map 2.
For Map 2, the number of maneuvers of the harvesting machine in Figure 10A was 2,802. With the solution presented in Figure 11C, this number was reduced to 996; 64 % fewer maneuvers. Figure 12A shows the new adjustment to the defects in the Map 2. The upper defect increased and the lower defect decreased when compared with the defects in Figure 11A. The new solution is presented in Figure 12B and the approximation to the real area in Figure 12C.
A) Redefinition of the defects in Map 2; B) Solution of the AND/OR graph approach; C) Adjustment of the solution to Map 2.
With the redefinition of the defects in Map 2, the number of maneuvers of the harvesting machine in Figure 12C was 1,011, a reduction of 64 % compared with the current allocation presented in Figure 10A.
During the sugar cane harvest, optimal utilization of the necessary resources can generate higher profits. This requires an analysis of the process of sugarcane harvesting as a whole. When plots are designated for planting, in addition to the reduction in the number of maneuvers of the harvesting machine, there are also benefits for the truck that accompanies the harvesting machine and transports the cane to the mill; it reduces the time of harvesting machine use and, consequently, there is less detrition, the hours worked by the machine operator are reduced and less fuel is used, to name just a few. Furthermore, the operational yield of the harvest procedure consequently shows an important reduction in environmental impact.
Due to the flexibility of encompassing the planting area in a rectangle and then dividing it into plots, the integrity of the structure and form of the land could be respected. In addition, difficulties in accessing certain areas by the machines can be avoided by defining defects in the region. In each region presented in this paper, a number of defects were defined, although other defects could also have been defined. The quantity of defects in the plate directly influenced the computational effort necessary for the AND/OR graph.
The results obtained were presented to the mill manager, who was eminently satisfied. After presenting our strategy to the manager, we judged the proposed strategy to be very positively and well suited to assisting mill managers in the planning of the sugarcane planting areas.
For the allocations presented in this section, the computational time was acceptable in practice (about 10 s for the definition of each region).
Conclusions
In the present study, we proposed a strategy for dividing the planting areas into rectangular plots for mechanized sugarcane harvesting. A bi-objective mathematical optimization model was also proposed to assist in the plot generation, which has dimension and area requirements to consider. To allocate the plots generated to the planting areas, the problem was treated as a two-dimensional cutting stock problem, and a modified method based on the AND/OR graph approach was used to solve it.
Our methodology consisted of three steps: first, we generated plots with realistic dimensions in accordance with the limitations imposed to reduce the number of maneuvers for the sugarcane harvesting machines. In the second part, we approximated the planting area to a rectangle, and the AND/OR graph approach, with adjustments which were used to select and allocate plots to this rectangle. Next, a post-optimization was carried out to approximate the solution obtained by the AND/OR graph to the real sugarcane planting area.
To test the performance of this approach, we applied the proposed methodology to two real regions of a farm located in the interior of the state of São Paulo, Brazil. The farm had a sugarcane plantation and intended reformulate its entire planting area to facilitate mechanized harvesting.
Using the plots generated and their allocation, our strategy resulted in a reduction of over 40 % in the number of maneuvers required by the sugarcane harvesting machines when compared with the current plot division. This reduction implies multiple economic and environmental advantages.
When presented to the mill manager the solutions were evaluated and met expectations. We are, therefore, certain that the methodology proposed can assist mill managers in the planning of sugarcane planting areas. Furthermore, the strategy is decidedly different from common practice and is exceptionally flexible, adapting to various planting areas with viability for crop production adopted in soil no matter the incline of the slope (less than or greater than 12 %).
Acknowledgments
The authors would like to thank the Fundação de Amparo à Pesquisa do Estado de São Paulo (FAPESP - Proc. nº 2015/03066-8 and 2014/01604-0), the Fundação para o Desenvolvimento da Universidade Estadual Paulista/Pró-Reitoria de Pesquisa/Pró-Reitoria de Pós-Graduação da Universidade Estadual Paulista (FUNDUNESP/PROPE/PROPG/UNESP) (0351/019/13), the Conselho Nacional de Desenvolvimento Científico e Tecnológico (CNPq) (302454/2016-0) and the Coordenação de Aperfeiçoamento de Pessoal de Nível Superior (CAPES) for the financial support.
References
- Benedini, M.S.; Conde, A.J. 2008. Systematization of an area for mechanized harvesting of sugarcane = Sistematização de área para a colheita mecanizada de cana-de-açúcar. Revista Coplana 53: 23-25 (in Portuguese).
- Bharati, R.C.; Chaudhary, K.K.; Singh, A.K.; Kumar, A.; Kumar, U.; Chandra, N. 2017. Efficiency of optimum plot size using information of previous experiments conducted in split plot design. Journal of AgriSearch 4: 60-67.
- Cervi, W.R.; Lamparelli, R.; Berni, M.; Rocha, J. 2015. Identification, assessment and ordering of concepts for agro-energy planning and possibilities of spatial analysis. Engenharia Agrícola 35: 1210-1223.
- Florentino, H.O.; Pato, M.V.; Jones, D.; Cantane, D.R. 2015. Production and management of sugarcane biomass process optimization. biomass production and uses. InTech 1: 11-28.
- Gilmore, P.; Gomory, R. 1965. Multi-stage cutting stock problems of two and more dimensions. Operations Research 14: 1045-1074.
- Herz, J. 1972. Recursive computational procedure for two-dimensional stock cutting. IBM Journal of Research and Development 16: 462-469.
- Kim, K.; Kim, B-I.; Cho, H. 2014. Multiple-choice knapsack-based heuristic algorithm for the two-stage two-dimensional cutting stock problem in the paper industry. International Journal of Production Research 52: 5675-5689.
- Lodi, A.; Martello, S.; Monaci, M. 2002. Two-dimensional packing problems: a survey. European Journal of Operational Research 141: 241-252.
- Malaguti, E.; Durán, R.M.; Toth, P. 2014. Approaches to real world two-dimensional cutting problems. Omega 47: 99-115.
- Morabito, R.; Arenales, M.; Arcaro, V. 1992. An AND/OR-graph approach for two-dimensional cutting problems. European Journal of Operational Research 58: 263-271.
- Neidlein, V.; Vianna, A.C.G.; Arenales, M.N.; Waschrer, G. 2008. The Two-Dimensional, Rectangular, Guillotineable-Layout Cutting Problem with a Single Defect. Otto-von-Guericke University Magdeburg, Magdeburg, Germany. (FEMM Working Papers, 8035).
- Paixão, C.S.S.; Silva, R.P.; Voltarelli, M.A.; Cassia, M.T.; Tavares, T.O. 2016. Efficiency and losses in mechanical harvesting of soybeans due to the plots format. Australian Journal of Crop Science 10: 765-770.
- Rossatto, O.B.; Crusciol, C.A.C.; Guerra, S.P.S.; Zimback, C.R.L. 2015. Implications of soil sampling processes on recommendations of phosphate and potassium fertilizers on sugarcane. Energia na Agricultura 30: 109-118.
- Solano, C.S.; Ponciano, N.J.; Azevedo, H.J.; Souza, P.M. 2017. Factors limiting the implementation of mechanical harvesting of sugarcane in Campos dos Goytacazes, RJ, Brazil. Revista Ceres 64: 40-46.
- Wei, L.; Zhu, W.; Lim, A.; Liu, Q.; Chen, X. 2017. An adaptive selection approach for the 2D rectangle packing area minimization problem. Omega: doi.org/10.1016/j.omega.2017.09.002.
» doi.org/10.1016/j.omega.2017.09.002
Edited by
Publication Dates
-
Publication in this collection
Jul-Aug 2019
History
-
Received
14 May 2017 -
Accepted
12 Mar 2018