ABSTRACT
Studies of soil porosity through image analysis are important to an understanding of how the soil functions. However, the lack of a simplified methodology for the quantification of the shape, number, and size of soil pores has limited the use of information extracted from images. The present work proposes a software program for the quantification and characterization of soil porosity from data derived from 2-D images. The user-friendly software was developed in C++ and allows for the classification of pores in terms of size, shape, and combinations of size and shape. Using raw data generated by image analysis systems, the software calculates the following parameters for the characterization of soil porosity: total area of pore (Tap), number of pores, pore shape, pore shape and pore area, and pore shape and equivalent pore diameter (EqDiam). In this paper, the input file with the raw soil porosity data was generated using the Noesis Visilog 5.4 image analysis system; however other image analysis programs can be used, in which case, the input file requires a standard format to permit processing by this software. The software also shows the descriptive statistics (mean, standard deviation, variance, and the coefficient of variation) of the parameters considering the total number of images evaluated. The results show that the software is a complementary tool to any analysis of soil porosity, allowing for a precise and quick analysis.
soil structure; soil thin sections; soil porosity data; pore morphology
Introduction
Soil micromorphology is becoming widely used for the characterization of soil porosity with the aid of digital techniques for the processing and analyzing of images. Analysis in two dimensions (2-D) are frequently employed to investigate soil porosity, due to their low cost and easy access (Pires et al., 2008Pires, L.F.; Cooper, M.; Cássaro, F.A.M.; Reichardt, K.; Bacchi, O.O.S.; Dias, N.M.P. 2008. Micromorphological analysis to characterize structure modifications of soil samples submitted to wetting and drying cycles. Catena 72: 297-304., 2009Pires, L.F; Reichardt, K.; Cooper, M.; Cássaro, F.A.M.; Dias, N.M.P.; Bacchi, O.O.S. 2009. Pore system changes of damaged Brazilian oxisols and nitosols induced by wet-dry cycles as seen in 2-D micromorphological image analysis. Anais da Academia Brasileira de Ciências 81: 151-161.; Passoni et al., 2014Passoni, S.; Borges, F.S.; Pires, L.F.; Saab, S.C.; Cooper, M. 2014. Software Image J to study soil pore distribution. Ciência Agrotecnologia 38: 122-128 (in Portuguese, with abstract in English).).
The analysis of soil images has been considered an efficient technique for evaluating soil structure and soil porosity by using soil thin sections and blocks of soil (Deeks et al., 1999; Cooper et al., 2010Cooper, M.; Vidal-Torrado, P.; Grimaldi, M. 2010. Soil structure transformations from ferralic to nitic horizons on a toposequence in southeastern Brazil. Revista Brasileira de Ciência do Solo 34: 1685-1699.). The direct observation of soil porosity is important to an understanding of how management practices affect the physical quality of soil (Clemente et al., 2005Clemente, E.P.; Schaefer, C.E.G.R.; Novais, R.F.; Viana, J.H.; Barros, N.F. 2005. Soil compaction around Eucalyptus grandis roots: a micromorphological study. Soil Research 43: 139-146.; Bagheri et al., 2012Bagheri, I.; Kalhori, S.B.; Akef, M.; Khormali, F. 2012. Effect of compaction on physical and micromorphological properties of forest soils. American Journal of Plant Sciences 3: 159-163.; Rasa et al., 2012Rasa, K.; Eickhorst, T.; Tippkötter, R.; Yli-Halla, M. 2012. Structure and pore system in differently managed clayey surface soil as described by micromorphology and image analysis. Geoderma 173-174: 10-18.).
The main applications of soil micromorphology and soil image analysis can be found in studies of soil structure changes due to different processes such as use, cultivation and management systems (Miedema, 1997Miedema, R. 1997. Applications of micromorphology of relevance to agronomy. Advances in Agronomy 59:119-169.). In the literature, there are studies addressing soil compaction (Murphy et al., 1977aMurphy, C.P.; Bullock, P.; Biswell, K.J. 1977a. The measurement and characterization of voids in soil thin sections by image analysis. Part II. Applications. Journal of Soil Science 28: 509-518.; Curmi et al., 1994Curmi, P.; Kerttzman, F.F.; Queiroz Neto, J.P. 1994. Degradation of structure and hydraulic properties in an Oxisol under cultivation (Brazil). p. 596-579. In: Ringrose-Voase, A.J.; Humpherys, G.S., eds. Soil micromorphology: studies in management and genesis. Elsevier, Amsterdam, Netherlands.; Clemente et al., 2005Clemente, E.P.; Schaefer, C.E.G.R.; Novais, R.F.; Viana, J.H.; Barros, N.F. 2005. Soil compaction around Eucalyptus grandis roots: a micromorphological study. Soil Research 43: 139-146.; Bagheri et al., 2012Bagheri, I.; Kalhori, S.B.; Akef, M.; Khormali, F. 2012. Effect of compaction on physical and micromorphological properties of forest soils. American Journal of Plant Sciences 3: 159-163.), cultivation and management systems (Pagliai et al.,1983Pagliai, M.; La Marca, M.; Lucamante, G. 1983. Micromorphometric and micromorphological investigations of a clay loam soil in viticulture under zero and conventional tillage. Journal of Soil Science 34: 391-403.; Pagliai et al., 1984Pagliai, M.; Marca, L.A.; Lucamante, G.; Genovese, L. 1984. Effects of zero and conventional tillage on the length and irregularity of elongated pores in a clay loam soil under viticulture. Soil and Tillage Research 4: 433-444.; Pagliai et al., 2003Pagliai, M.; Marsili, A.; Servadio, P.; Vignozzi, N.; Pellegrini, S. 2003. Changes in some physical properties of a clay soil in central Italy following the passage of rubber tracked and wheeled tractors of medium power. Soil and Tillage Research 73: 119-129.; Soares et al., 2005Soares, J.L.N.; Espindola, C.R.; Pereira, W.L.M. 2005. Physical properties of soil under intensive agricultural management. Scientia Agricola 62: 165-172.; Juhász et al., 2007Juhász, C.E.P.; Cooper, M.; Cursi, P.R.; Ketzer, A.O.; Toma, R.S. 2007. Savanna woodland soil micromorphology related to water retention. Scientia Agricola 64: 344-354.; Rasa et al., 2012Rasa, K.; Eickhorst, T.; Tippkötter, R.; Yli-Halla, M. 2012. Structure and pore system in differently managed clayey surface soil as described by micromorphology and image analysis. Geoderma 173-174: 10-18.), effect of wetting and drying cycles on the structure of tropical soil (Pires et al., 2008Pires, L.F.; Cooper, M.; Cássaro, F.A.M.; Reichardt, K.; Bacchi, O.O.S.; Dias, N.M.P. 2008. Micromorphological analysis to characterize structure modifications of soil samples submitted to wetting and drying cycles. Catena 72: 297-304.), soil structure regeneration with and without self-mulching (Pillai-McGarry and Collis-George, 1990aPillai-McGarry, U.P.P.; Collis-George, N. 1990a. Laboratory simulation of the soil surface morphology of self-mulching and non-selfmulching vertisols. 1. Materials, method and preliminary results. Australian Journal of Soil Research 28: 129-139. and 1990bPillai-McGarry, U.P.P.; Collis-George, N. 1990b. Laboratory simulation of the soil surface morphology of self-mulching and non-self-mulching vertisols. 2. Quantification of surface features. Australian Journal of Soil Research 28: 141-152.), application of fertilizers, manures, and organic materials (Pulleman et al., 2005Pulleman, M.M.; Six, J.; Uyl, A.; Marinissen, J.C.Y.; Jongmans, A.G. 2005. Earthworms and management affect organic matter incorporation and microaggregate formation in agricultural soils. Applied Soil Ecology 29: 1-15.; Zanuzzi et al., 2009Zanuzzi, A.; Arocena, J.M.; Mourik, J.M. van; Faz Cano, A. 2009. Amendments with organic and industrial wastes stimulate soil formation in mine tailings as revealed by micromorphology. Geoderma 154: 69-75.), surface crusting (Castilho et al., 2015Castilho, S.C.P.; Cooper, M.; Silva, L.F.S. 2015. Micromorphometric analysis of porosity changes in the surface crusts of three soils in the Piracicaba region, São Paulo state, Brazil. Acta Scientiarum. Agronomy 37: 385-395.) and soil fauna activity (Castellanos-Navarrete et al., 2012Castellanos-Navarrete, A.; Rodriguez-Aragonés, C.; Goede, R.G.M.; Kooistra, M.J.; Sayre, K.D.; Brussaard, L.; Pulleman, M.M. 2012. Earthworm activity and soil structural changes under conservation agriculture in central Mexico. Soil and Tillage Research 123: 61-70.; Piron et al., 2012Piron, D.; Pérès, G.; Hallaire, V.; Cluzeau, D. 2012. Morphological description of soil structure patterns produced by earthworm bioturbation at the profile scale. European Journal of Soil Biology 50: 83-90.).
Image processing software allows for the construction of custom applications to extract specific data from an image. In the case of soil images, the target may be quantitative data extracted from the pore system. The Noesis Visilog software was used for evaluating the pore system of weathered soils when they are subjected to wetting and drying cycles (Pires et al., 2009Pires, L.F; Reichardt, K.; Cooper, M.; Cássaro, F.A.M.; Dias, N.M.P.; Bacchi, O.O.S. 2009. Pore system changes of damaged Brazilian oxisols and nitosols induced by wet-dry cycles as seen in 2-D micromorphological image analysis. Anais da Academia Brasileira de Ciências 81: 151-161.). The open-source software ImageJ was successfully used to quantify the total porosity (%), total number of pores and pore size distribution for two Brazilian soils by using soil samples impregnated with resin (Passoni et al., 2014Passoni, S.; Borges, F.S.; Pires, L.F.; Saab, S.C.; Cooper, M. 2014. Software Image J to study soil pore distribution. Ciência Agrotecnologia 38: 122-128 (in Portuguese, with abstract in English).).
The lack of a simple methodology for the quick quantification of the shape, number, and size distribution of the pores has hampered the use of image-based micromorphological studies of soils. The aim of this study is to present and describe a software program that provides a quick and easy analysis of soil porosity from data extracted from 2-D images.
Materials and Methods
A software program, named SPIA (Soil Pore Image Analysis), was developed to classify soil porosity according to size, shape or the combination of size and shape from raw data obtained by image analysis processes using the Noesis Visilog 5.4. software which was written in C++, using orientation to objects and the Qt 5 framework. This structure allows for the development of software that can be applied to different operational machines/systems (multi-platforms) with little or no alteration in the source code.
Input data to SPIA
The input data for SPIA were obtained from soil blocks which were first dried and then impregnated with a solution containing polyester resin, styrene monomer, catalyst, and a fluorescent pigment, following the procedures described by Murphy (1986)Murphy, C.P. 1986. Thin Section Preparation of Soils and Sediments. A.B. Academic, Berkhamsted, UK. and Castro et al. (2003)Castro, S.S.; Cooper, M.; Santos, M.C.; Vidal Torrado, P. 2003. Soil micromorphology: concepts and applications. Topics in Soil Science 3: 107-164 (in Portuguese).. The soil blocks (undisturbed samples) were collected using cardboard boxes with dimensions of 0.07 m × 0.12 m × 0.06 m.
For the quantification of porosity, soil blocks were illuminated with ultraviolet light and photographed with a digital camera featuring a charge-coupled device (CCD) image sensor, coupled to a binocular microscope. A large number of photomicrographs of 12 mm × 15 mm (180 mm2) were randomly obtained from each soil block. We digitalized these images with a spatial resolution of 1024 × 768 pixels, each pixel corresponding to an area of 156.25 µm2, a spectral resolution of 256 shades of grey, using a 10× optical lens. Each image was subjected to void segmentation by grayscale thresholding. Subsequently, the images were converted to binary form and labeled by the image analysis program, Noesis Visilog 5.4. The labeling operation allowed for recognition and individualization of voids in each binary image using a connection factor.
Next, the Noesis Visilog 5.4 quantified both the basic and derived variables. The first refers to the image void space (assumed to be pores) and includes the area, number of objects, and for each object, its perimeter, horizontal and vertical Feret diameters, as well as its horizontal and vertical projections. The derived variables are a combination of two or more basic variables which allow for a complete characterization of the soil pores (Murphy et al., 1977aMurphy, C.P.; Bullock, P.; Biswell, K.J. 1977a. The measurement and characterization of voids in soil thin sections by image analysis. Part II. Applications. Journal of Soil Science 28: 509-518.). These variables are then used to classify the void spaces, according to a combination of shapes and sizes. SPIA was developed to optimize this procedure. Alternative image analysis software can be used to generate the input file although SPIA requires a standard format for the input file. Figure 1 presents an example with five observations of the variables required and the sequence that needs to be followed to prepare the input file for SPIA.
− Illustration of the standard format required as input file for SPIA. Index = object (pore) identification; FirstPointX and FirstPointY = Object (pore) coordinates in the image; Area μm2 = pore area in μm2; Shape_AP = pore shape index I1 (refer to Equation 1 in this paper); CP = Crofton Perimeter; EqDiam = Equivalent Diameter; FD = Feret Diameter at a given angle (numbers following FD represent the angles of FD measurement); Intercept = number of intercepts measured on a pore at a given angle (numbers following Intercept represent the angles of measurement); Orientation = angle of orientation of the pore.
Image analysis is only able to provide quantification of macro and mesopores. Smaller pores are not quantified because their sizes are beyond the resolving power of the optical microscope (Bullock et al., 1985Bullock, P.; Fedoroff, N.; Jongerius, A.; Stoops, G.; Tursina, T.; Babel, U. 1985. Handbook for Soil Thin Section Description. Waine Research Publications, Wolverhampton, UK.). According to Bullock et al. (1985)Bullock, P.; Fedoroff, N.; Jongerius, A.; Stoops, G.; Tursina, T.; Babel, U. 1985. Handbook for Soil Thin Section Description. Waine Research Publications, Wolverhampton, UK., mesopores have diameters between 50 and 500 µm while the diameters of macropores fall in the range of 500 to 5000 µm. Thus, in the text the total area of pores are related to pore diameters between 50 and 5000 µm.
The input files were generated using Noesis Visilog. However, other software can be used provided the data file is in a standard format.
Data calculated by SPIA
SPIA classifies the pore space based on a combination of their shape and size with the equivalent diameter (EqDiam) classes. The output of SPIA comprises the total number of pores and the percentage of the total area of pores occupied for each combination case. The software also presents descriptive statistics (mean, 1st quartile, median, 3rd quartile, minimum and maximum values, standard deviation, variance and the coefficient of variation) of the output parameters for the total number of images evaluated.
The shapes are defined according to Cooper et al. (2010)Cooper, M.; Vidal-Torrado, P.; Grimaldi, M. 2010. Soil structure transformations from ferralic to nitic horizons on a toposequence in southeastern Brazil. Revista Brasileira de Ciência do Solo 34: 1685-1699.. The authors classified the pores into three groups: rounded (channels and isolated vughs), elongated (planar voids) and complex (packing voids and chambers).
Two indices are used to establish the void shape. The first index, I1, is used to distinguish rounded from elongated voids (Equation 1). A value of 1 for I1 defines a perfectly circular pore, values greater than 1 indicate that the shape of the pore deviates from the circular (Bouma et al., 1977Bouma, J.; Jongerius, A.; Boersma, O.H.; Jager, A.; Schoonderbeek, D. 1977. The function of different types of macropores during saturated flow through four swelling soil horizons. Soil Science Society of America Journal 41: 945-950.).

P, perimeter of pore area (μm); A, pore area (μm2).
The second index, I2 (Equation 2), used in conjunction with I1, allows for greater accuracy in the assignment of a pore to a specific shape group.

where NI represents number of intercepts of an object in the direction i (i = 0°, 45°, 90°, and 135°); DF, Feret diameter of an object in the direction j (j = 0° and 90°); m, number of i directionsand n, number of j directions.
Table 1 presents the rule used for the classification of the pores according to shape, using the I1 and I2 indices. Pores with I1 ≤ 5 are classified as rounded. For pores where 5 < I1 ≤ 25, an inspection of the second index I2 is required to determine whether the pore should be classified as elongated or complex. All pores with I1 > 25 are classified as complex, regardless of the value of I2.
The pores of each shape group were divided into three different size classes (Table 2).
Next, SPIA calculates the number of pores in each class and the percentage of the total area of pores corresponding to these pore classes (Ptsize) (Equation 3). The total area of pores (Tap) was calculated as the ratio of the area of all pores to the total area of the image (Hallaire and Cointepas, 1993Hallaire, V.; Cointepas, J.P. 1993. Characterization of the macropores of an orchard soil by image analysis = Caractérisation de la macroporosité d’ un sol de verger par analyse d’ image. Agronomie 13: 155-164 (in French with abstract in English).). The Tap value is a function of the resolution of the image and the area corresponding to a single pixel.

where ASS represents areas of the pores of a specified shape and size (μm2); AT, total area (μm2) and Tap, total area of pores (%).
SPIA then classifies pores according to shape types and equivalent diameter (EqDiam). Noesis Visilog returns equivalent diameter values, which are used for rounded and complex shaped pores. In the case of elongated pores, the equivalent diameter (WidthElong) is calculated by Equation 4. We defined eight equivalent diameter classes: 20-50 μm, 50-100 μm, 100-200 μm, 200-300 μm, 300-400 μm, 400-500 μm, 500-1000 μm, >1000 μm. The shape types are the same as those presented in Table 1.

where CP represents Crofton perimeter (calculated by the image analysis software). The Crofton perimeter counts the intercept numbers along major directions and corrects for non-square pixels.
Once the individual pores have been classified, the software calculates the number of pores for each combination of shape and equivalent diameter and the percentage of the total area of pores corresponding to these pores (PtEqDiam) (Equation 5).

where ASEq represents area of the pores of a specified shape and equivalent diameter and AT, total area.
Finally, SPIA presents minimum and maximum values for pore area and equivalent diameter over the range of pores in an image.
Results and Discussion
Figure 2 presents the user interface of SPIA. Fields are provided for the width and height of the images, which represent the image resolution, and for Pixel width and Pixel height, which define the size of a pixel. The button Add file opens a new window through which the user can select the input file to be added to the list of files for processing. Figure 2 as an example, five loaded input files (e.g. D:\Spia_Input /input1.txt). The user can remove a file from the list by selecting it and clicking on the button Remove File. Processing of the data in the input files is initiated by clicking on the button Process files.
− User interface for the software created for the analysis of soil porosity from images previously processed by Noesis Visilog 5.4. D:\Spia_Input /input1.txt, D:\Spia_Input /input2.txt, D:\Spia_Input /input3.txt, D:\Spia_Input /input4.txt and D:\Spia_Input /input5.txt are output files from Visilog.
SPIA generates four main output files, containing the results of the calculations and analysis performed.
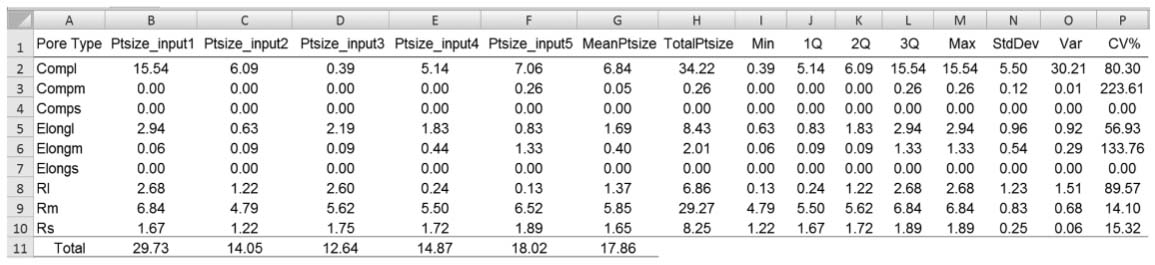
The files count-summary-type_size and ptsize-summary-type_size present the results for the characterization of pores according to their shape and size. The count-summary-type_size presents the number of pores according to shape and size (NPore) (Figure 3). The ptsize-summary-type_size presents the percentage of Tap (Ptsize) corresponding to that shape and size of pore (Figure 4). The last file columns of both files display the summary statistics of the processed images. The summary columns contain means and totals of Ptsize (MeanPtsize, TotalPtsize) and the number of pores (MeanNPore and TotalNPore), followed by minimum, first quartile, median, third quartile, maximum, standard deviation (StdDev), variance (Var) and coefficient of variation for the Ptsize (CV%).
− Sample output, file count-summary-type_size, from the analysis of five images pre-processed by Noesis Visilog; the pores were classified by shape and size according to Table 1.
− Sample output, file ptsize-summary-type_size, from the analysis of five images pre-processed by Noesis Visilog; the pores were classified by type and size of pore (Ptsize).
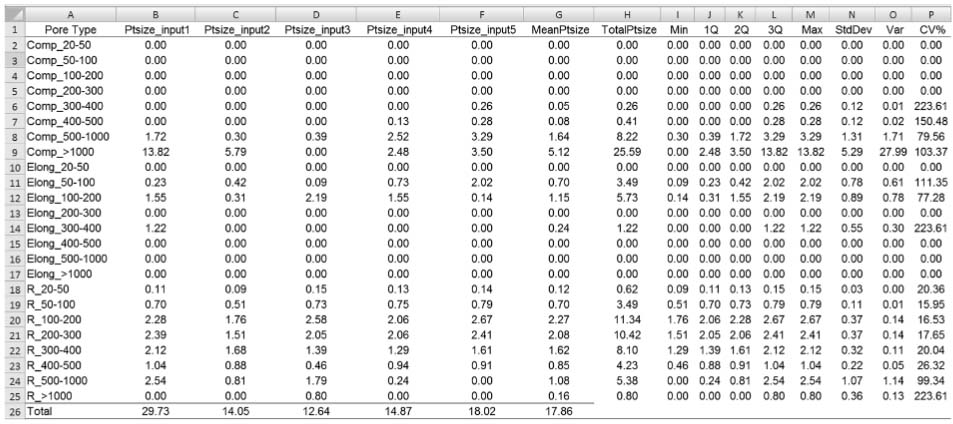
The files count-summary-type_class and ptsize-summary-type class present the results obtained when the pores were classified by shape and equivalent diameter. The rows correspond to different combinations of shape and equivalent diameter, as indicated by the class labels in column A. The count-summary-type_class presents the number of pores according to shape and equivalent diameter (NPore) (Figure 5). The ptsize-summary-type_class presents the percentage of Tap (Ptsize) corresponding to shape and equivalent diameter (Figure 6). The subsequent columns contain the same sequence as the file count-summary-type_size and ptsize-summary-type_size, described previously.
− Sample output, file count-summary-type_class, from the analysis of five images pre-processed by Noesis Visilog; the pores were classified by shape and equivalent diameter.
− Sample output, file ptsize-summary-type_class, from the analysis of five images pre-processed by Noesis Visilog; the pores were classified by shape and equivalent diameter.
The file summary-minimax presents the minimum and maximum values for the area of a single pore in µm2 and mm2, for the equivalent diameter (EqDiam), and for the WidthElong (Figure 7). The values are given for each input file; global maximum and minimum values can be found under the column “General” for all the loaded files.
− Sample output, file summary-minimax, from the analysis of five images pre-processed by Noesis Visilog. This file contains minimum and maximum values for the area of a single pore (in µm2 and mm2), for the equivalent diameter (EqDiam in µm), and for the width of the elongated pores (WidthElong, in µm).
Finally, SPIA generates a file called results which contains the names of the files loaded (File) the total area of pores (Tap_μm2) and the number of pores (Npore) for each file (Figure 8). The number of errors found during the loading of each file is also reported (ErrorsFound). This is followed by the sum of the Tap (μm2) and the sum of the number of pores (NTotalPore) for the loaded files.
− File example of the result output file from the analysis of five images pre-processed by Visilog. This file contains the total porosity; the total number of pores and the number of errors found during the processing of the data.
Conclusions
We developed a user-friendly software (SPIA) for the analysis of soil porosity that uses data extracted from 2-D images. SPIA was shown to be a complementary tool in the analysis of soil porosity by digital image analysis. One of the advantages is that SPIA produces quick and precise quantifications and summaries of soil porosity, through a combination of pore classification by shape and size. The proposed software can be used for different applications in soil studies that need to quantify and qualify the pore space. SPIA is made available free of charge for non-commercial purposes and it can be acquired through contact with the authors of this paper. Future developments include the creation of graphs by the software. We hope that SPIA contributes to popularizing the application of soil micromorphometric studies through image analysis.
Acknowledgements
To the Brazilian National Council for Scientific and Technological Development (CNPq) and the São Paulo State Foundation for Research Support (FAPESP) for financial support and scholarship.
References
- Bagheri, I.; Kalhori, S.B.; Akef, M.; Khormali, F. 2012. Effect of compaction on physical and micromorphological properties of forest soils. American Journal of Plant Sciences 3: 159-163.
- Bouma, J.; Jongerius, A.; Boersma, O.H.; Jager, A.; Schoonderbeek, D. 1977. The function of different types of macropores during saturated flow through four swelling soil horizons. Soil Science Society of America Journal 41: 945-950.
- Bullock, P.; Fedoroff, N.; Jongerius, A.; Stoops, G.; Tursina, T.; Babel, U. 1985. Handbook for Soil Thin Section Description. Waine Research Publications, Wolverhampton, UK.
- Castellanos-Navarrete, A.; Rodriguez-Aragonés, C.; Goede, R.G.M.; Kooistra, M.J.; Sayre, K.D.; Brussaard, L.; Pulleman, M.M. 2012. Earthworm activity and soil structural changes under conservation agriculture in central Mexico. Soil and Tillage Research 123: 61-70.
- Castilho, S.C.P.; Cooper, M.; Silva, L.F.S. 2015. Micromorphometric analysis of porosity changes in the surface crusts of three soils in the Piracicaba region, São Paulo state, Brazil. Acta Scientiarum. Agronomy 37: 385-395.
- Castro, S.S.; Cooper, M.; Santos, M.C.; Vidal Torrado, P. 2003. Soil micromorphology: concepts and applications. Topics in Soil Science 3: 107-164 (in Portuguese).
- Clemente, E.P.; Schaefer, C.E.G.R.; Novais, R.F.; Viana, J.H.; Barros, N.F. 2005. Soil compaction around Eucalyptus grandis roots: a micromorphological study. Soil Research 43: 139-146.
- Cooper, M.; Vidal-Torrado, P.; Grimaldi, M. 2010. Soil structure transformations from ferralic to nitic horizons on a toposequence in southeastern Brazil. Revista Brasileira de Ciência do Solo 34: 1685-1699.
- Curmi, P.; Kerttzman, F.F.; Queiroz Neto, J.P. 1994. Degradation of structure and hydraulic properties in an Oxisol under cultivation (Brazil). p. 596-579. In: Ringrose-Voase, A.J.; Humpherys, G.S., eds. Soil micromorphology: studies in management and genesis. Elsevier, Amsterdam, Netherlands.
- Hallaire, V.; Cointepas, J.P. 1993. Characterization of the macropores of an orchard soil by image analysis = Caractérisation de la macroporosité d’ un sol de verger par analyse d’ image. Agronomie 13: 155-164 (in French with abstract in English).
- Juhász, C.E.P.; Cooper, M.; Cursi, P.R.; Ketzer, A.O.; Toma, R.S. 2007. Savanna woodland soil micromorphology related to water retention. Scientia Agricola 64: 344-354.
- Miedema, R. 1997. Applications of micromorphology of relevance to agronomy. Advances in Agronomy 59:119-169.
- Murphy, C.P. 1986. Thin Section Preparation of Soils and Sediments. A.B. Academic, Berkhamsted, UK.
- Murphy, C.P.; Bullock, P.; Biswell, K.J. 1977a. The measurement and characterization of voids in soil thin sections by image analysis. Part II. Applications. Journal of Soil Science 28: 509-518.
- Pagliai, M.; La Marca, M.; Lucamante, G. 1983. Micromorphometric and micromorphological investigations of a clay loam soil in viticulture under zero and conventional tillage. Journal of Soil Science 34: 391-403.
- Pagliai, M.; Marca, L.A.; Lucamante, G.; Genovese, L. 1984. Effects of zero and conventional tillage on the length and irregularity of elongated pores in a clay loam soil under viticulture. Soil and Tillage Research 4: 433-444.
- Pagliai, M.; Marsili, A.; Servadio, P.; Vignozzi, N.; Pellegrini, S. 2003. Changes in some physical properties of a clay soil in central Italy following the passage of rubber tracked and wheeled tractors of medium power. Soil and Tillage Research 73: 119-129.
- Passoni, S.; Borges, F.S.; Pires, L.F.; Saab, S.C.; Cooper, M. 2014. Software Image J to study soil pore distribution. Ciência Agrotecnologia 38: 122-128 (in Portuguese, with abstract in English).
- Pillai-McGarry, U.P.P.; Collis-George, N. 1990a. Laboratory simulation of the soil surface morphology of self-mulching and non-selfmulching vertisols. 1. Materials, method and preliminary results. Australian Journal of Soil Research 28: 129-139.
- Pillai-McGarry, U.P.P.; Collis-George, N. 1990b. Laboratory simulation of the soil surface morphology of self-mulching and non-self-mulching vertisols. 2. Quantification of surface features. Australian Journal of Soil Research 28: 141-152.
- Pires, L.F; Reichardt, K.; Cooper, M.; Cássaro, F.A.M.; Dias, N.M.P.; Bacchi, O.O.S. 2009. Pore system changes of damaged Brazilian oxisols and nitosols induced by wet-dry cycles as seen in 2-D micromorphological image analysis. Anais da Academia Brasileira de Ciências 81: 151-161.
- Pires, L.F.; Cooper, M.; Cássaro, F.A.M.; Reichardt, K.; Bacchi, O.O.S.; Dias, N.M.P. 2008. Micromorphological analysis to characterize structure modifications of soil samples submitted to wetting and drying cycles. Catena 72: 297-304.
- Piron, D.; Pérès, G.; Hallaire, V.; Cluzeau, D. 2012. Morphological description of soil structure patterns produced by earthworm bioturbation at the profile scale. European Journal of Soil Biology 50: 83-90.
- Pulleman, M.M.; Six, J.; Uyl, A.; Marinissen, J.C.Y.; Jongmans, A.G. 2005. Earthworms and management affect organic matter incorporation and microaggregate formation in agricultural soils. Applied Soil Ecology 29: 1-15.
- Rasa, K.; Eickhorst, T.; Tippkötter, R.; Yli-Halla, M. 2012. Structure and pore system in differently managed clayey surface soil as described by micromorphology and image analysis. Geoderma 173-174: 10-18.
- Soares, J.L.N.; Espindola, C.R.; Pereira, W.L.M. 2005. Physical properties of soil under intensive agricultural management. Scientia Agricola 62: 165-172.
- Zanuzzi, A.; Arocena, J.M.; Mourik, J.M. van; Faz Cano, A. 2009. Amendments with organic and industrial wastes stimulate soil formation in mine tailings as revealed by micromorphology. Geoderma 154: 69-75.
Edited by
Publication Dates
-
Publication in this collection
Jul-Aug 2016
History
-
Received
06 Feb 2015 -
Accepted
10 Oct 2015