Abstract
Many researchers have shown the potential of Synthetic Aperture Radar (SAR) images for agricultural applications, particularly for monitoring regions with limitations in terms of acquiring cloud free optical images. Recently, Brazil and Germany began a feasibility study on the construction of an orbital L-band SAR sensor referred to as MAPSAR (Multi-Application Purpose SAR). This sensor provides L-band images in three spatial resolutions and polarimetric, interferometric and stereoscopic capabilities. Thus, studies are needed to evaluate the potential of future MAPSAR images. The objective of this study was to evaluate multipolarized MAPSAR images simulated by the airborne SAR-R99B sensor to distinguish coffee, cotton and pasture fields in Brazil. Discrimination among crops was evaluated through graphical and cluster analysis of mean backscatter values, considering single, dual and triple polarizations. Planting row direction of coffee influenced the backscatter and was divided into two classes: parallel and perpendicular to the sensor look direction. Single polarizations had poor ability to discriminate the crops. The overall accuracies were less than 59 %, but the understanding of the microwave interaction with the crops could be explored. Combinations of two polarizations could differentiate various fields of crops, highlighting the combination VV-HV that reached 78 % overall accuracy. The use of three polarizations resulted in 85.4 % overall accuracy, indicating that the classes pasture and parallel coffee were fully discriminated from the other classes. These results confirmed the potential of multipolarized MAPSAR images to distinguish the studied crops and showed considerable improvement in the accuracy of the results when the number of polarizations was increased.
SAR; crop discrimination; multipolarized L-band; radar; remote sensing
CROP SCIENCE
Simulated multipolarized MAPSAR images to distinguish agricultural crops
Wagner Fernando SilvaI, § § Present address: ANA/SGI - Agência Nacional de Águas - Superintendência de Gestão da Informação, Setor Policial, área 5, quadra 3, bloco B - 70610-200 - Brasília, DF - Brasil. , * * Corresponding author < wagner.silva@ana.gov.br> ; Bernardo Friedrich Theodor RudorffI; Antonio Roberto FormaggioI; Waldir Renato ParadellaI; José Claudio MuraII
IINPE/DSR - Instituto Nacional de Pesquisas Espaciais - Divisão de Sensoriamento Remoto, Av. dos Astronautas, 1758 - 12227-010 - São José dos Campos, SP - Brasil
IIINPE/DPI - Instituto Nacional de Pesquisas Espaciais - Divisão de Processamento de Imagens
ABSTRACT
Many researchers have shown the potential of Synthetic Aperture Radar (SAR) images for agricultural applications, particularly for monitoring regions with limitations in terms of acquiring cloud free optical images. Recently, Brazil and Germany began a feasibility study on the construction of an orbital L-band SAR sensor referred to as MAPSAR (Multi-Application Purpose SAR). This sensor provides L-band images in three spatial resolutions and polarimetric, interferometric and stereoscopic capabilities. Thus, studies are needed to evaluate the potential of future MAPSAR images. The objective of this study was to evaluate multipolarized MAPSAR images simulated by the airborne SAR-R99B sensor to distinguish coffee, cotton and pasture fields in Brazil. Discrimination among crops was evaluated through graphical and cluster analysis of mean backscatter values, considering single, dual and triple polarizations. Planting row direction of coffee influenced the backscatter and was divided into two classes: parallel and perpendicular to the sensor look direction. Single polarizations had poor ability to discriminate the crops. The overall accuracies were less than 59 %, but the understanding of the microwave interaction with the crops could be explored. Combinations of two polarizations could differentiate various fields of crops, highlighting the combination VV-HV that reached 78 % overall accuracy. The use of three polarizations resulted in 85.4 % overall accuracy, indicating that the classes pasture and parallel coffee were fully discriminated from the other classes. These results confirmed the potential of multipolarized MAPSAR images to distinguish the studied crops and showed considerable improvement in the accuracy of the results when the number of polarizations was increased.
Keywords: SAR, crop discrimination, multipolarized L-band, radar, remote sensing
Introduction
Due to the continental dimension and the intense agricultural involvement of Brazil, information acquired from remote sensing images are important to various agricultural applications, such as crop monitoring, mapping and estimation of crop production (Galvão et al., 2009; Rizzi and Rudorff, 2007; Rudorff et al., 2010; Soares et al., 2008; Xavier et al., 2006). However, the availability of cloud free images during the primary growth period of summer crops is limited, particularly in tropical regions and, therefore, restricting the use of optical remote sensing imagery to monitor agricultural activities.
On the other hand, active microwave sensors such as Synthetic Aperture Radar (SAR), are independent of solar illumination and can acquire data almost unaffected by atmospheric conditions, making it possible to assure image acquisition at specific crop growth periods when crop and remote sensing parameters are best related. Various researchers have demonstrated the potential of SAR images for agricultural applications, with the best results obtained using multipolarized images (Formaggio et al., 2001; McNairn and Brisco, 2004; Stankiewicz, 2006; Silva et al., 2009; Ulaby et al., 1980). However, there is a lack of studies on the use of SAR considering the management characteristics and crops typically cultivated under Brazilian conditions.
In a recent technical-scientific cooperative agreement between Brazil and Germany, the National Institute for Space Research (Instituto Nacional de Pesquisas Espaciais - INPE) and the German Aerospace Agency (Deutsches Zentrum für Luft- und Raumfahrt - DLR) developed a feasibility study targeting a L-band SAR satellite for the Multi-Application Purpose SAR - MAPSAR. This is a light and innovative SAR based on INPE's Multi-Mission Platform. Its characteristics were defined by potential end-users of Brazil and Germany. The proposed small spaceborne SAR initiative should be strongly oriented to a quasi-operational ("application oriented") system. MAPSAR is dedicated to assessment, management and monitoring of natural resources and thematic mapping purposes for topography, vegetation and deforestation, geology, agriculture, hydrology, etc. Images are made available in three resolution modes (4 m, 10 m and 20 m). Three polarization modes (Single, Dual and Quad-Pol) are foreseen for all of these resolution modes. The incidence angle varies from 20º to 48.1º. The satellite has ascending and descending orbits and the capacity of lateral viewing by inclination of the platform, imaging a range of 395 km. Moreover, the sensor provides images with polarimetric, interferometric and stereoscopic capabilities. More detailed information about MAPSAR satellite and imaging possibilities can be appreciated in Schröder et al. (2005).
One of the steps of the MAPSAR feasibility study was the evaluation of simulated data for potential applications, among others, in geology (Rabelo et al., 2007), forestry (Santos et al., 2008) and agriculture. The present study is placed in the context of assessing the potential of MAPSAR images for agricultural applications and its specific objective was to evaluate the capability of distinguishing different crops in an intensive agricultural production region located in northeastern Brazil (Bahia State). Thus, multipolarized MAPSAR images were simulated from airborne acquired images. Crop fields were selected and the mean backscatter was used in graphical and cluster analyses.
Materials and Methods
Study area and agricultural crops
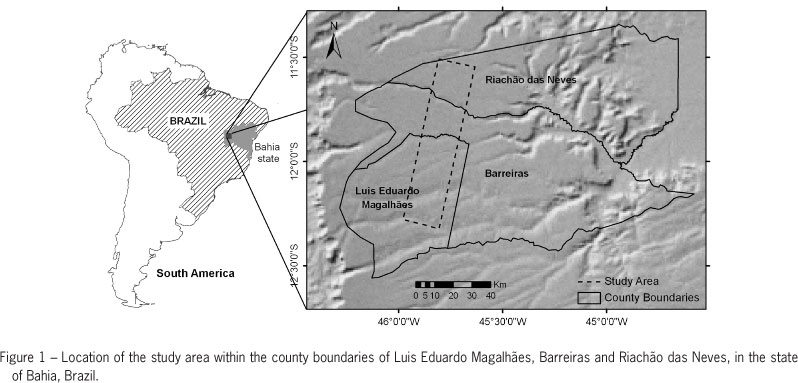
The study area is located in a region of intense agricultural activity in the western Bahia state, Brazil, within the boundaries of the counties Barreiras, Luis Eduardo Magalhães and Riachão das Neves, between longitudes of 45°30' W and 46°00' W and latitudes of 11°30' S and 12°20' S (Figure 1) comprising an area of 1,463 km2. This region has a flat relief and is characterized by the cultivation of diverse agricultural crops over large fields. However, emphasis was given to cotton, coffee and pasture crops that were well established at the time that SAR images were acquired (April 5, 2005). The mean areas of fields were: 1.36 km2 for cotton, 1.07 km2 for coffe and 2.16 km2 for pasture.
In order to acquire information related to the understanding of the interaction of microwave radiation with agricultural crops, field work was conducted simultaneously with image acquisition. Some of the conditions of the crops are described below.
Cotton: plants were, in general, at the beginning of the flowering stage, with heights between 1.5 m and 1.7 m. Most fields were homogeneous, with a high level of green biomass and complete soil coverage (Figure 2c1).

Coffee: plants were completely developed with a height between 2.2 m and 2.3 m, however, they were not at the flowering or fruiting stage. Due to the development of the plants, there was no soil exposure between plants inside rows. However, between rows there were free spaces, approximately 1.5 m wide, in which small weeds were growing (Figure 2c2). Coffee cultivation under central pivot irrigation is a common practice in this area and for this reason planting rows were arranged in concentric circles. Planting row direction, relative to the sensor look direction, is an important factor influencing backscatter in agricultural crops (Brisco et al., 1991; Formaggio et al., 2001; McNairn and Brisco, 2004). For this reason, the circular coffee fields were divided into two classes: Coffee-|| (Parallel Coffee, A in Figure 2b) and Coffee-⊥ (Perpendicular Coffee, B in Figure 2b). Thus, the same circular field has the both classes.
Pasture: grassland consisted of Brachiaria species with high level of green biomass, complete soil coverage and a height between 1.4 m and 1.7 m. Planting rows did not have a definite pattern and plant leaves and stems were randomly oriented within the canopy (Figure 2c3).
MAPSAR image simulation was performed with airborne images acquired from the SAR-R99B sensor of the Brazilian Air Force, in cooperation with the Brazilian Amazon Surveillance System (SIVAM). Ten flight lines were made with overlapping fields of view, from which strips of interest were utilized. The flights took place on April 5, 2005 and followed MAPSAR orbital imaging specifications, considering parameters such as wavelength (L band), polarization (HH, VV, HV), incident angle (45º - 53°), azimuth angle (282°), and strip width (30 km). Radiometric degradation occurred in the range of incidence angles between 39.57º and 44º and thus only the sectors from 45º to 53º were used. The acquired images were processed to correspond to the MAPSAR Medium Resolution Mode (HH, HV and VV polarizations, represented in 16-bit amplitude, 10 m spatial resolution and three looks). Antenna pattern calibration was performed and subsequently mosaics were generated that simulated MAPSAR images. Details of the simulation procedures and all MAPSAR configurations can be found in Mura et al. (2009).
The current study performs a detailed assessment of impact that simulated multipolarized MAPSAR data has on crop classification. The previous study made by Silva et al. (2009) exploited the fully polarimetric data from R99B airborne system for classification of agricultural crops. In this first study three attributes of the microwave signal were used (amplitude, polarization and phase). With the simulated MAPSAR images, amplitude and polarization were analyzed, through the modification of the original data by changing parameters (noise sigma nought, range bandwidth and azimuth bandwidth) according to the specifications of the orbital MAPSAR system. In addition, despite considering the same crops, the quantity of samples and the agricultural field used in this new research were distinct, which allows important complementary analyses between the current study and the previous one.
A thematic land use map was performed to depict the location of the agricultural fields in the study area (Figure 3). The map was generated using visual interpretation on a Landsat/TM image, acquired on April 11, 2005 (6 days after SAR acquisition) and based on GPS points and information acquired from field work.
Mean backscatter of agricultural crops
Based on the land use map and the ground truth information, large crop fields (greater than 52 ha) were selected to obtain the mean backscatter value to discriminate among crops. In order to reduce the influence of the incidence angle on backscatter, these fields were selected in the near range of strips comprising the mosaic, totaling: nine cotton fields, nine pasture fields, and 12 and 11 coffee fields with planting row direction parallel (Coffee-||) and perpendicular (Coffee-⊥) to the sensor look direction, respectively. Only one coffee field had no circular shape and its planting rows were parallel to the sensor look direction. Thus, there is an extra field in the Coffee-|| class in relation to Coffee-⊥ class. According to the field size, 300 to 600 pixels were randomly selected for each field, totaling at least 2700 pixels for each class. Mean backscatter values, in amplitude, of all selected pixels within each class  were graphically compared for crop discrimination considering single polarization. On the other hand, mean backscatter values of the randomly selected pixels within each field
  , were used for both cluster analysis (next section) and to obtain dispersion graphs.
Cluster Analysis
Cluster analysis allows a collection of data to be partitioned into relatively homogeneous groups, with the maximum variation possible between groups (Hair Jr. et al., 1998). It is based on coefficients of similarity between the objects in order to subsequently group them with the use of a clustering algorithm. This technique was employed for one polarization and for combinations of two and three polarizations. The was used as input. The software Statistica, version 6 (StatSoft, 2001) was used for analysis. The coefficient of similarity was the Chebychev's distance, which adopts as its measure the maximum distance between two objects, observed in one of the dimensions\axes (StatSoft, 2001), which in this case was defined by the polarizations. The Weighted Pair-Group Average (WPGMA) algorithm was used to form the clusters. In this algorithm, the distance between two clusters is given by the mean distance between all pairs of objects in the two different clusters and is weighted by the number of components contained in them (Sneath and Sokal, 1973; StatSoft, 2001).
The clusters were analyzed using dendrograms and named according to the predominant crop class. All selected fields were included in some cluster and, similarly to a non-supervised classification criterion, there could have been fields of classes erroneously included. When more than one cluster of the same crop was generated they were grouped into a single group. This allowed evaluating the results by means of confusion matrices and by calculating the overall accuracy, Kappa coefficient of agreement and percentage of correct predictions (Congalton and Green, 1999).
Results
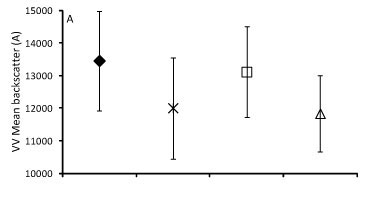
The mean backscatter values with one standard deviation for cotton, Coffee-⊥, Coffee-|| and pasture are shown in Figure 4. For the three single polarizations (VV, HV and HH) significant variation and overlap were observed among classes, indicating an overall poor ability in crop discrimination when using only one polarization. For VV polarization, the Coffee-⊥ class presented greater values than the Coffee-|| class. On the other hand, for HH polarization the Coffee-|| had a higher value than Coffee-⊥ (Figure 4a), which could be attributed to the different number of plants that are exposed to the microwave radiation depending on the row direction (Figure 2b). When planting rows are perpendicular to the sensor look direction, a higher number of plants and less exposure of the soil are viewed, in comparison with parallel rows. For HV polarization, pasture presented the highest mean value which was also the highest value for the pasture class when compared to the other two polarizations.
Dispersion graphs of the mean backscatter values for the combinations of two polarizations (VV-HV; HH-HV and HH-VV) are presented in Figure 5. The use of two polarizations provided partial differentiation of the crops. The VV-HV polarization combination enabled the differentiation of the greatest number of fields of the crops. In the HH-HV polarization combination, all pasture fields were separated from the other classes. However, the other crops were highly confused. Considering the results obtained with single polarizations (Figure 4), the pasture had the lowest values of mean backscattering, the lowest standard deviation for the HH and the highest one for the HV polarization, which contributed to the discrimination of this class when the two combined polarizations are used. The HH-VV polarization combination differentiated Coffee-|| well, and just one field of this crop was confused with the other classes.
The overall accuracy, the Kappa coefficient, the standard deviation and the percentage of correct predictions, for each class, obtained from the cluster analysis are summarized in Table 1. Better results were obtained by increasing the number of polarizations in the analysis, in agreement with the results obtained by McNairn et al. (2009); Stankiewicz (2006) and Silva et al. (2009). When considering single polarization, the results were not satisfactory. Overlaps among fields of different crops were observed, creating heterogeneous groups. The greatest Kappa coefficient (0.438) was obtained for HV polarization, while HH polarization was related to the lowest Kappa coefficient (0.323). However, this polarization distinguished pasture with 77.8 % of correct classification. This result can be explained by the lowest mean backscatter and standard deviation for the pasture class when compared to other classes of the HH polarization (Figure 4c).
For combinations of two polarizations, the best result was obtained with VV-HV (Kappa = 0.701). The Coffee-|| class had a correct prediction index of 91.7 % for the VV-HV and HH-VV combinations, that is, 11 of the 12 fields of this class were distinguished correctly. For the Coffee-⊥ class the best result was found for the combination HH-VV. Results from dendrograms and confusion matrices pointed out discrimination between the two coffee classes through the use of the VV-HV combination. However, for the HH-VV combination, two Coffee-⊥ fields were erroneously included in the Coffee-|| class, indicating that the VV-HV combination was more sensitive to planting row direction.
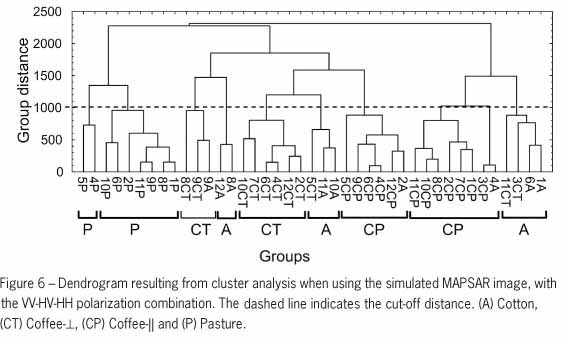
The HH-HV combination provided the lowest Kappa coefficient (0.479) considering the combination of two polarizations. However, this combination gave a 100 % accurate classification for the pasture class, confirming the results in the dispersion graph (Figure 5). Pasture class provided the greatest percentages of correct classification in these two single polarizations (Table 1). The simultaneous use of the three polarizations (VV-HV-HH) improved discrimination among classes, raising the Kappa coefficient to 0.804 (Table 1). The dendrogram resulting from cluster analysis using the three polarizations is presented in Figure 6. Nine clusters were obtained, which highlights the sensitivity of this combination of polarizations to variation in the mean backscatter values of the fields. Clusters with six to eight fields and little incorrect classification were formed for the pasture, Coffee-⊥, and Coffee-|| classes. There was no confusion between the two coffee classes. For the pasture and coffee-|| classes the percentage of correct classification was 100 % (Table 1), as there was no confusion for the pasture class, as can be confirmed by the formation of two homogeneous groups (P) in the dendrogram (Figure 6).
Although all the Coffee-|| fields were correctly distinguished from the other crops, two cotton fields were erroneously included in this class. For the cotton class, a lower percentage of correct classification was obtained by considering three polarizations, when compared to the VV-HV combination, which indicates that the HH polarization is not appropriate to differentiate cotton from the other crops.
All pasture fields were distinguished from the others crop fields. However, the fields 4P and 5P formed a separate group (Figure 6). By analyzing the values of mean backscattering from these fields, it was found that the field 5P had the highest value in the VV polarization, which may evidence that this field was denser than other pasture fields. Field 4P had the highest value in the VV polarization and the lowest in the HH, which may be caused by some soil management practices before planting, such as tilling or by the presence of weeds in this field. A more detailed field work would be necessary to confirm these possibilities. Bardiel and Herrmann (2011) utilized multitemporal images of high resolution from Terra SAR-X to classify land use in two agricultural regions from Europe. They tested the grouping of the crop classes in order to improve the classification results and observed the sensitivity of the SAR images in relation to different agricultural management practices adopted in each studied region. Additionally these authors distinguished agricultural fields that had soil preparation practices before planting from those fields without plowing.
Discussion
Graphical analyses and cluster analysis were performed using single polarizations, combination of two and of three polarizations, in order to evaluate the different possibilities of discriminating agricultural classes. By using single polarization, in general the result was not satisfactory, both in graphical analysis and in cluster analysis. However, some agricultural crops had interesting results. The Coffee-⊥ and Coffee-|| classes had higher values of backscattering in VV and HH polarizations, respectively, which was attributed to the influence of direction of the planting lines in relation to the sensor look direction.
In SAR backscatter, various factors such as frequency, incidence angle, planting row spacing and direction, soil and crop water content, and crop phenology, among others, jointly influence backscatter and, therefore, must be taken into consideration in the analyses (Brown et al., 1992; Baghdadi et al., 2009; Silva et al., 2009). In this sense, polarization is a relevant parameter influencing the interaction of microwave radiation with vegetation and for this reason it is an important source of information to distinguish among agricultural crops. VV and HH parallel polarizations interact most efficiently in agricultural crops that have predominantly vertical and horizontal structures, respectively (Brisco and Brown; 1998).
The coffee crop was well developed without soil exposure between plants within planting rows, but with spaces of approximately 1.5 m between planting rows. Thus, predominantly perpendicular planting rows, relative to the sensor look direction, exposed a greater number of plants than with predominantly parallel planting rows. Coffee plants are characterized by a vertical main stem and branches with a slight vertical inclination, which contributes to greater interaction with VV polarization. Moreover, L-band radiation is expected to penetrate the canopy, facilitating direct interaction with the vertical main stem of the coffee plant. On the other hand, planting rows parallel to the sensor look direction expose fewer numbers of plants plus the fact that the interval between planting row causes soil exposure, which influenced the higher backscattering from the HH polarization for the Coffee-|| class.
The response of the cross polarization is controlled by multiple-scattering volumetric mechanisms within the canopy whereas the parallel polarization is dominated by vertical or horizontal vegetation structures (Brisco and Brown, 1998). The pasture canopy is characterized by a non uniform plant, leaves and stem orientation favoring volumetric scattering and, therefore, increasing backscatter of HV polarization. For this reason the pasture class had the highest mean backscattering in this polarization, which was also higher than for the other crop classes. In addition, a soil contribution, due to multiple scattering of the cross-polarized signal, could also be considered (Dierking, 1999).
Although pasture fields presented the highest mean backscattering values at HV polarization, when we used cluster analysis, the better discrimination for this class was found for the HH polarization. Compared to other crop classes, pasture had the lowest mean backscattering and the lowest standard deviation in the HH polarization (Figure 4), which influenced the formation of the groups and the discrimination of classes. Silva et al. (2009) also found that pasture was best distinguished with polarization HH which also provided the best Kappa. McNairn et al. (2009) utilized PALSAR L-band images acquired on three different dates throughout the growing season in order to distinguish hay-pasture, soybean, corn and cereals. They performed classifications using a combination of all linear polarizations and with single polarizations, considering the three dates. The best result was found when all polarizations were used, but for the single polarization the best overall accuracy was obtained for the HV polarization (68.5 %). However, the best producer's accuracy for distinguishing hay-pasture was the HH polarization (63.3 %).
Better results were obtained with the combination of two polarizations, allowing a partial distinction of the crop classes. The results were a consequence of the different interactions of single polarizations, as discussed above. The best result was found for the combination of the VV-HV polarizations. The interactions from VV polarization within the two classes of coffee, depending on the prevailing planting direction, and the higher interaction from HV polarization with pasture, contributed to a better discrimination. On the other hand, all pasture fields were separated in the scatter plot when considering the combination HH-HV, as a function of the distinct values of the mean backscattering for these polarizations. The two classes of coffee were well distinguished from other crops in HH-VV and VV-HV combinations because of the influence of planting rows in these backscattering polarizations.
Although Silva et al. (2009) found the best Kappa index for the HH-VV combination, when they consider combination of two polarizations, the best distinction for the Coffee-|| class was obtained for the VV-HV and HH-VV combinations and for the Coffee-⊥ class the best combination was HH-VV. To distinguish crop classes using supervised classification, Silva et al. (2009) considered two cotton classes (different development stages). In the present study, there was only one class of cotton with all fields in the same stage of development. The canopy density of leaves and the water content vary with the development stage, and thus, these characteristics influence the interaction of microwave radiation, mainly for the HV polarization, that is characterized by the volumetric backscattering (Brisco and Brown, 1998; McNairn et al., 2009). Thus, Silva et al. (2009) reported greater confusion of the more developed pasture fields with the cotton and perpendicular coffee fields. Probably this confusion has caused a decrease in the classification performance when using the combination of VV-HV polarizations. Furthermore, the characteristics of the used images were distinct. Silva et al. (2009) used airborne images with spatial resolution of 6m, 10 looks and incidence angle between 52º and 68.5º.
In the present study, simulated satellite images with spatial resolution of 10 m, 3 looks and incidence angle of 45º and 53º were used. The spatial resolution and the number of looks can affect the distinction of objects in the image, the quantity of noise and the statistics, which influences the distinction of targets when statistical parameters are involved in the analysis (Frery et al., 2007). Moreover, the variation of the incidence angle affects the capacity of penetration of the microwave radiation into the canopy, being one of the parameters of the sensor that most influences backscattering and the appearance of features included in the image (Lewis and Henderson, 1998).
The use of the three polarizations further improved the distinction of the classes of crops. Homogeneous groups or groups with little confusion were formed, allowing a total distinction from pasture fields and Coffee-|| in relation to other crops and reinforcing the importance of using more than two polarizations to distinguish targets with different structures. However, the knowledge of the interaction mechanism of each polarization with the targets and its influence over the backscatter is critical to explore the use of SAR images to distinguish the crops. Because many factors affect backscattering, the use of more than one polarization in the classification of crops is important, because they are sensitive to the orientation of the targets, which helps to distinguish crops with different canopy structures. However, the backscattering is not explained in a direct way, because it depends on the processes of attenuation and interaction, which in turn depend on the frequency and the incidence angle, as well as the properties and characteristics of the plants.
In future studies, there is need of considering a greater number of crops and the use of automatic classifiers. A more detailed field work would facilitate the understanding of adverse outcomes. Polarimetric characteristics of the images and multitemporal analyses should be explored, which will allow evaluation of the sensitivity of these images to the different characteristics of the canopy during the growing season, aiming at operational crop monitoring.
Conclusions
Crop classes were distinguished with good accuracy (85.4 %), when using the three polarizations. Using single or dual polarizations some culture classes could be distinguished, as well as the understanding of the interaction of the radiation with agricultural targets could be explored. The investigation was carried out using only few samples that restrict an overall extrapolation for crops and ecosystems. However the results are indicative of the potential of the L-band multipolarized for agricultural monitoring
Acknowledgements
Special acknowledgements to the Operations and Management Center of the Amazonian Protection System (CENSIPAM) and to the Brazilian Air Force (FAB) for airborne data acquisition; to Dr. Edson E. Sano of the Brazilian Agricultural Research Service (EMBRAPA) and to the Brazilian Space Agency (AEB) for the support of the field study; to CNPq for research grants and to the reviewers for their valuable comments and contributions to the manuscript.
Received September 09, 2010
Accepted December 16, 2011
Edited by: Eros Artur Bohac Francisco / Luís Reynaldo Ferracciú Alleoni
- Baghdadi, N.; Boyer, N.; Todoroff , P.; El Hajj, M.; Bégué, A. 2009. Potential of SAR sensors TerraSAR-X, ASAR/ENVISAT and PALSAR/ALOS for monitoring sugarcane crops on Reunion Island. Remote Sensing of Environment 113: 1724-1738.
- Bardiel, D.; Herrmann, S. 2011. Multi-temporal land-cover classification of agricultural areas in two European regions with high resolution spotlight TerraSAR-X data. Remote Sensing 3: 859-877.
- Brisco, B.; Brown, R.J.; Snider, B.; Sofko, G.J.; Koehler, J.A.; Wacker, A.G. 1991. Tillage effects on the radar backscattering coefficient of grain stubble fields. International Journal of Remote Sensing 12: 2283-2298.
- Brisco, B.; Brown, R.J. 1998. Agricultural applications with Radar. p. 381-406. In: Henderson, F.M.; Lewis, A. J., eds. Principles and Applications of Imaging Radar: Manual of Remote Sensing. 3ed. John Wiley, New York , NY, USA.
- Brown, R.J.; Manore, M.J.; Poirier, S. 1992. Correlations between X-,C-, and L-band imagery within an agricultural environment. International Journal of Remote Sensing 13: 1645-1661.
- Congalton, R.G.; Green, K.G. 1999. Assessing the Accuracy of Remotely Sensed Data: Principles and Practices. Lewis Publishers, Boca Ratón, FL, USA.
- Dierking, W. 1999. Quantitative roughness characterization of geological surfaces and implications for radar signature analysis. IEEE Transactions on Geoscience and Remote Sensing 37: 2397-2412.
- Formaggio, A.R.; Epiphanio, J.C.N.; Simões, M.S. 2001. Radarsat backscattering from an agricultural scene. Pesquisa Agropecuária Brasileira 36: 823-830.
- Frery, A.C.; Correia, A.H.; Freitas, C.C. 2007. Classifying multifrequency fully polarimetric imagery with multiple sources of statistical evidence and contextual information. IEEE Transactions on Geoscience and Remote Sensing 45: 3098-3109.
- Galvão, L.S.; Roberts, D.A.; Formaggio, A.R.; Numata, I.; Breunig, F.M. 2009. View angle effects on the discrimination of soybean varieties and on the relationships between vegetation indices and yield using off-nadir Hyperion data. Remote Sensing of Environment 113: 846-856.
- Hair Jr, J.F.; Anderson, R.E.; Tatham, R.L.; Black, W.C. 1998. Multivariate Data Analysis. 5ed. Prentice Hall, Upper Saddle River, NJ, USA.
- Lewis, A.J.; Henderson, F.M. 1998. Radar fundamentals: the geoscience perspective. p. 131-181. In: Henderson, F.M.; Lewis, A.J., eds. Principles and Applications of Imaging Radar: Manual of Remote Sensing. 3ed. John Wiley, New York , NY, USA.
- McNairn, H.; Brisco, B. 2004. The application of C-band polarimetric SAR for agriculture: a review. Canadian Journal of Remote Sensing 30: 525-542.
- McNairn, H.; Shang, J.; Jiao, X.; Champagne, C. 2009. The contribuition of ALOS PALSAR multipolarization and polarimetric data to crop classification. IEEE Transactions on Geoscience and Remote Sensing 47: 3981-3992.
- Mura, J.C.; Paradella, W.R.; Dutra, L.V.; Santos, J.R.; Rudorff, B.F.T.; Miranda, F.P.; Silva, M.M.Q.; Silva, W.F. 2009. MAPSAR image simulation based on L-band polarimetric data from the SAR-R99B airborne sensor (SIVAM System). Sensors 9: 102-117.
- Rabelo, T.N.; Paradella, W.R.; Santos, A.R.; Rennó, C.D.; Galvão, L.S.; Mura, J.C.; Knust, S.S.A. 2007. Evaluating the discrimination of Cu-mineralized rock alteration products from simulated MAPSAR Images in the Curaçá Valley, Brazil. International Journal of Remote Sensing 28: 4701-4708.
- Rizzi, R.; Rudorff, B.F.T. 2007. MODIS sensor images combined with an agronomic model for estimating soybean yield. Pesquisa Agropecuária Brasileira 42: 73-80 (in Portuguese).
- Rudorff, B.F.T.; Aguiar, D.A.; Silva, W.F.; Sugawara, L.M.; Adami, M.; Moreira, M.A. 2010. Studies on the rapid expansion of sugarcane for ethanol production in São Paulo state (Brazil) using Landsat data. Remote Sensing 2: 1057-1076.
- Santos, J.R.; Mura, J.C.; Paradella, W.R.; Dutra, L.V.; Gonçalves, F.G. 2008. Mapping recent deforestation in the Brazilian Amazon using simulated L-band MAPSAR images. International Journal of Remote Sensing 29: 4879-4884.
- Schröder, R.; Puls, J.; Hajnsek, I.; Jochim, F.; Neff, T.; Kono, J.; Paradella, W.R.; Silva, M.M.Q.; Valeriano, D.M.; Maycira, P.F.C. 2005. MAPSAR: a small L-band SAR mission for land observation. Acta Astronautica 56: 35-43.
- Silva, W.F.; Rudorff, B.F.T.; Formaggio, A.R.; Paradella, W.R.; Mura, J.C. 2009. Discrimination of agricultural crops in a tropical semi-arid region of Brazil based on L-band polarimetric airborne SAR data. ISPRS Journal of Photogrammetry and Remote Sensing 64: 458-463.
- Sneath, P.H.A.; Sokal, R.R. 1973. Numerical Taxonomy: The Principles and Practices of Numerical Classifications. W.H. Freeman, San Francisco, CA, USA.
- Soares, D.M.; Galvão, L.S.; Formaggio, A.R. 2008. Crop area estimate from original and simulated spatial resolution data and landscape metrics. Scientia Agricola 65: 459-467.
- Stankiewicz, K.A. 2006. The efficiency of crop recognition on ENVISAT ASAR images in two growing seasons. IEEE Transactions on Geoscience and Remote Sensing 44: 806-814.
- StatSoft. 2001. Statistica: Data Analysis Software System; version 6. Statsoft, Tulsa, OK, USA.
- Ulaby, F.T.; Batlivala, P.P.; Janet, E.B. 1980. Crop identification with L-band radar. Photogrammetric Engineering and Remote Sensing 46: 101-105.
- Xavier, A.C.; Rudorff, B.F.T.; Moreira, M.A.; Alvarenga, B.S.; Freitas, J.G.; Salomon, M.V. 2006. Hyperspectral field reflectance measurements to estimate wheat grain yield and plant height. Scientia Agricola 63: 130-138.
Publication Dates
-
Publication in this collection
06 Mar 2012 -
Date of issue
June 2012
History
-
Received
09 Sept 2010 -
Accepted
16 Dec 2011