ABSTRACT:
Soybean crops occupy most areas in Rio Grande do Sul State and are highly dependent on rainfall since most of them are non-irrigated. Rainfall during the harvest period is often insufficient to meet the water demand, making water indicators an important tool for the crops. This study compared two approaches in the parameterization process of TVDI (Temperature-Vegetation Dryness Index) in a subtropical climate region of Brazil. The process used Moderate Resolution Imaging Spectroradiometer (MODIS) images of the surface temperature (TS) and Normalized Difference Vegetation Index (NDVI), with spatial resolutions of 1,000 m and periods of 8-16 d, respectively. The evaporative triangles for the TS/NDVI scatter plots were built either for each image (scene-specific parameterization) or for all images at once (crop-type parameterization). The rainfall data were obtained from meteorological stations located in the study site and the analysis period comprised two contrasting harvests regarding soybean yield (most important crop in the region). The scene-specific parameterization allowed to analyze water status in the study site by inspecting the wet and dry edge of each image and identifying the areas of stress in each one. TVDI crop parameterization showed that the model was able to determine the time and frequency of water stress events during the crop-seasons. TVDI crop-parameterization, therefore, is more consistent for crop monitoring and forecasting purposes.
Keywords:
parameterization; soybean; water status; satellite imagery
Introduction
Soybean crops cover most cultivated areas in Brazil (IBGE, 2015Instituto Brasileiro de Geografia e Estatística [IBGE]. 2015. IBGE Automatic Recovery System = Sistema IBGE de Recuperação Automática. Available at: http://www.sidra.ibge.gov.br/[Accessed Dec 16, 2015] (in Portuguese).
http://www.sidra.ibge.gov.br/...
), with significant variations in productivity between regions. The reasons for yield differences vary according to regions (Sentelhas et al., 2015Sentelhas, P.C.; Battisti, R.; Câmara, G.M.S.; Farias, J.R.B.; Hampf, A.C.; Nendel, C. 2015. The soybean yield gap in Brazil: magnitude, causes and possible solutions for sustainable production. Journal of Agricultural Science 153: 1-18.), but they are associated mainly to water deficit. Similarly, soybean crops occupy most cultivated areas in Rio Grande do Sul (RS) State and, because it is cultivated mostly under non-irrigated conditions, the crop is highly dependent on rainfall, which is often insufficient to meet crop demands. Therefore, amount and distribution of water supply impose the upper limit of soybean productivity in the state (Zanon et al., 2016Zanon, A.J.; Streck, N.A.; Grassini, P. 2016. Climate and management factors influence soybean yield potential in a subtropical environment. Agronomy Journal 108: 1447-1454.).
Given the extensive cultivated area in RS, parameters obtained from remote sensing techniques can be very useful to monitor the crop water status. The images allow obtaining surface information with a higher level of spatial and temporal detail than any other method does. Consequently, many studies (Esquerdo et al., 2011Esquerdo, J.C.D.M.; Zullo Júnior, J.; Antunes, J.F.G. 2011. Use of NDVI/AVHRR time-series profiles for soybean crop monitoring in Brazil. International Journal of Remote Sensing 32: 3711-3727.; Gusso et al., 2014Gusso, A.; Ducati, J.R.; Veronez, M.R.; Sommer, V.; Silveira Júnior, L.G. 2014. Monitoring heat waves and their impacts on summer crop development in southern Brazil. Agricultural Sciences 5: 353-364.; Valipour, 2015Valipour, M. 2015. Temperature analysis of reference evapotranspiration models. Meteorological Applications 22: 385-394.) have sought orbital indicators of the crop water status through impacts observed on soil surface using vegetation responses (changes in canopy vigor or architecture) or looking at meteorological data (changes in energy balance).
The vegetation index (VI) is a sensitive indicator of plant "greenness" and, therefore, can be indicators of water status (Huete et al., 2002Huete, A.; Didan, K.; Miura, T.; Rodriguez, E.P.; Gao, X.; Ferreira, L.G. 2002. Overview of the radiometric and biophysical performance of the MODIS vegetation indices. Remote Sensing of Environment 83: 195-213.; Gao et al., 2011Gao, Z.; Gao, W.; Chang, N. 2011. Integrating temperature vegetation dryness index (TVDI) and regional water stress index (RWSI) for drought assessment with the aid of LANDSAT TM/ETM+ images. International Journal of Applied Earth Observation and Geoinformation 13: 495-503.). However, the response of these indices is slow and it only occurs when stress has already affected plant development. On the other hand, surface temperature (TS), which is also obtained from orbital images, responds quickly to stress (Wan, 2008Wan, Z. 2008. New refinements and validation of the MODIS land-surface temperature/emissivity products. Remote Sensing of Environment 112: 59-74.). Based on this concept, Sandholt et al. (2002)Sandholt, I.; Rasmusen, K.; Andersen, J. 2002. A simple interpretation of the surface temperature/vegetation index space for assessment of surface moisture status. Remote Sensing of Environment 79: 213-224. proposed the index TVDI (Temperature-Vegetation Dryness Index) to monitor water conditions. This index is based on the relationship between VI and TS and the model allows parameterizing the vegetation water status between wet and dry limits of the evaporative triangle. TVDI has been applied to crop monitoring in several regions (Wang et al., 2006Wang K.; LI, Z.; Cribb, M. 2006. Estimation of evaporative fraction from a combination of day and night land surface temperatures and NDVI: a new method to determine the Priestley-Taylor parameter. Remote Sensing of Environment 102: 293-305.; Gao et al., 2011Gao, Z.; Gao, W.; Chang, N. 2011. Integrating temperature vegetation dryness index (TVDI) and regional water stress index (RWSI) for drought assessment with the aid of LANDSAT TM/ETM+ images. International Journal of Applied Earth Observation and Geoinformation 13: 495-503.; Holzman et al., 2014Holzman, M.E.; Rivas, R.; Piccolo, M.C. 2014. Estimating soil moisture and the relationship with crop yield using surface temperature and vegetation index. International Journal of Applied Earth Observation and Geoinformation 28: 181-192.; Liang et al., 2014Liang, L.; Zhao, S.; Qin, Z.; He, K.; Chen, C.; Luo, Y.; Zhou, X. 2014. Drought change trend using MODIS TVDI and its relationship with climate factors in China from 2001 to 2010. Journal of Integrative Agriculture 13: 1501-1508.), but it is not yet tested in large grain-producing areas in southern Brazil. Moreover, in most studies, the type of parameterization applied to TVDI and the consequences of using different approaches are not sufficiently explained. In this context, we compared TVDI performance to characterize water conditions in the humid subtropical climate of RS, using two approaches to the TVDI parameterization process.
Materials and Methods
Study site
Figure 1 shows the map of Rio Grande do Sul State, detailing the northwestern region with significant soybean production in southern Brazil. The study site covered the entire territory but focused on 216 municipalities, which are the largest soybean producers of the state (6.5 million hectares). The climate in the region is rainy subtropical, Cfa (warm summer, average temperature of the hottest month above 22 °C) and Cfb (warm summer, average temperature of the hottest month below 22 °C), according to Köppen's climate classification (Alvares et al., 2013Alvares, C.A.; Stape, J.L.; Sentelhas, P.C.; Gonçalves, J.L.M.; Sparovek, G. 2013. Köppen's climate classification map for Brazil. Meteorologische Zeitschrift 22: 711-728.).
Map showing the study site in Rio Grande do Sul State, Brazil, and detailing the subdivision of the mesoregions and limits of municipalities of the study site.
Background
The TVDI index is based on the dispersion dot-pattern obtained from NDVI and TS images, which can be shaped as an evaporative triangle or trapezoid, depending on the climatic condition and vegetation cover (Price, 1990Price, J.C. 1990. Using spatial context in satellite data to infer regional scale evapotranspiration. IEEE Transactions on Geoscience and Remote Sensing 28: 940-948.; Carlson et al., 1994; Long and Singh, 2012Long, D.; Singh, V.P. 2012. A Two-source trapezoid model for evapotranspiration (TTME) from satellite imagery. Remote Sensing of Environment 121: 370-388.). In general, the tendency is trapezoidal in hot climates with high vegetation cover (Carlson, 2007).
TVDI has been used by many experts to determine soil moisture and water availability in the soil-plant system at a regional scale (Sandholt et al., 2002Sandholt, I.; Rasmusen, K.; Andersen, J. 2002. A simple interpretation of the surface temperature/vegetation index space for assessment of surface moisture status. Remote Sensing of Environment 79: 213-224.; Gao et al., 2011Gao, Z.; Gao, W.; Chang, N. 2011. Integrating temperature vegetation dryness index (TVDI) and regional water stress index (RWSI) for drought assessment with the aid of LANDSAT TM/ETM+ images. International Journal of Applied Earth Observation and Geoinformation 13: 495-503.; Holzman et al., 2014Holzman, M.E.; Rivas, R.; Piccolo, M.C. 2014. Estimating soil moisture and the relationship with crop yield using surface temperature and vegetation index. International Journal of Applied Earth Observation and Geoinformation 28: 181-192.). The TVDI model allows to normalize the vegetation water status between the wet and dry limits of the evaporative triangle, with values between 0 (wet limit) and 1 (dry limit). Determining these limits is one of the critical points of the methodology, and the use of techniques to reduce subjectivity of the process is recommended (Yang et al., 2015Yang, Y.; Guan, H.; Long, D.; Liu, B.; Qin, G.; Qin, J.; Batelaan, O. 2015. Estimation of surface soil moisture from thermal infrared remote sensing using an improved trapezoid method. Remote Sensing 7: 8250-8270.). The correct parameterization of the model requires extreme water conditions to occur in the region to characterize the edges of the evaporative triangle. Especially when using images of low spatial resolution (pixel of 1,000 m or more), identifying and mapping dry and wet edges can be problematic, given the difficulty of finding small plots with representative water conditions (Roerink et al., 2000Roerink, G.J.; Su, B.; Menenti, M. 2000. S-SEBI: a simple remote sensing algorithm to estimate the surface energy balance. Physics and Chemistry of the Earth. Part B. Hydrology, oceans and atmosphere 25: 147-157.; Kustas et al., 2004Kustas, W.P.; Li, F.; Jackson, T.J.; Prueger, J.H.; Macpherson, J.L.; Wolde, M. 2004. Effects of remote sensing pixel resolution on modeled energy flux variability of croplands in Iowa. Remote Sensing of Environment 92: 535-547.). Sandholt et al. (2002)Sandholt, I.; Rasmusen, K.; Andersen, J. 2002. A simple interpretation of the surface temperature/vegetation index space for assessment of surface moisture status. Remote Sensing of Environment 79: 213-224. proposed to use large areas in the parameterization process to overcome these limitations, even when using low-resolution images.
The parameterization most frequently used in the analysis is the individual data (scene), which, as discussed by Sandholt et al. (2002)Sandholt, I.; Rasmusen, K.; Andersen, J. 2002. A simple interpretation of the surface temperature/vegetation index space for assessment of surface moisture status. Remote Sensing of Environment 79: 213-224., can be a limiting factor for the analysis of the index temporal pattern during the crop cycle, because the evaporative triangles are specific to each image, and TVDI is not comparable between them.
Obtaining TVDI (Temperature-Vegetation Dryness Index)
TVDI was calculated from the Moderate Resolution Imaging Spectroradiometer (MODIS) products. The TS and Normalized Difference Vegetation Index (NDVI) data had 1,000 m spatial resolution corresponding to accumulated periods of 8-16 d, respectively. The products covered h13v11 and h13v12 tiles, which were transformed from the sinusoidal projection to the geographic coordinates WGS 84 and after, subset the study area image, comprising only the area of Rio Grande do Sul State.
The period of analysis covered two crop-seasons, 2004-2005 and 2009-2010, which had contrasting water availability conditions (lower and higher water availability, respectively), with 12 NDVI and TS images for each season.
TVDI was obtained from the Equation (1) proposed by Sandholt et al. (2002)Sandholt, I.; Rasmusen, K.; Andersen, J. 2002. A simple interpretation of the surface temperature/vegetation index space for assessment of surface moisture status. Remote Sensing of Environment 79: 213-224.:
where: TS is the radiative surface temperature observed in a given pixel (K); TSmin is the minimum surface temperature (K), corresponding to the wet edge of the evaporative triangle (Figure 2); “a” and “b” are the linear and angular coefficients of the straight line representing the dry edge (Figure 2).
Schematic representation of the Evaporative Triangle, given by the relationship between surface temperature (TS) and normalized difference vegetation index (NDVI); TVDI = Temperature-Vegetation Dryness Index (TVDI); Source: Adapted from Sandholt et al. (2002)Sandholt, I.; Rasmusen, K.; Andersen, J. 2002. A simple interpretation of the surface temperature/vegetation index space for assessment of surface moisture status. Remote Sensing of Environment 79: 213-224..
The wet and dry edges were obtained from a scatter plot of NDVI versus TS delimiting the evaporative triangle (Figure 2). The steps were as follows: slicing the NDVI values into 100 intervals of 0.01; obtaining TS values for each NDVI interval; constructing the cumulative frequency histogram for each NDVI interval and identifying TS values corresponding to 2 % and 98 % occurrence; defining the pixels of the wet limit - all pixels with TS ≤ temperature corresponding to 2 %; and the dry limit - all pixels with TS ≥ temperature corresponding to 98 % (this procedure was performed for each of the 100 intervals, and subsequently the pixels of each limit and interval were grouped); determining the wet edge - calculating the average value of all pixels that compose the wet limit (value equivalent to TSmin); dry edge definition - linear regression fitting using all the pixels that comprise the dry limit.
These limits are used to normalize the model, as the model provides a stress index between 0 and 1 for each image. The opposite sides of this triangle are bare soil (low NDVI and high TS) and total vegetation cover (high NDVI and low TS). In partial coverage conditions, the smaller the TS, the more suitable the water conditions are and, therefore, the lower the TVDI.
Two approaches were used to obtain the TVDI parameters. The first was based on a scene-specific parameterization, which consisted of obtaining “a” and “b”parameters, and TSmin for each 12 images of each crop-season. The second approach consisted of grouping the pixels of all images of the crop-season in a single dispersion to ensure that all water availability conditions throughout crop development period were clustered in a single evaporative triangle.
The scene parameterization compared all “a” and “b” parameters and TSmin for each image and analyzed the evaporative triangle dispersions obtained on dates with different water conditions. In crop-type parameterization, the evaporative triangles of both crops were analyzed.
For both parameterization approaches, the spatial distribution of TVDI was analyzed across Rio Grande do Sul State for all images that covered soybean cycle (from Oct of the first year to Apr of the following year).
The TVDI ability to characterize the water status in the largest soybean cultivation area in the state was evaluated by comparing the mean rainfall data of the meteorological stations, Cruz Alta (-28.63° S and −53.6° W; 472.5 m), São Luiz Gonzaga (−28.4 ° S and −55.01° W; 245.11 m), and Passo Fundo (-28.21° S and −52.4° W; 684.05 m). The data were collected daily, but cumulative figures were calculated for 16 d to be compatible with the temporal resolution of MODIS images used in the profile analysis of TVDI over the crop cycle. In addition, to evaluate the TVDI performance obtained from parameterization by scene and crop-season, rainfall data analyzed scatterplots and correlation coefficients (p < 0.05) were used.
Results and Discussion
TVDI - scene parameterization
The parameters obtained in the scene parameterization showed significant differences between the two crop-seasons analyzed. The greatest variability was observed in the slope of the dry edge of the 2004-2005 crop-season, where “b” values ranged between −27.9 and −6.4. For the 2009-2010 crop-season, this parameter varied between −17.5 and −6.3 (Table 1). Sandholt et al. (2002)Sandholt, I.; Rasmusen, K.; Andersen, J. 2002. A simple interpretation of the surface temperature/vegetation index space for assessment of surface moisture status. Remote Sensing of Environment 79: 213-224. and Holzman et al. (2014)Holzman, M.E.; Rivas, R.; Piccolo, M.C. 2014. Estimating soil moisture and the relationship with crop yield using surface temperature and vegetation index. International Journal of Applied Earth Observation and Geoinformation 28: 181-192. stated that in areas with humid climate, parameters variability is more evident in years when the rainfall regime is below normal. Accordingly, this pattern was observed in the 2004-2005 crop-season.
Parameters a (intercept), b (slope), and TSmin (minimum temperature) used to calculate the Temperature-Vegetation Dryness Index (TVDI) in the scene parameterization for the 2004-2005 and 2009-2010 soybean crops-season, in Rio Grande do Sul, Brazil.
The TSmin data also showed variation, from 288 K to 301 K in 2004-2005 and 289 K to 298 K in 2009-2010. From Jan to Mar (soybean developmental peak), the TS-min was higher in 2004-2005 compared to the 2009-2010 crop-season, which was expected since temperature and water availability are closely associated (Goward et al., 2002Goward, S.N.; Xue, Y.; Czajkowski, K.P. 2002. Evaluating land surface moisture conditions from the remotely sensed temperature/VI measurements: an exploration with the simplified simple biosphere model. Remote Sensing of Environment 79: 225-242.; Liang et al., 2014Liang, L.; Zhao, S.; Qin, Z.; He, K.; Chen, C.; Luo, Y.; Zhou, X. 2014. Drought change trend using MODIS TVDI and its relationship with climate factors in China from 2001 to 2010. Journal of Integrative Agriculture 13: 1501-1508.).
Figures 3A and 3B show the triangles of the two scenes chosen to exemplify different water conditions. On 02 Feb 2005, the wet edge pixels had lower, close to 295 K, for higher rainfall (21 mm) compared to lower rainfall (6 mm) for 294 K, on 18 Feb 2005. The maximum temperatures and slopes of the dry edges are also different in the two images. On 18 Feb 2005, the slope (b = −27.9) and maximum temperatures were even higher, characterizing major contrast between pixels with lower and higher water availability in the region (Goward et al., 2002Goward, S.N.; Xue, Y.; Czajkowski, K.P. 2002. Evaluating land surface moisture conditions from the remotely sensed temperature/VI measurements: an exploration with the simplified simple biosphere model. Remote Sensing of Environment 79: 225-242.).
Dispersion between the vegetation index (NDVI) and surface temperature (TS) for images on 02 Feb 2005 (A) and 18 Feb 2005 (B) in Rio Grande do Sul.
The analysis of TVDI spatial distribution showed that regions with high and low index values occur in all images of both 2004-2005 (Figure 4) and 2009-2010 (Figure 5) crop-seasons. This is an intrinsic characteristic of the model when parameters are adjusted per scene because all values are normalized in relation to the scene dry and wet limits. Using this approach, the water status of the two crop-seasons looks very similar. It is known, however, that this was not the case since the rainfall values between 31 Oct and 23 Apr were different, 827 mm compared to 1,391 mm in the 2004-2005 and 2009-2010, respectively.
Spatial distribution of Temperature-Vegetation Dryness Index (TVDI) with scene parameterization for the 2004-2005 crop-season. Black circled areas are the state mesoregions (northwestern region is highlighted); the white areas correspond to cloud-covered regions detected from the surface temperature (TS) image.
Spatial distribution of Temperature-Vegetation Dryness Index (TVDI) with scene-parameterization for the 2009-2010 crop-season. Black circled areas are the state mesoregions (northwestern region is highlighted); the white areas correspond to cloud-covered regions detected from the surface temperature (TS) image.
TVDI - crop parameterization
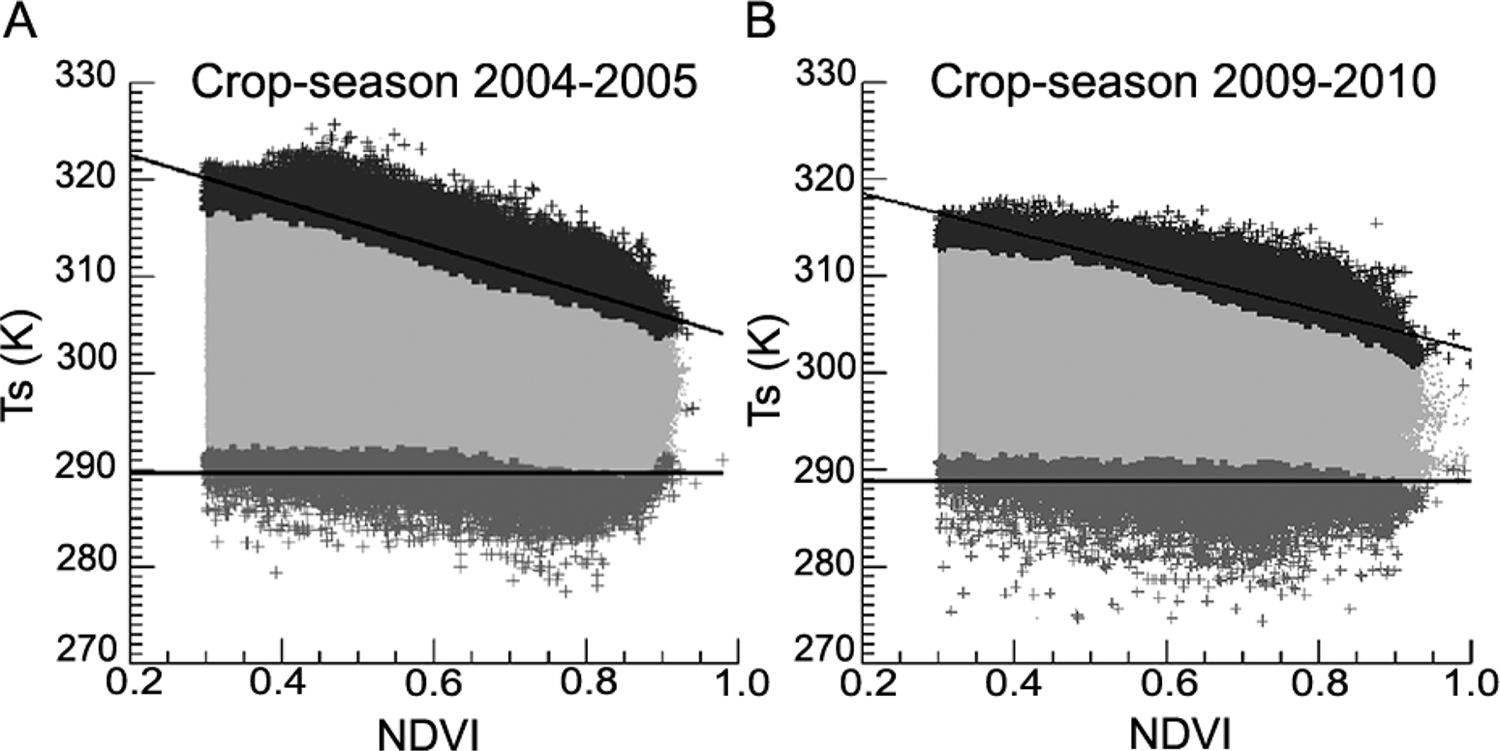
In the second approach, all NDVI and TS images of each crop-season were used to build the dispersion plots (Figures 6A and 6B). Therefore, the two resulting evaporative triangles show water status during the entire cycle. The objective was to compare the water conditions between images of the same crop-season. The comparison of the triangles showed a small decrease of the negative slope of the dry edge in 2009-2010 (b = −23.6 in 2004-2005 and b = −20.2 in 2009-2010) and a small decrease in TSmin (289.6 K in 2004-2005 and 288.8 K in 2009-2010). The similarity between the triangles of these two crop-seasons with very different water conditions may indicate that it is possible to obtain a characteristic triangle of the climate and environmental conditions for Rio Grande do Sul. This conclusion can be confirmed by analyzing a large number of crop-seasons, and if this is the case, it should be possible to compare different years, which is strategic in crop forecasting systems.
Dispersion between the vegetation index (NDVI) and surface temperature (TS) for the 2004-2005 (A) and 2009-2010 (B) crop-season in Rio Grande do Sul.
This important result seems to indicate a way to make feasible multitemporal studies on the water condition using TVDI. However, future analyses need to be made to evaluate how variations in the incidence of solar radiation influence on TS determination, considering the differences over time during the crop or even between different crop seasons. Moran et al. (1994) recommended that parameterization be done by scene to ensure approximately constant conditions of solar radiation throughout the study area. In this case, variations in soil moisture would be the main determinant of TS variations.
Comparison between parameterization approaches
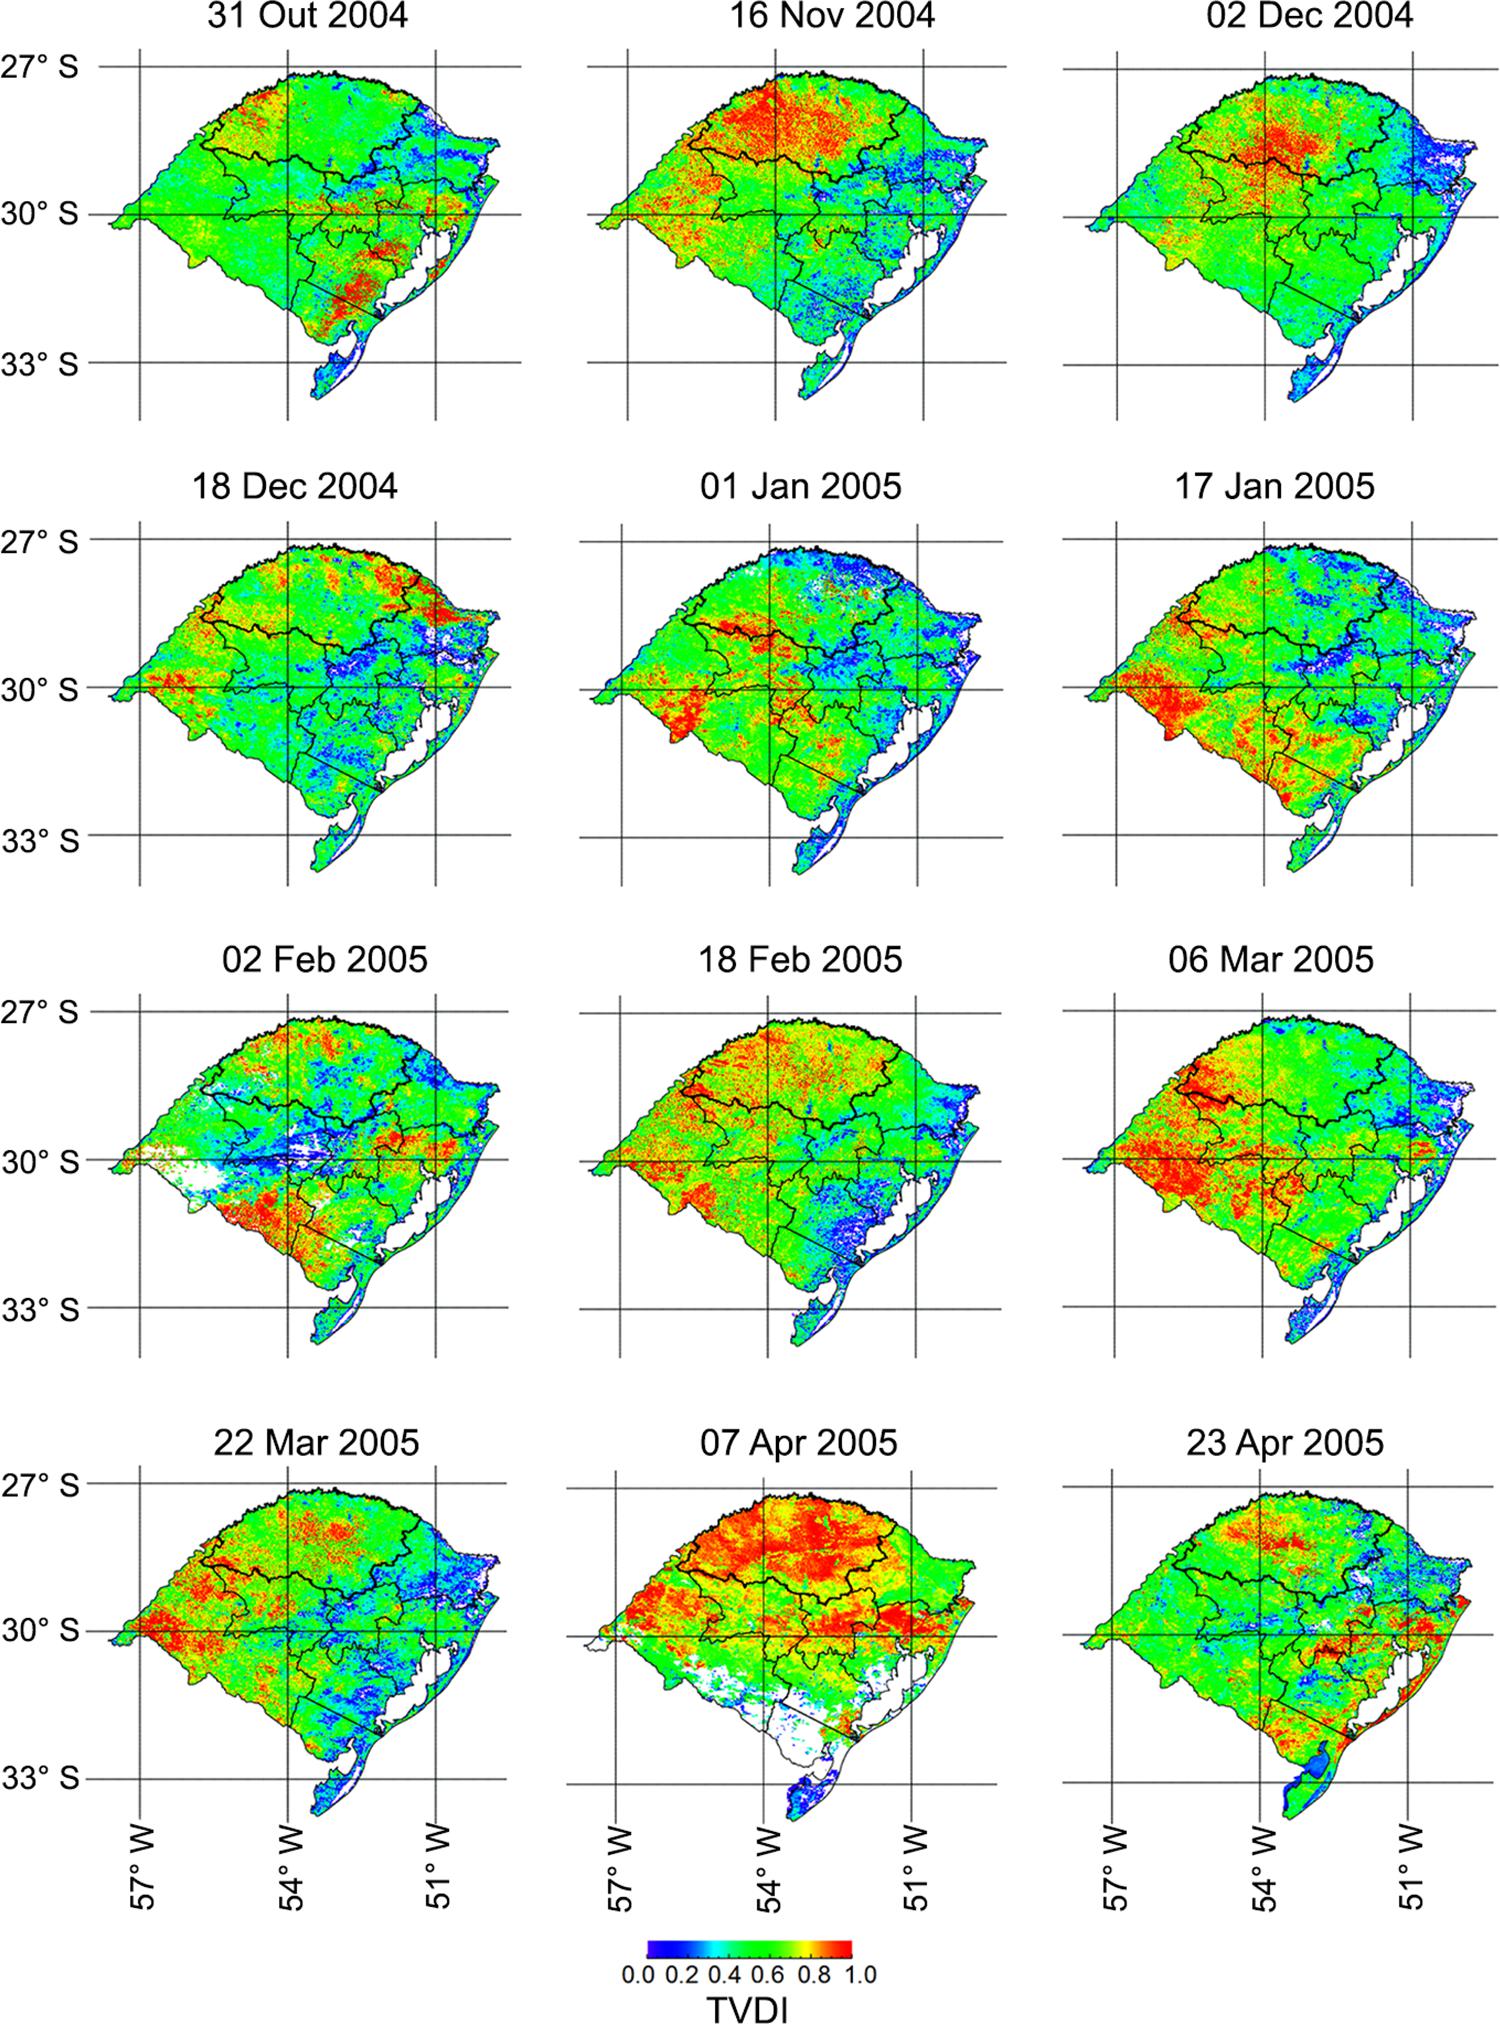
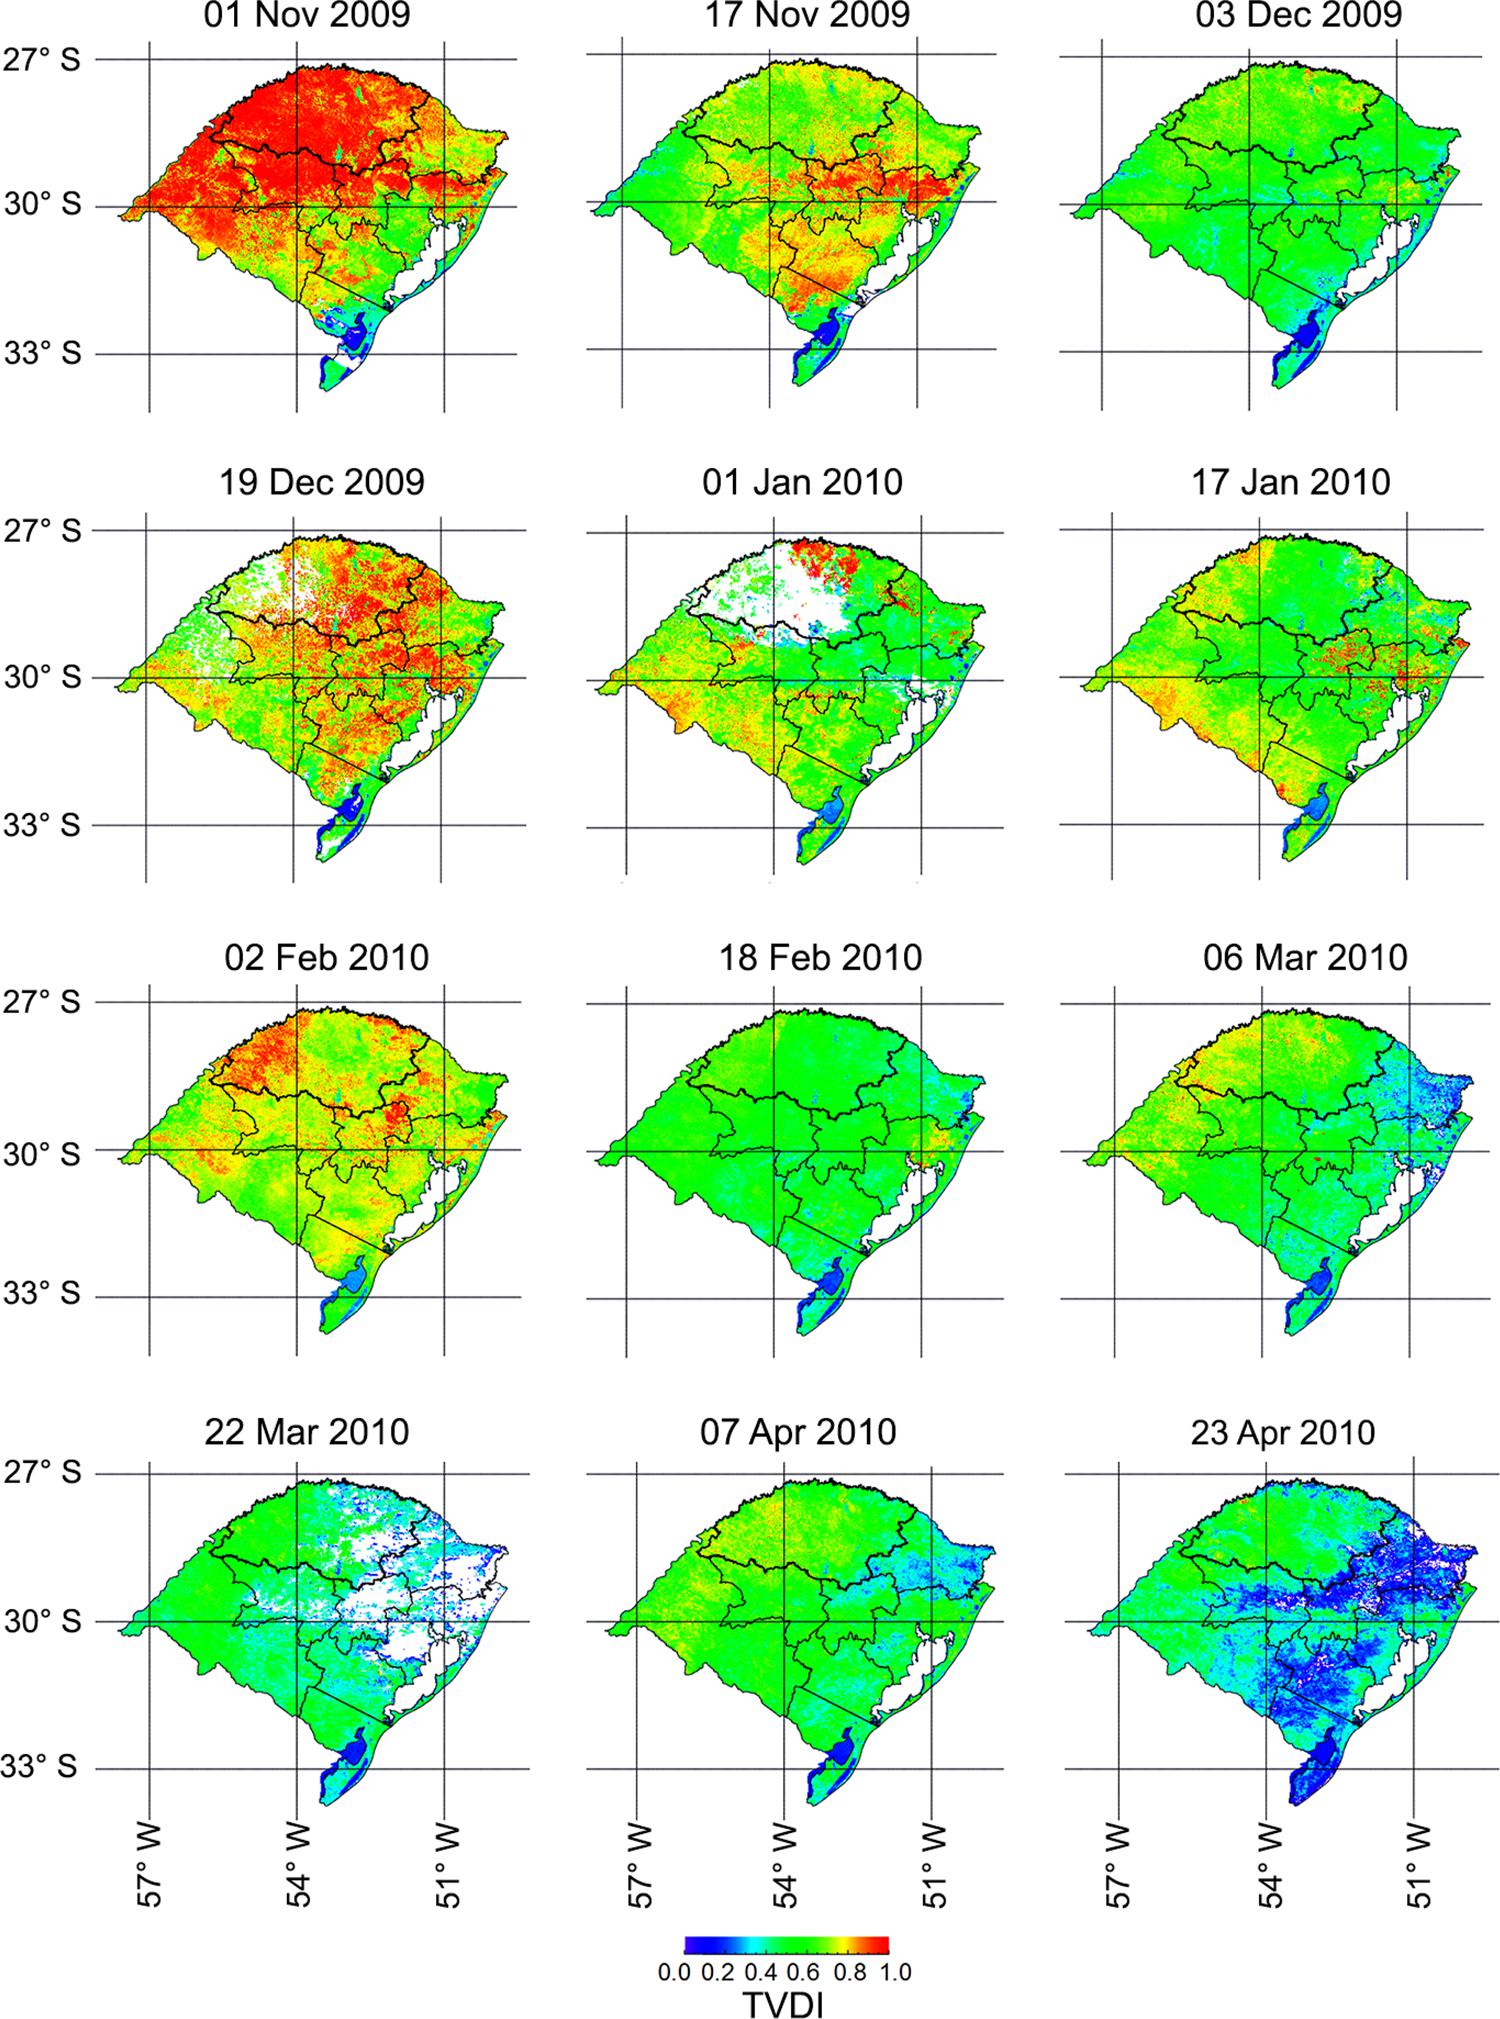
Crop parameterization of TDVI images (Figures 7 and 8) showed a very different spatial distribution compared to that obtained with scene parameterization (Figures 4 and 5). Several images of the 2004-2005 and 2009-2010 crop-season showed low TVDI variability over Rio Grande do Sul, as observed on 31 Oct, 16 Nov, 18 Dec, 02 Feb, 22 Mar and 07 Apr, of the 2004-2005 crop-season (Figure 7) and 03 Dec, 18 Feb, 06 Mar, 22 Mar and 07 Apr of the 2009-2010 crop-season (Figure 8). Others, however, showed a high contrast of the index values, highlighting the differences between regions. The crop approach, therefore, allowed to identify the areas and periods of the crop cycle when water restrictions occurred (higher TVDI indices), which was not possible when analyzing the images that resulted from the scene-specific parameterization approach.
Spatial distribution of Temperature-Vegetation Dryness Index (TVDI) with crop-parameterization for the 2004-2005 crop-season. Black circled areas are the state mesoregions (northwestern region is highlighted); the white areas correspond to cloud-covered regions detected from the surface temperature (TS) image.
Spatial distribution of Temperature-Vegetation Dryness Index (TVDI) with crop-parameterization for the 2009-2010 crop-season. Black circled areas are the state mesoregions (northwestern region is highlighted); the white areas correspond to cloud covered regions detected from the surface temperature (TS) image.
In the 2004-2005 crop-season (Figure 7), five of the 12 processed images showed high TVDI in the northern region (area of increased soybean production), which occurred in the period of great vegetative development of the plant (high leaf area index). The high values observed especially in Feb and Mar, months when the crop is more sensitive to water scarcity (flowering and grain formation), were decisive to the grain yields achieved. In this harvest, the average yield of 0.5 t ha–1 was the lowest of the last 15 years in the northwestern region of RS State, according to the data from the Brazilian Institute of Geography and Statistics (IBGE, 2015Instituto Brasileiro de Geografia e Estatística [IBGE]. 2015. IBGE Automatic Recovery System = Sistema IBGE de Recuperação Automática. Available at: http://www.sidra.ibge.gov.br/[Accessed Dec 16, 2015] (in Portuguese).
http://www.sidra.ibge.gov.br/...
). Considering that TVDI has the capacity of locating in time and space the occurrence of water restrictions in large producing regions, it is possible to use the statistics obtained from long time series of TVDI to quantify associated causes, for example, yield differences. The use of TVDI images allows to generate results more detailed than those currently available for southern Brazil (Sentelhas et al., 2015Sentelhas, P.C.; Battisti, R.; Câmara, G.M.S.; Farias, J.R.B.; Hampf, A.C.; Nendel, C. 2015. The soybean yield gap in Brazil: magnitude, causes and possible solutions for sustainable production. Journal of Agricultural Science 153: 1-18.; Zanon et al., 2016Zanon, A.J.; Streck, N.A.; Grassini, P. 2016. Climate and management factors influence soybean yield potential in a subtropical environment. Agronomy Journal 108: 1447-1454.).
Only three periods with high TVDI were observed in northern Rio Grande do Sul in the 2009-2010 crop-season (Figure 8). The first occurred in Nov, during crop establishment phase when there is more bare soil and NDVI decreases while TS increases. In the period when the crop is highly sensitive to water scarcity, TVDI had low values, indicating that the water condition was adequate. The observed NDVI and TS patterns were distinct between the two crop-seasons because of the distinct water status (Figures 9A and 10A). In 2009-2010, in the northwestern region of the state, the higher rainfall determined higher and more durable NDVI values compared to the 2004-2005 crop-season. In addition, because of the more favorable water condition, the energy balance partition was distinct, resulting in milder temperatures.
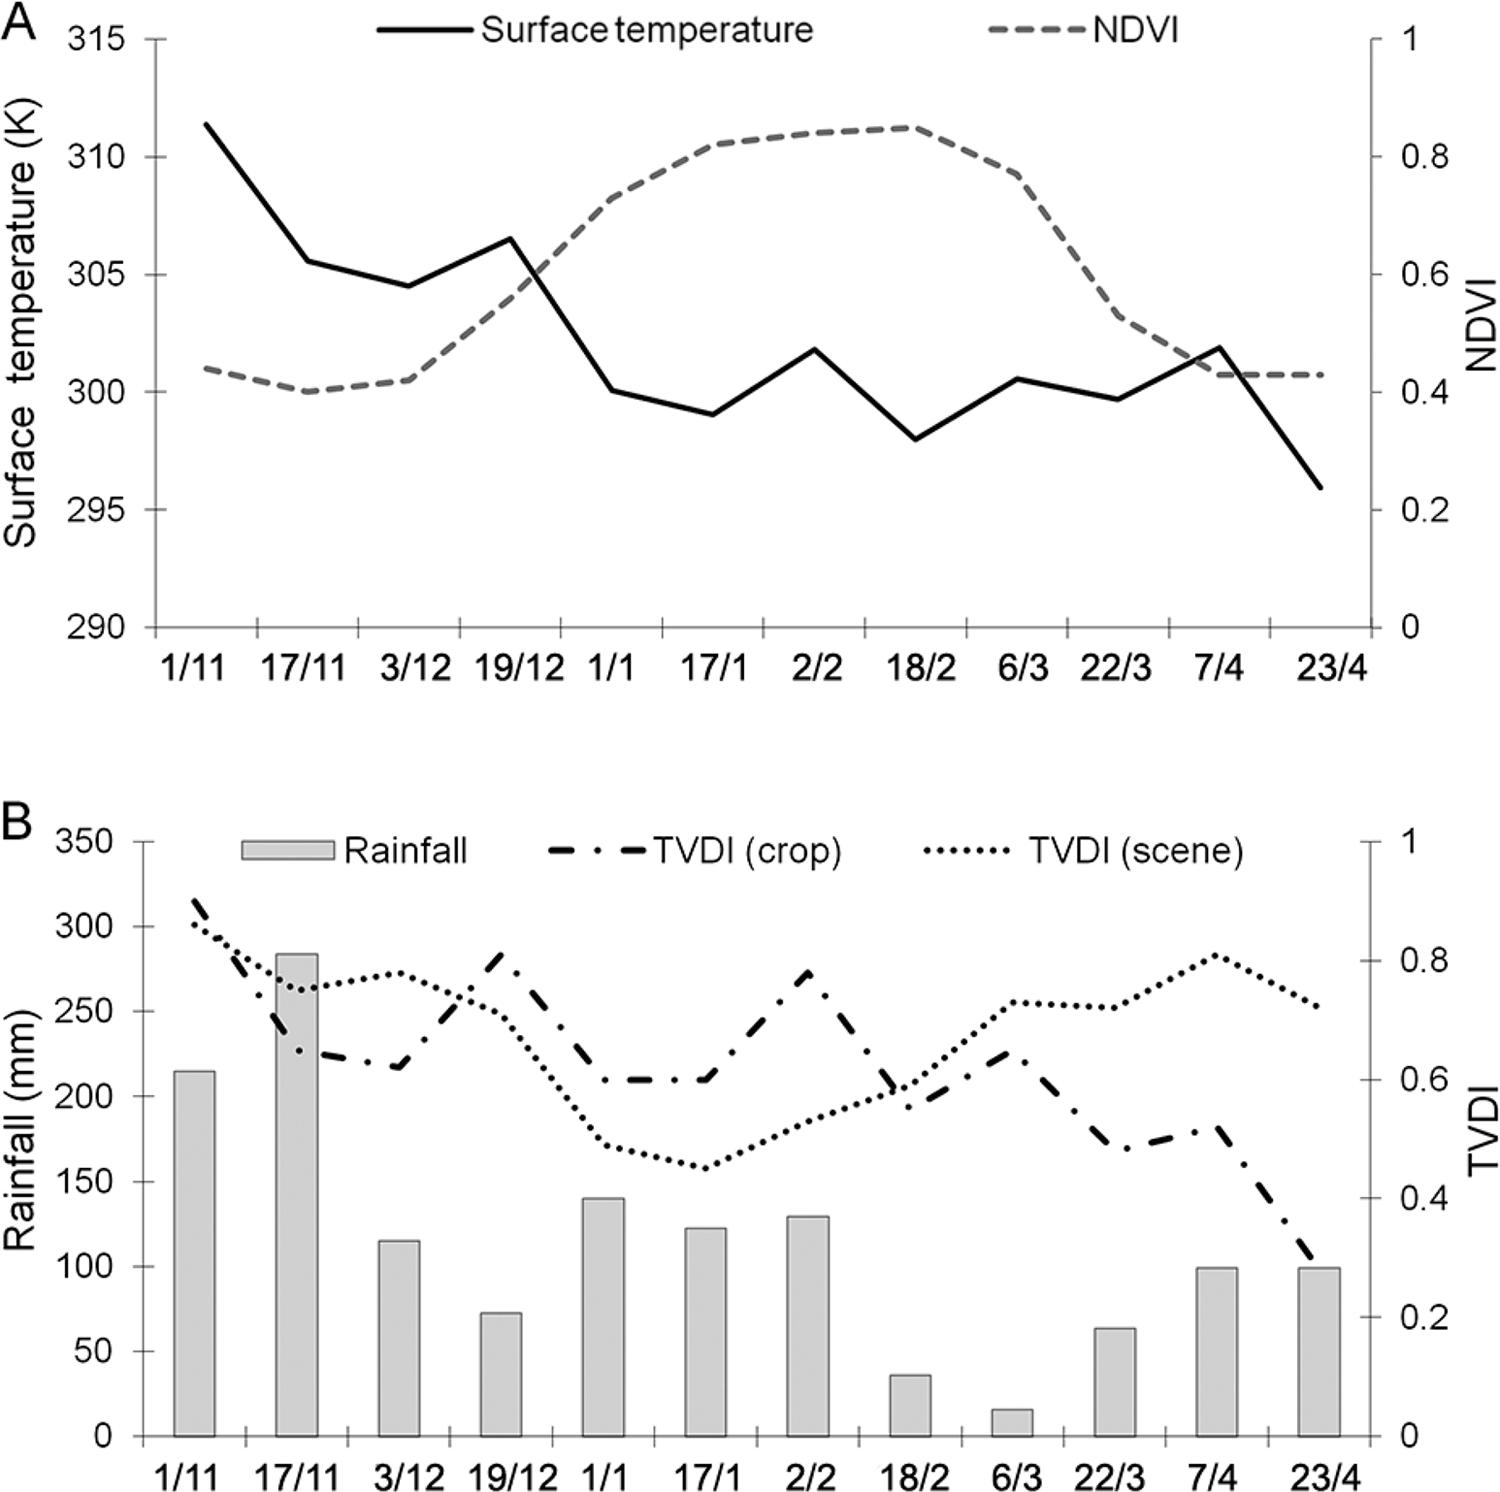
Average profiles of normalized difference vegetation index (NDVI) and TS (A) and average profiles of Temperature-Vegetation Dryness Index (TVDI) for the scene and crop parameterizations and 16-day cumulative rainfall (B) for soybean growing areas in northwestern Rio Grande do Sul, in the 2004-2005 crop-season.
Average profiles of normalized difference vegetation index (NDVI) and TS (A) and average profiles of Temperature-Vegetation Dryness Index (TVDI) for the scene and crop parameterizations and 16-day cumulative rainfall (B) for soybean growing areas in northwestern Rio Grande do Sul, in the 2009-2010 crop-season.
Figures 9B and 10B showed different mean TVDI values of the region depending on the parameterization type applied. In the parameterization by crop-season, there were larger variations over the analyzed period. The temporal profile analysis of TVDI (Figure 9B) shows higher values in the 2004-2005 crop-season compared to the 2009-2010 (Figure 10B). High TVDI values were observed in three and five periods, respectively, in these crop-seasons. Low rainfall was observed during the 2004-2005 crop-season and four of the highest TVDI were observed during the crop high coverage (on two Jan images, the second Feb image, and the first image of Mar).
Of the three major TVDI events in the 2009-2010 crop-season (Figure 10B), only one occurred during the time of vegetation peak development (first image of Feb). The average rainfall was higher than 100 mm (periods of 16 days), during the soybean cycle in the study site, except for the second image of Feb (36 mm) and first image of Mar, which was only 16 mm when a TVDI increase was also observed.
At the end of the crop cycle (Mar and Apr), low TVDI values were observed for both crop-seasons, as a consequence of the decreasing TS and lower NDVI associated with senescent vegetation at the harvest end (Goward et al., 2002Goward, S.N.; Xue, Y.; Czajkowski, K.P. 2002. Evaluating land surface moisture conditions from the remotely sensed temperature/VI measurements: an exploration with the simplified simple biosphere model. Remote Sensing of Environment 79: 225-242.).
In the parameterization by scene, TVDI variations were lower during the analyzed period. In general, no relationship was observed between index variability and the variability of either TS or NDVI, as well as with rainfall events, which reinforces the idea that this type of parameterization does not allow comparisons between different dates. Figures 11A, 11B, 11C and 11D show the association between TVDI and rainfall for the three weather stations located in the study area, in the two years and for the two parameterization types evaluated. The expected negative association, with the lowest rainfall generating high TVDI values, was observed only for the parameterization by crop and for the 2004-2005 dry year. Although consistent, the scattering of the points was high and the determination coefficient, low (0.1652). In the other cases, the dispersion was much greater, especially in the parameterization by scene. This result reinforces the thesis of inappropriateness of using parameterization by scene, but it also indicates that TVDI variability in this crop-season was governed by factors other than accumulated rainfall in 16 d. The assessment of TVDI performance against rainfall data is very simplistic and the correlation coefficients could not be much higher. Relationships that are more consistent could be obtained for soil moisture measurements or for a complete water balance, considering not only the water supply in the system (rainfall) but also the soil ability to retain this water and the atmospheric evaporative demand. This suggestion could be tested in future studies, considering the unavailability of these data for this research.
Dispersion between the 16-day cumulative rainfall data from weather stations of Cruz Alta, São Luiz Gonzaga, and Passo Fundo, and Temperature-Vegetation Dryness Index (TVDI) with parameterization by crop (A, B) and scene (C, D) for the 2004-2005 and 2009-2010 crop-seasons in soybean growing areas in northwestern Rio Grande do Sul, Brazil.
As the dry year provided a greater association between the TVDI and the rainfall data, there are indications that the index presents better results in dry climate conditions, with lower water availability, as approached by Sandholt et al. (2002). Despite that, tests still have to be conducted, since satisfactory results were obtained by Holzman et al. (2014) in humid temperate climate conditions in the Pampas region of Argentina.
Conclusions
The scene-specific parameterization of TVDI enables to analyze water conditions in the study site against the water limitation of each date individually, identifying the regions with relatively higher or lower water availability.
The TVDI crop parameterization is suitable to determine the time and the frequency of water restriction events that occur during the soybean crop cycle.
The TVDI crop parameterization is more effective to differentiate between the magnitudes of stress events in years with different yields, indicating the possibility of using TVDI in yield estimation models.
Acknowledgments
This research was financially supported by the Brazilian National Council for Scientific and Technological Development (CNPq) project 456585/2014-1.
References
- Alvares, C.A.; Stape, J.L.; Sentelhas, P.C.; Gonçalves, J.L.M.; Sparovek, G. 2013. Köppen's climate classification map for Brazil. Meteorologische Zeitschrift 22: 711-728.
- Esquerdo, J.C.D.M.; Zullo Júnior, J.; Antunes, J.F.G. 2011. Use of NDVI/AVHRR time-series profiles for soybean crop monitoring in Brazil. International Journal of Remote Sensing 32: 3711-3727.
- Gao, Z.; Gao, W.; Chang, N. 2011. Integrating temperature vegetation dryness index (TVDI) and regional water stress index (RWSI) for drought assessment with the aid of LANDSAT TM/ETM+ images. International Journal of Applied Earth Observation and Geoinformation 13: 495-503.
- Goward, S.N.; Xue, Y.; Czajkowski, K.P. 2002. Evaluating land surface moisture conditions from the remotely sensed temperature/VI measurements: an exploration with the simplified simple biosphere model. Remote Sensing of Environment 79: 225-242.
- Gusso, A.; Ducati, J.R.; Veronez, M.R.; Sommer, V.; Silveira Júnior, L.G. 2014. Monitoring heat waves and their impacts on summer crop development in southern Brazil. Agricultural Sciences 5: 353-364.
- Holzman, M.E.; Rivas, R.; Piccolo, M.C. 2014. Estimating soil moisture and the relationship with crop yield using surface temperature and vegetation index. International Journal of Applied Earth Observation and Geoinformation 28: 181-192.
- Huete, A.; Didan, K.; Miura, T.; Rodriguez, E.P.; Gao, X.; Ferreira, L.G. 2002. Overview of the radiometric and biophysical performance of the MODIS vegetation indices. Remote Sensing of Environment 83: 195-213.
- Instituto Brasileiro de Geografia e Estatística [IBGE]. 2015. IBGE Automatic Recovery System = Sistema IBGE de Recuperação Automática. Available at: http://www.sidra.ibge.gov.br/[Accessed Dec 16, 2015] (in Portuguese).
» http://www.sidra.ibge.gov.br/ - Kustas, W.P.; Li, F.; Jackson, T.J.; Prueger, J.H.; Macpherson, J.L.; Wolde, M. 2004. Effects of remote sensing pixel resolution on modeled energy flux variability of croplands in Iowa. Remote Sensing of Environment 92: 535-547.
- Liang, L.; Zhao, S.; Qin, Z.; He, K.; Chen, C.; Luo, Y.; Zhou, X. 2014. Drought change trend using MODIS TVDI and its relationship with climate factors in China from 2001 to 2010. Journal of Integrative Agriculture 13: 1501-1508.
- Long, D.; Singh, V.P. 2012. A Two-source trapezoid model for evapotranspiration (TTME) from satellite imagery. Remote Sensing of Environment 121: 370-388.
- Price, J.C. 1990. Using spatial context in satellite data to infer regional scale evapotranspiration. IEEE Transactions on Geoscience and Remote Sensing 28: 940-948.
- Roerink, G.J.; Su, B.; Menenti, M. 2000. S-SEBI: a simple remote sensing algorithm to estimate the surface energy balance. Physics and Chemistry of the Earth. Part B. Hydrology, oceans and atmosphere 25: 147-157.
- Sandholt, I.; Rasmusen, K.; Andersen, J. 2002. A simple interpretation of the surface temperature/vegetation index space for assessment of surface moisture status. Remote Sensing of Environment 79: 213-224.
- Sentelhas, P.C.; Battisti, R.; Câmara, G.M.S.; Farias, J.R.B.; Hampf, A.C.; Nendel, C. 2015. The soybean yield gap in Brazil: magnitude, causes and possible solutions for sustainable production. Journal of Agricultural Science 153: 1-18.
- Valipour, M. 2015. Temperature analysis of reference evapotranspiration models. Meteorological Applications 22: 385-394.
- Wan, Z. 2008. New refinements and validation of the MODIS land-surface temperature/emissivity products. Remote Sensing of Environment 112: 59-74.
- Wang K.; LI, Z.; Cribb, M. 2006. Estimation of evaporative fraction from a combination of day and night land surface temperatures and NDVI: a new method to determine the Priestley-Taylor parameter. Remote Sensing of Environment 102: 293-305.
- Yang, Y.; Guan, H.; Long, D.; Liu, B.; Qin, G.; Qin, J.; Batelaan, O. 2015. Estimation of surface soil moisture from thermal infrared remote sensing using an improved trapezoid method. Remote Sensing 7: 8250-8270.
- Zanon, A.J.; Streck, N.A.; Grassini, P. 2016. Climate and management factors influence soybean yield potential in a subtropical environment. Agronomy Journal 108: 1447-1454.
Edited by
Publication Dates
-
Publication in this collection
Mar-Apr 2018
History
-
Received
11 Aug 2016 -
Accepted
09 Jan 2017