ABSTRACT
SAFER (Simple Algorithm for Evapotranspiration Retrieving) is a relatively new algorithm applied successfully to estimate actual crop evapotranspiration (ET) at different spatial scales of different crops in Brazil. However, its use for monitoring irrigated crops is scarce and needs further investigation. This study assessed the performance of SAFER to estimate ET of irrigated corn in a Brazilian semiarid region. The study was conducted in São Desidério, Bahia State, Brazil, in corn-cropped areas in no-tillage systems and irrigated by central pivots. SAFER algorithm with original regression coefficients (a = 1.8 and b = –0.008) was initially tested during the growing seasons of 2014, 2015, and 2016. SAFER performed very poorly for estimating corn ET, with RMSD values greater than 1.18 mm d –1 for 12 fields analyzed and NSE values < 0 in most fields. To improve estimates, SAFER regression coefficients were calibrated (using 2014 and 2015 data) and validated with 2016 data, with the resulting coefficients a and b equal to 0.32 and –0.0013, respectively. SAFER performed well for ET estimation after calibration, with r 2 and NSE values equal to 0.91 and RMSD = 0.469 mm d –1 . SAFER also showed good performance (r 2 = 0.86) after validation, with the lowest RMSD (0.58 mm d –1 ) values for the set of 14 center pivots in this growing season. The results support the use of calibrated SAFER algorithm as a tool for estimating water consumption in irrigated corn fields in semiarid conditions.
Landsat; water consumption; maize; remote sensing
Introduction
The knowledge of crop evapotranspiration (ET) is critical for irrigation management (Gheysari et al., 2017 Gheysari , M .; Sadeghi , S .; Loescher , H.W .; Amiri , S .; Zareian , M.J .; Majidi , M.M .; Asgarinia , P .; Payero , J.O . 2017 . Comparison of deficit irrigation management strategies on root, plant growth and biomass productivity of silage maize . Agricultural Water Management 182 : 126 - 138 .). At field level, ET can be measured using conventional techniques, such as the Bowen ratio, eddy covariance, soil water balance and lysimetric procedure (Costa et al., 2018 Costa , J.O .; Coelho , R.D .; Wolff , W .; José , J.V .; Folegatti , M.V .; Ferraz , S.F.B . 2018 . Spatial variability of coffee plant water consumption based on the SEBAL algorithm . Scientia Agricola 76 : 93 - 101 .; Gharsallah et al., 2013 Gharsallah , O. ; Facchi , A. ; Gandolfi , C. 2013 . Comparison of six evapotranspiration models for a surface irrigated maize agro-ecosystem in northern Italy . Agricultural Water Management 130 : 119 - 130 .). However, these techniques are complex, costly, and require specific equipment and are thus generally applied only in scientific research (Gharsallah et al., 2013 Gharsallah , O. ; Facchi , A. ; Gandolfi , C. 2013 . Comparison of six evapotranspiration models for a surface irrigated maize agro-ecosystem in northern Italy . Agricultural Water Management 130 : 119 - 130 .) and limited to homogeneous surfaces (Costa et al., 2018 Costa , J.O .; Coelho , R.D .; Wolff , W .; José , J.V .; Folegatti , M.V .; Ferraz , S.F.B . 2018 . Spatial variability of coffee plant water consumption based on the SEBAL algorithm . Scientia Agricola 76 : 93 - 101 .). On the other hand, over heterogeneous surfaces, water consumption can be monitored with the scintillation technique (Ezzahar et al., 2007 Ezzahar , J .; Chehbouni , A .; Hoedjes, J.C.B .; Er-Raki , S .; Chehbouni , A .; Boulet , G .; Bonnefond , J.M .; De Bruin , H.A.R . 2007 . The use of the scintillation technique for monitoring seasonal water consumption of olive orchards in a semi-arid region . Agricultural Water Management 89 : 173 - 184 .) and especially using ET models/algorithms, based on remote sensing data. The latter is widely used because the algorithms allow estimating ET for larger and more heterogeneous areas (Hssaine et al., 2018 Hssaine , B.A .; Ezzahar , J .; Jarlan , L .; Merlin , O .; Khabba , S .; Brut , A .; Er-Raki , S .; Elfarkh , J .; Cappelaere , B .; Chehbouni , G . 2018 . Combining a two source energy balance model driven by MODIS and MSG-SEVIRI products with an aggregation approach to estimate turbulent fluxes over sparse and heterogeneous vegetation in Sahel region (Niger) . Remote Sensing 10 : 974 .; Sun et al., 2011 Sun , Z. ; Wei , B. ; Su , W. ; Shen , W. ; Wang , C. ; You , D. ; Liu , Z. 2011 . Evapotranspiration estimation based on the SEBAL model in the Nansi Lake Wetland of China . Mathematical and Computer Modelling 54 : 1086 - 1092 .; Teixeira et al., 2013 Teixeira , A.H.C .; Scherer-Warren , M .; Hernandez , F.B.T .; Andrade , R.G .; Leivas , J.F . 2013 . Large-scale water productivity assessments with MODIS images in a changing semi-arid environment: a Brazilian case study . Remote Sensing 5 : 5783 - 5804 .) and provide knowledge about spatial-temporal distribution of ET (Cao et al., 2018 Cao , X.C .; Shu , R .; Chen , D .; Guo , X.P .; Wang , W.G . 2018 . Temporal-spatial distributions of water use and productivity of maize in China . Journal of Agricultural Science 156 : 528 - 536 .; Liaqat et al., 2015 Liaqat , U.W .; Choi , M .; Awan , U.K. 2015 . Spatio-temporal distribution of actual evapotranspiration in the Indus Basin Irrigation System . Hydrological Processes 29 : 2613 - 2627 .). Furthermore, operational costs are relatively lower.
In the last decades, several methods to estimate ET using remote sensing data have been developed, such as Surface Energy Balance Algorithm for Land (SEBAL) (Bastiaanssen et al., 1998 Bastiaanssen , W.G.M .; Menenti , M .; Feddes , R.A .; Holtslag , A.A.M. 1998 . A remote sensing surface energy balance algorithm for land (SEBAL). 1. Formulation . Journal of Hydrology 212-213 : 198 - 212 .) and Mapping ET at High Resolution with Internalized Calibration (METRIC) (Allen et al., 2007 Allen , R.G .; Tasumi , M .; Trezza , R . 2007 . Satellite-based energy balance for mapping evapotranspiration with internalized calibration (METRIC) - Model . Journal of Irrigation and Drainage Engineering 133 : 380 - 394 .). The Simple Algorithm for Evapotranspiration Retrieving (SAFER) is a remote sensing algorithm set recently developed to calculate ET (Teixeira, 2010 Teixeira , A.H.C . 2010 . Determining regional actual evapotranspiration of irrigated crops and natural vegetation in the São Francisco river basin (Brazil) using remote sensing and Penman-Monteith equation . Remote Sensing 2 : 1287 - 1319 .; Teixeira et al., 2017 Teixeira , A.H.C .; Leivas , J.F .; Hernandez , F.B.T .; Franco , R.A.M . 2017 . Large-scale radiation and energy balances with Landsat 8 images and agrometeorological data in the Brazilian semiarid region . Journal of Applied Remote Sensing 11 : 016030 ., 2013 Teixeira , A.H.C .; Scherer-Warren , M .; Hernandez , F.B.T .; Andrade , R.G .; Leivas , J.F . 2013 . Large-scale water productivity assessments with MODIS images in a changing semi-arid environment: a Brazilian case study . Remote Sensing 5 : 5783 - 5804 .). Estimation of ET with SAFER at satellite overpass time is based on the modeled fraction of actual (ET) to reference (ETo) evapotranspiration, ET f , usually called crop coefficient. Calculation is made using visible, near infrared, and thermal infrared bands in conjunction with reference evapotranspiration data (ETo) estimated with meteorological station data (Teixeira, 2010 Teixeira , A.H.C . 2010 . Determining regional actual evapotranspiration of irrigated crops and natural vegetation in the São Francisco river basin (Brazil) using remote sensing and Penman-Monteith equation . Remote Sensing 2 : 1287 - 1319 .; Teixeira et al., 2017 Teixeira , A.H.C .; Leivas , J.F .; Hernandez , F.B.T .; Franco , R.A.M . 2017 . Large-scale radiation and energy balances with Landsat 8 images and agrometeorological data in the Brazilian semiarid region . Journal of Applied Remote Sensing 11 : 016030 ., 2013 Teixeira , A.H.C .; Scherer-Warren , M .; Hernandez , F.B.T .; Andrade , R.G .; Leivas , J.F . 2013 . Large-scale water productivity assessments with MODIS images in a changing semi-arid environment: a Brazilian case study . Remote Sensing 5 : 5783 - 5804 .).
SAFER algorithm applications involving large heterogeneous areas have shown very good performance (Coaguila et al., 2017 Coaguila , D.N .; Hernandez , F.B.T .; Teixeira , A.H.C .; Franco , R.A.M .; Leivas , J.F. 2017 . Water productivity using SAFER: Simple Algorithm for Evapotranspiration Retrieving in watershed . Revista Brasileira de Engenharia Agrícola e Ambiental 21 : 524 - 529 .; Dehziari and Sanaienejad, 2019 Dehziari , S.A .; Sanaienejad , S.H . 2019 . Energy balance quantification using Landsat 8 images and SAFER algorithm in Mashhad, Razavi Khorasan, Iran . Journal of Applied Remote Sensing 13 : 014528 .; Teixeira et al., 2019 Teixeira , A.H.C .; Miranda , F.R .; Leivas , J.F .; Pacheco , E.P .; Garçon , E.A.M . 2019 . Water productivity assessments for dwarf coconut by using Landsat 8 images and agrometeorological data . ISPRS Journal of Photogrammetry and Remote Sensing 155 : 150 - 158 ., 2017 Teixeira , A.H.C .; Leivas , J.F .; Hernandez , F.B.T .; Franco , R.A.M . 2017 . Large-scale radiation and energy balances with Landsat 8 images and agrometeorological data in the Brazilian semiarid region . Journal of Applied Remote Sensing 11 : 016030 ., 2013 Teixeira , A.H.C .; Scherer-Warren , M .; Hernandez , F.B.T .; Andrade , R.G .; Leivas , J.F . 2013 . Large-scale water productivity assessments with MODIS images in a changing semi-arid environment: a Brazilian case study . Remote Sensing 5 : 5783 - 5804 .). However, when applied to irrigated annual crops, which are more homogenous, SAFER provides unsatisfactory ET estimates during the early stages of crop growth (Althoff et al., 2019 Althoff , D .; Alvino , F.C.G .; Filgueiras , R .; Aleman , C.C .; Cunha , F.F . 2019 . Evapotranspiration for irrigated agriculture using orbital satellites . Bioscience Journal 35 : 670 - 678 .; Lima et al., 2019 Lima , A.L.B .; Filgueiras , R .; Mantovani , E.C .; Althoff , D .; Santos , R.A .; Venancio , L.P. 2019 . Biophysical parameters and actual evapotranspiration of bean culture by means of remote sensing . Journal of Agricultural Science 11 : 156 - 166 ) thus requiring calibration and validation of SAFER algorithm.
This study assessed the performance of SAFER algorithm to estimate ET of irrigated corn crop in a Brazilian semiarid region by comparing with the modified FAO method (MFAO), a method used under these climatic conditions in Brazil. If the original SAFER algorithm did not function correctly, the additional objective was to calibrate the regression coefficients of the algorithm and verify its application in irrigated commercial cornfields using MFAO as a reference.
Materials and Methods
Study site
The study was conducted on a commercial farm in the municipality of São Desidério, western region of the state of Bahia, a semiarid region in Brazil ( Figure 1 ). The site is located in the rectangle bounded by geographic coordinate pairs (Datum SIRGAS 2000): 12°28’08” S, 45°45’12” W, 12°25’40” S, 45°34’55” W, with an average altitude of 750 m. According to Köppen classification (Alvares et al., 2013 Alvares , C.A .; Stape , J.L .; Sentelhas , P.C .; Gonçalves , J.L.M .; Sparovek , G . 2013 . Köppen’s climate classification map for Brazil . Meteorologische Zeitschrift 22 : 711 - 728 .), the climate of the region is Aw, that is, tropical with rainy summers and dry winters, with annual precipitation 1003.4 mm (INMET, 2018), concentrated in the rainy season (Oct to Apr). The farm covers an area of 1598 ha and has 17 center pivots, 16 towable, indicated by letters A and B in Figure 1 .
Meteorological and crop data
The field data refer to corn ( Zea mays L.) crop under the no-tillage system and were collected during the growing seasons 2014, 2015, and 2016. Meteorological data, such as air temperature (T, °C), wind speed at 2 m height (U 2 , m s –1 ), solar radiation (Ra, MJ m 2 d –1 ), relative humidity (RH, %), and rainfall (mm) were obtained from an automated meteorological station, near the center pivots ( Figure 1 ). These data were used to determine daily reference evapotranspiration (ETo) and actual corn evapotranspiration (ET). Additionally, data were acquired for sowing and harvest dates, applied irrigation depth, and the hybrid cultivated under each center pivot by year ( Table 1 ).
Satellite Images: Landsat 8 OLI/TIRS and Landsat 7 ETM+ data
We used cloud-free surface reflectance images from the Enhanced Thematic Mapper Plus (ETM+) sensor onboard Landsat 7 and images from the Operational Land Imager (OLI) and Thermal Infrared Sensor (TIRS) sensors onboard the Landsat 8 satellite (path 220 and row 69), downloaded from the archives of the USGS Earth Explorer website ( http://earthexplorer.usgs.gov/ ). For the ETM+ sensor, we used multispectral bands 1 to 5, with a spatial resolution of 30 m, and thermal band 6, with a spatial resolution of 60 m, resampled to 30 m (USGS, 2018).
For the Landsat 8 OLI sensor, we used multispectral bands 2 to 7, with a spatial resolution of 30 m, and for the TIRS sensor, we used thermal band 10, with a spatial resolution of 100 m, resampled to 30 m (USGS, 2016). Access and full descriptions of the products can be found online in the Landsat data users’ handbooks of USGS. We acquired 46 images, including from OLI/TIRS sensors and the ETM+ sensor, for the three cropping seasons, with 18, 15, and 13 images for 2014, 2015, and 2016, respectively.
Estimation of actual crop evapotranspiration (ET)
Modified FAO method
Corn ET was estimated using the modified FAO method (MFAO) (Bernardo et al., 2019 Bernardo , S .; Mantovani , E.C .; Silva , D.D .; Soares , A.A . 2019 . Irrigation Manual = Manual de Irrigação . 9 ed. Editora UFV , Viçosa, MG, Brazil ( in Portuguese ).; Mantovani et al., 2006 Mantovani , E.C .; Bernardo , S .; Palaretti , L.F . 2006 . Irrigation: Principles and Methods = Irrigação: Princípios e Métodos . Editora UFV , Viçosa, MG, Brazil ( in Portuguese ).). The MFAO method has been widely used in scientific studies in Brazil (Santos et al., 2018 Santos , O.F .; Cunha , F.F .; Taira , T.L .; Souza , E.J .; Leal , A.J.F . 2018 . Increase in pea productivity associated with irrigation management . Horticultura Brasileira 36 : 178 - 183 .; Silva et al., 2018c; Venancio et al., 2019 Venancio , L.P .; Chartuni , E.C .; Amaral , C.H .; Neale , C.M.U .; Gonçalves , I.Z .; Filgueiras , R .; Campos , I . 2019 . Forecasting corn yield at the farm level in Brazil based on the FAO-66 approach and soil-adjusted vegetation index (SAVI) . Agricultural Water Management 225 : 105779 .; Vicente et al., 2017 Vicente , M.R .; Mantovani , E.C .; Fernandes , A.L.T .; Neves , J.C.L .; Figueredo , E.M .; Delazari , F.T . 2017 . Spacial distribution of fertigated coffee root system . Ciência e Agrotecnologia 41 : 72 - 80 .). In addition, it has been widely applied in several Brazilians farms and in other countries by the company IRRIGER ( http://www.irriger.com.br/en-US/ ) (IRRIGER, 2019). This method is based on single-crop coefficient method (Allen et al., 1998 Allen , R.G .; Pereira , L.S .; Raes , D .; Smith , M . 1998 . Crop Evapotranspiration: Guidelines for Computing Crop Water Requirements . FAO , Rome, Italy . ( Irrigation and Drainage Paper, 56 ).; Doorenbos and Pruitt, 1977 Doorenbos , J .; Pruitt , W.O . 1977 . Guidelines for predicting crop water requirements . FAO , Rome, Italy . ( Irrigation and Drainage Paper, 24 ).) and is a simple method to estimate potential evapotranspiration and manage practical irrigation water at field level. The water stress coefficient (K s ) and localized water application coefficient (K L ) were added to MFAO to increase the performance of the single-crop coefficient method, according to the following equation:
where: ET is actual crop evapotranspiration (mm d –1 ), ETo is reference evapotranspiration according to the FAO Penman-Monteith method (Allen et al., 1998 Allen , R.G .; Pereira , L.S .; Raes , D .; Smith , M . 1998 . Crop Evapotranspiration: Guidelines for Computing Crop Water Requirements . FAO , Rome, Italy . ( Irrigation and Drainage Paper, 56 ).) (mm d –1 ), K c is crop coefficient, K s is water stress coefficient (Bernardo et al., 2019 Bernardo , S .; Mantovani , E.C .; Silva , D.D .; Soares , A.A . 2019 . Irrigation Manual = Manual de Irrigação . 9 ed. Editora UFV , Viçosa, MG, Brazil ( in Portuguese ).), K L is the localized water application coefficient (Keller and Bliesner, 1990 Keller , J .; Bliesner , R.D . 1990 . Sprinkle and Trickle Irrigation . Van Nostrand Reinold , New York, NY, USA .), K L is 1 when the entire cultivated area is wetted by an irrigation system (e.g., areas are irrigated by center pivots).
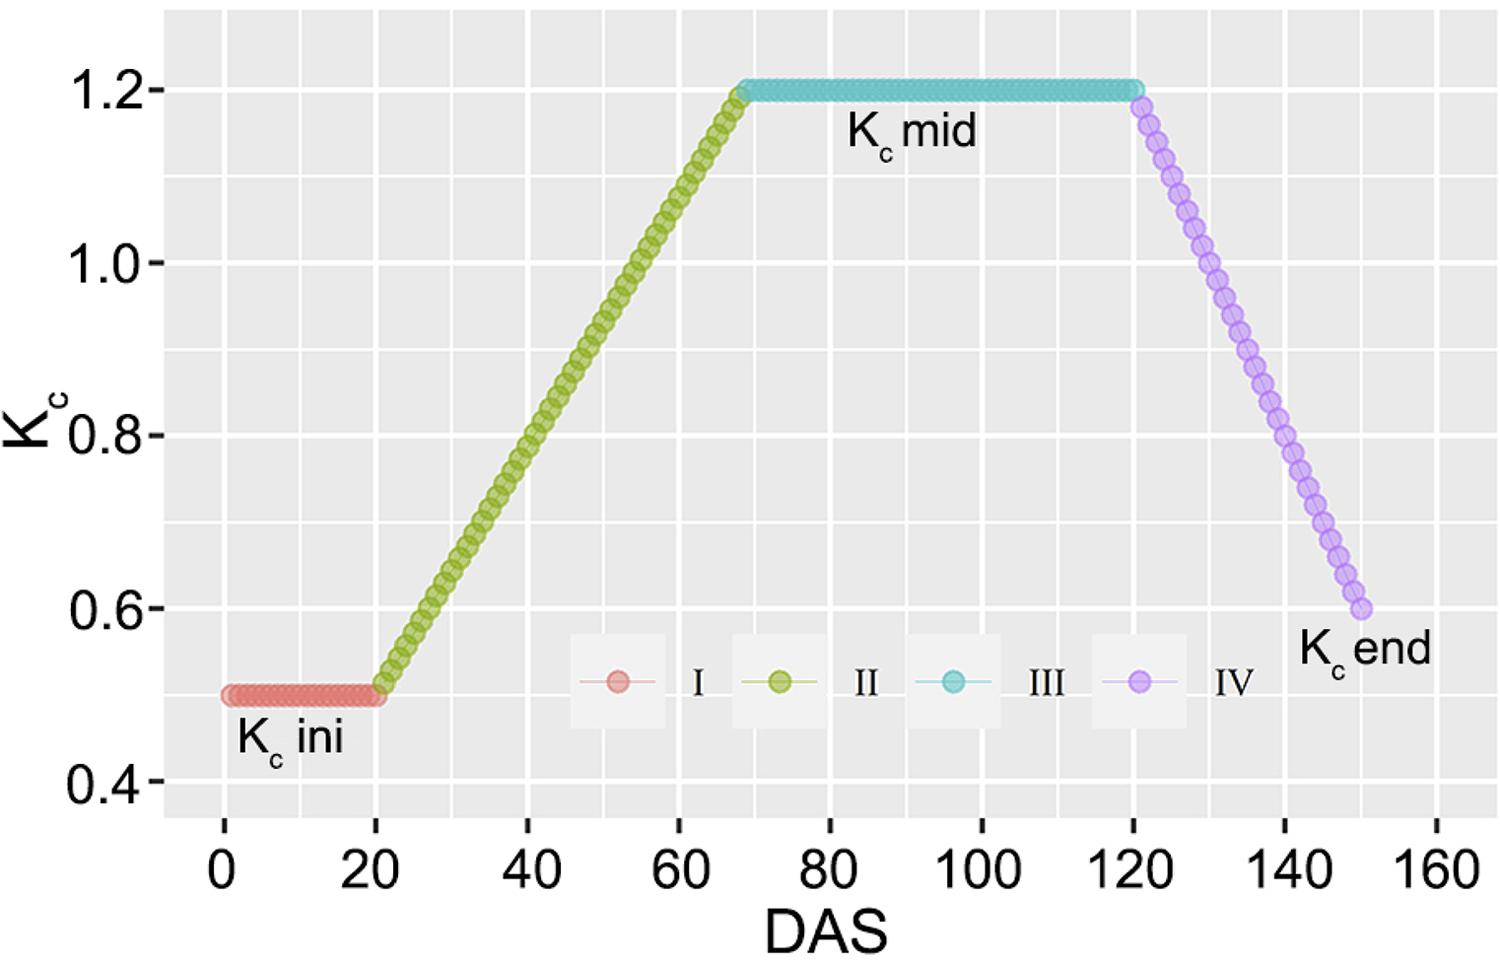
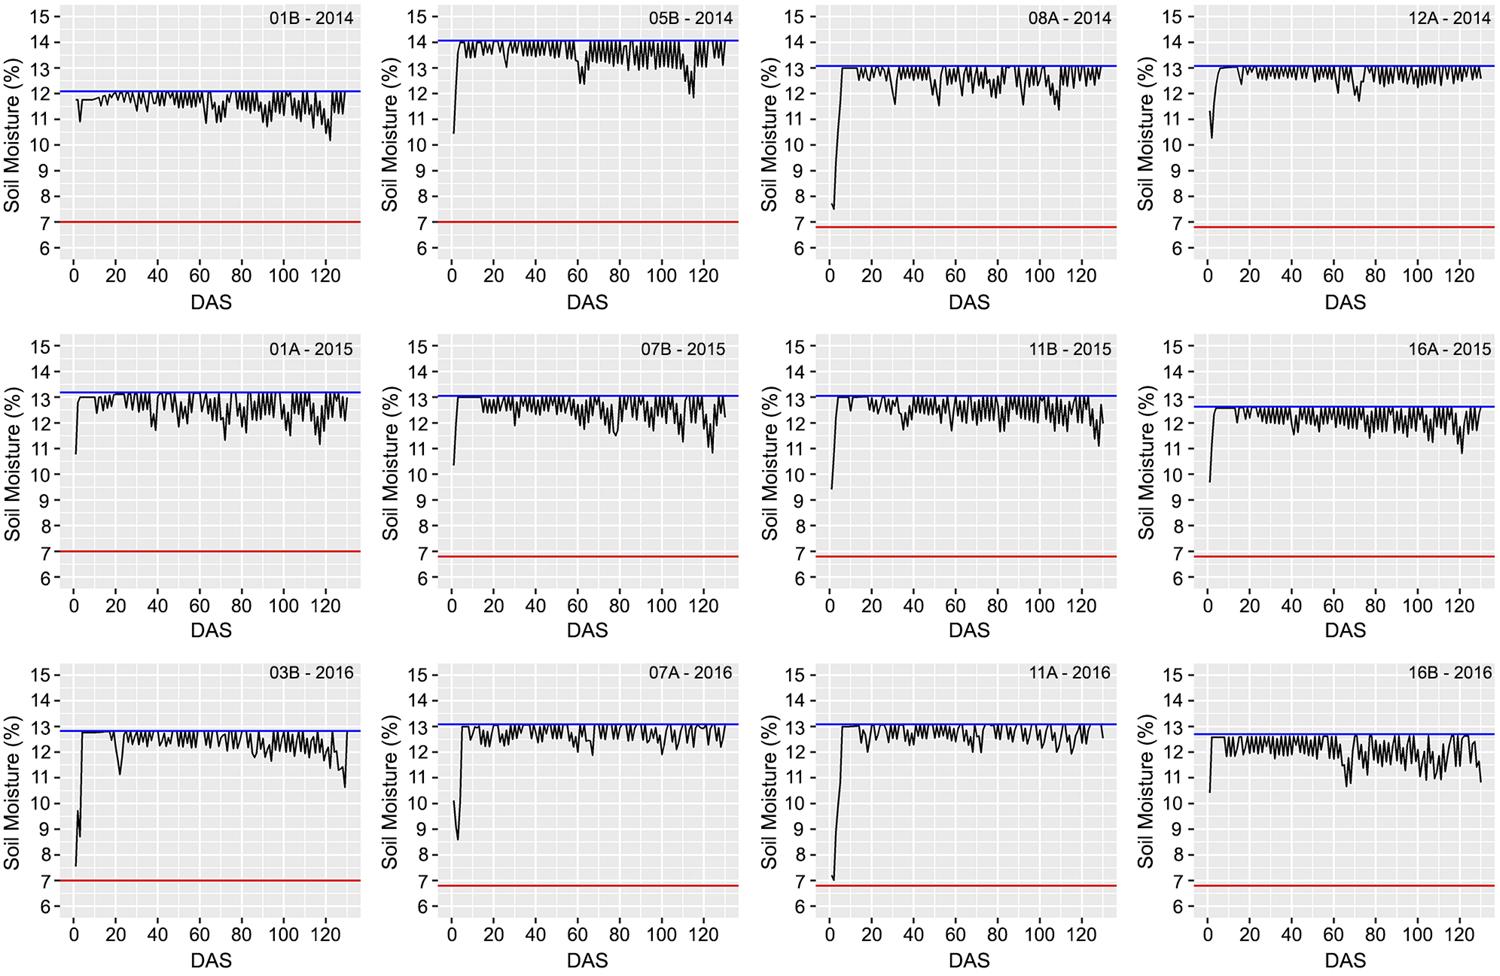
The K c values used in MFAO to determine corn ET were calibrated locally and derived from values recommend by the FAO-56 approach (Allen et al., 1998 Allen , R.G .; Pereira , L.S .; Raes , D .; Smith , M . 1998 . Crop Evapotranspiration: Guidelines for Computing Crop Water Requirements . FAO , Rome, Italy . ( Irrigation and Drainage Paper, 56 ).) ( Figure 2 ). K s is used to incorporate the water stress effect to reduced crop transpiration, and daily K s estimation in the root zone (Bernardo et al., 2019 Bernardo , S .; Mantovani , E.C .; Silva , D.D .; Soares , A.A . 2019 . Irrigation Manual = Manual de Irrigação . 9 ed. Editora UFV , Viçosa, MG, Brazil ( in Portuguese ).) is computed according equation 2. The K s values and estimated soil moisture based on soil water balance for four selected center pivots in each growing season are presented in Figures 3 and 4 , respectively.
– Crop coefficient (K c ) curve regarding days after sowing (DAS) for corn used in ET estimation. Source: Adapted by the author from Allen et al. (1998) Allen , R.G .; Pereira , L.S .; Raes , D .; Smith , M . 1998 . Crop Evapotranspiration: Guidelines for Computing Crop Water Requirements . FAO , Rome, Italy . ( Irrigation and Drainage Paper, 56 ).. Growth stages: I (initial); II (crop development); III (midseason) and IV (late season).
– Temporal evolution of water stress coefficient (K s ) obtained in selected center pivots in 2014, 2015, and 2016.
– Temporal evolution of estimated soil moisture obtained in selected center pivots in 2014, 2015, and 2016. Blue and red line refers to field capacity and wilting point, respectively.
where: SWS is total soil water storage (mm), which corresponds to TWA given in FAO-56 Bulletin (Allen et al., 1998 Allen , R.G .; Pereira , L.S .; Raes , D .; Smith , M . 1998 . Crop Evapotranspiration: Guidelines for Computing Crop Water Requirements . FAO , Rome, Italy . ( Irrigation and Drainage Paper, 56 ).); and CSWS is the current soil water storage (mm).
The CSWS is calculated from the difference between SWS and ETc accumulated considering certain period (1 or more days), both in millimeters. When soil moisture is at field capacity, CSWS is equal to SWS and, consequently, K s is equal to 1.
Simple Algorithm for Evapotranspiration Retrieving (SAFER)
SAFER combines remote sensing data, namely, the normalized difference vegetation index (NDVI), surface albedo (α 0 ), and surface temperature (T 0 ) with the ETo according to the FAO Penman-Monteith method (Allen et al., 1998 Allen , R.G .; Pereira , L.S .; Raes , D .; Smith , M . 1998 . Crop Evapotranspiration: Guidelines for Computing Crop Water Requirements . FAO , Rome, Italy . ( Irrigation and Drainage Paper, 56 ).). Calculations are made using data from weather stations. The steps for applying SAFER are described according to Teixeira (2010) Teixeira , A.H.C . 2010 . Determining regional actual evapotranspiration of irrigated crops and natural vegetation in the São Francisco river basin (Brazil) using remote sensing and Penman-Monteith equation . Remote Sensing 2 : 1287 - 1319 ..
For the surface temperature calculation, bands 6 (Landsat 7) and 10 (Landsat 8) were first converted from spectral radiance to brightness temperature by applying the inverse of Planck equation to the radiation estimated.
where: T b is satellite brightness temperature (K), L λ is TOA spectral radiance (W m –2 sr –1 μm –1 ) for thermal bands (6 and 10), and K 1 and K 2 are the band-specific thermal conversion constants from metadata (specific for each sensor).
Afterward, surface temperatures of bands 6 and 10 were obtained according to the equation parameterized by Teixeira (Teixeira, 2010).
where: T 0 is surface temperature (K) and T b is satellite brightness temperature (K). Then, temperature was converted from Kelvin to Celsius degrees to be applied in equation 8.
For estimating surface albedo, first, top-of-atmosphere albedo (α TOA ) data were obtained by equation 5. Then, α TOA was transformed to surface albedo data (Teixeira, 2010 Teixeira , A.H.C . 2010 . Determining regional actual evapotranspiration of irrigated crops and natural vegetation in the São Francisco river basin (Brazil) using remote sensing and Penman-Monteith equation . Remote Sensing 2 : 1287 - 1319 .) using equation 6.
where: ω ρ is the weight coefficient for each band and ρ λ is surface reflectance of bands 1, 2, 3, 4, 5, and 7 (ETM+) and of bands 2, 3, 4, 5, 6, and 7 (OLI). Weight coefficients for ETM+ and OLI sensors were extracted from Allen et al. (2002) Allen , R.G .; Tasumi , M .; Trezza , R .; Waters , R .; Bastiaanssen , W . 2002 . SEBAL: surface energy balance algorithms for land. Idaho implementation, advanced training and user’s manual, version 1.0 . University of Idaho , Moscow, ID, USA . and Silva et al. (2016) Silva , B.B .; Braga , A.C .; Braga , C.C .; Oliveira , L.M.M .; Montenegro , S.M.G.L .; Barbosa Junior , B. 2016 . Procedures for calculation of the albedo with OLI-Landsat 8 images: application to the Brazilian semi-arid . Revista Brasileira de Engenharia Agrícola e Ambiental 20 : 3 - 8 ., respectively.
where: ρ NIR and ρ red refer to reflectance of the near-infrared band and the red band, respectively.
Applying SAFER algorithm, the ratio of the actual (ET) to the reference (ET o ) evapotranspiration, ET f , was modeled at the satellite overpass time (Teixeira, 2010 Teixeira , A.H.C . 2010 . Determining regional actual evapotranspiration of irrigated crops and natural vegetation in the São Francisco river basin (Brazil) using remote sensing and Penman-Monteith equation . Remote Sensing 2 : 1287 - 1319 .; Teixeira et al., 2017 Teixeira , A.H.C .; Leivas , J.F .; Hernandez , F.B.T .; Franco , R.A.M . 2017 . Large-scale radiation and energy balances with Landsat 8 images and agrometeorological data in the Brazilian semiarid region . Journal of Applied Remote Sensing 11 : 016030 ., 2013 Teixeira , A.H.C .; Scherer-Warren , M .; Hernandez , F.B.T .; Andrade , R.G .; Leivas , J.F . 2013 . Large-scale water productivity assessments with MODIS images in a changing semi-arid environment: a Brazilian case study . Remote Sensing 5 : 5783 - 5804 .) as follows:
where: “a” and “b” are regression coefficients, 1.8 and –0.008, respectively, applicable for the Brazilian semiarid conditions, according to Teixeira et al. (2013) Teixeira , A.H.C .; Scherer-Warren , M .; Hernandez , F.B.T .; Andrade , R.G .; Leivas , J.F . 2013 . Large-scale water productivity assessments with MODIS images in a changing semi-arid environment: a Brazilian case study . Remote Sensing 5 : 5783 - 5804 ..
This equation (ET f ) was established for Brazilian semiarid conditions involving irrigated crops and natural vegetation under different meteorological and hydrological conditions, based on simultaneous field data from four flux towers and Landsat images (Teixeira, 2010 Teixeira , A.H.C . 2010 . Determining regional actual evapotranspiration of irrigated crops and natural vegetation in the São Francisco river basin (Brazil) using remote sensing and Penman-Monteith equation . Remote Sensing 2 : 1287 - 1319 .). The main physical basis behind this equation is that ET f values modeled from NDVI, α 0 , and T 0 can express crop development and soil moisture condition, similar to crop coefficient (K c ) multiplied by water stress coefficient (K s ), as demonstrated in the FAO 56 approach and the MFAO method.
Based on ET f and ETo data collected from the meteorological stations, crop ET (mm d –1 ) was estimated by equation 9, providing daily ET values for each center pivot pixel.
SAFER calibration and validation
First, the SAFER algorithm with regression coefficients recommended by Teixeira et al. (2013) Teixeira , A.H.C .; Scherer-Warren , M .; Hernandez , F.B.T .; Andrade , R.G .; Leivas , J.F . 2013 . Large-scale water productivity assessments with MODIS images in a changing semi-arid environment: a Brazilian case study . Remote Sensing 5 : 5783 - 5804 . for the study region (a = 1.8 and b = –0.008) was tested during the growing seasons of 2014, 2015, and 2016, involving 42 center pivots (12, 15, and 15 in 2014, 2015, and 2016, respectively), covering an area of 3357 ha. The results were very poor, especially during the first 30 days after sowing (DAS) (see Results and Discussion), mainly because of low ET f values. Thus, we continued with the additional objective of this study, using data from 2014 (12 center pivots) and 2015 (15 center pivots), to calibrate and data from 2016 (15 center pivots) to validate. Calibration, based on adjusting empirical parameters (a and b) described in equation 8, was performed using the solver tool in Microsoft Excel, which uses the nonlinear optimized generalized reduced gradient (GRG) algorithm (Lasdon et al., 1978 Lasdon , L.S .; Waren , A .; Jain , A .; Ratner , M . 1978 . Design and testing of a generalized reduced gradient code for nonlinear programming . ACM Transactions on Mathematical Software 4 : 34 - 50 .).
The empirical parameters (a and b) of ET f was adjusted using K c × K s data from the modified FAO method as a standard, since K c × K s and ET f are related to crop development and soil moisture conditions (Teixeira, 2010 Teixeira , A.H.C . 2010 . Determining regional actual evapotranspiration of irrigated crops and natural vegetation in the São Francisco river basin (Brazil) using remote sensing and Penman-Monteith equation . Remote Sensing 2 : 1287 - 1319 .). Thus, K c × K s was called ET fMFAO , while ET f derived from SAFER was called ET fSAFER . In the calibration process, the original values of parameters a and b were used as initial values for the process of adjustment. The solver tool changes the parameter values to reduce the distance between the ET fSAFER and ET fMFAO through an iterative process. This distance was measured by the mean square error (MSE).
Statistical analysis
To assess accuracy of SAFER algorithm in corn ET modeling, we calculated the statistical indicators root mean square deviation (RMSD), mean bias error (MBE), mean absolute error (MAE), Nash-Sutcliffe efficiency (NSE) (Nash and Sutcliffe, 1970 Nash , J.E .; Sutcliffe , J.V. 1970 . River flow forecasting through conceptual models. Part I-a. Discussion of principles . Journal of Hydrology 10 : 282 - 290 .), and coefficient of determination (r 2 ). In addition, to avoid influence of field border, we used a 30-m buffer.
Results and Discussion
SAFER input parameters
Figure 5 shows the distribution of α 0 data based on a boxplot for center pivots cultivated in the growing seasons of 2014, 2015, and 2016. The albedo ranged between 0.13 and 0.18, agreeing with data reported in the literature for cornfields, 0.14 and 0.22 (Allen et al., 2002 Allen , R.G .; Tasumi , M .; Trezza , R .; Waters , R .; Bastiaanssen , W . 2002 . SEBAL: surface energy balance algorithms for land. Idaho implementation, advanced training and user’s manual, version 1.0 . University of Idaho , Moscow, ID, USA .). The average value remained close to 0.15 for the three seasons, corroborating results reported in the literature for corn (Bsaibes et al., 2009 Bsaibes , A. ; Courault , D. ; Baret , F. ; Weiss , M. ; Olioso , A. ; Jacob , F. ; Hagolle , O. ; Marloie , O. ; Bertrand , N. ; Desfond , V. ; Kzemipour , F. 2009 . Albedo and LAI estimates from FORMOSAT-2 data for crop monitoring . Remote Sensing of Environment 113 : 716 - 729 .; Eichelmann et al., 2016 Eichelmann , E. ; Wagner-Riddle , C. ; Warland , J. ; Deen , B. ; Voroney , P. 2016 . Comparison of carbon budget, evapotranspiration, and albedo effect between the biofuel crops switchgrass and corn . Agriculture, Ecosystems and Environment 231 : 271 - 282 .).
– Boxplot of surface albedo values for center pivots cultivated in the growing seasons of 2014, 2015, and 2016.
During the growing season of 2015, α 0 data had a low amplitude. This occurred because only one corn hybrid was cultivated in center pivots 05A to 16A, differently from 2014 and 2016 seasons, where five different hybrids were planted ( Table 1 ). As α 0 value decreases, surface increases its absorption of solar energy and local surface temperature increases (Richardson et al., 2013 Richardson , A.D .; Keenan , T.F .; Migliavacca , M .; Ryu , Y .; Sonnentag , O .; Toomey , M . 2013 . Climate change, phenology, and phenological control of vegetation feedbacks to the climate system . Agricultural and Forest Meteorology 169 : 156 - 173 .), contributing to a relative increase in water consumption. Thus, the use of α 0 in SAFER algorithm is essential to provide more accuracy to ET estimation.
NDVI values were similar in the three growing seasons. During 2014 and 2015 seasons, the average was greater than in 2016, indicating high NDVI values for a longer time in the first two seasons ( Figure 6 ). Maximum NDVI values remained at approximately 0.9, while minimum values were close to 0.2, with an average value of approximately 0.7. Minimum value, approximately 0.2, was commonly observed near the sowing date, while the maximum value was observed in the entire period covered. Other authors have reported similar results (Nagy et al., 2018 Nagy , A. ; Fehér , J. ; Tamás , J. 2018 . Wheat and maize yield forecasting for the Tisza river catchment using MODIS NDVI time series and reported crop statistics . Computers and Electronics in Agriculture 151 : 41 - 49 .; Nguy-Robertson et al., 2013 Nguy-Robertson , A. ; Gitelson , A. ; Peng , Y. ; Walter-Shea , E. ; Leavitt , B. ; Arkebauer , T. 2013 . Continuous monitoring of crop reflectance, vegetation fraction, and identification of developmental stages using a four band radiometer . Agronomy Journal 105 : 1769 - 1779 .; Wang et al., 2016 Wang , R. ; Cherkauer , K. ; Bowling , L. 2016 . Corn response to climate stress detected with satellite-based NDVI time series . Remote Sensing 8 : 269 .).
– Boxplot of NDVI values for center pivots cultivated in the growing seasons of 2014, 2015, and 2016.
Figure 7 shows a boxplot of surface temperature values for center pivots in the growing seasons of 2014, 2015, and 2016. T 0 ranged from 20 to 36 °C. Most fields of center pivots had an average surface temperature of approximately 25 °C. Maximum values of surface temperature were observed during the season beginning, when there is much exposed soil background.
– Boxplot of surface temperature values for center pivots cultivated in the growing seasons of 2014, 2015, and 2016.
Overall, there was very low variability of α 0 , NDVI, and T 0 between fields. However, high variability was observed within the same field over season, especially in NDVI values. According to Venancio et al. (2019) Venancio , L.P .; Chartuni , E.C .; Amaral , C.H .; Neale , C.M.U .; Gonçalves , I.Z .; Filgueiras , R .; Campos , I . 2019 . Forecasting corn yield at the farm level in Brazil based on the FAO-66 approach and soil-adjusted vegetation index (SAVI) . Agricultural Water Management 225 : 105779 ., in these cornfields, a high technological level is adopted, resulting in well-managed irrigation and fertilization. Thus, variability of these parameters within the same field is more influenced by the different crop phenological stages, unlike natural vegetation, where variability of these parameters can primarily be attributed to variations in global solar radiation and surface moisture conditions (Teixeira et al., 2017 Teixeira , A.H.C .; Leivas , J.F .; Hernandez , F.B.T .; Franco , R.A.M . 2017 . Large-scale radiation and energy balances with Landsat 8 images and agrometeorological data in the Brazilian semiarid region . Journal of Applied Remote Sensing 11 : 016030 .).
SAFER: ET f and corn ET with original regression coefficients
Figure 8 shows a boxplot of ET f values. Pixel values ranged from 0 to 1.7, with 25 % of the data (third quartiles) normally between 1.3 and 1.7 (2014 and 2015). In 2016, maximum values were lower (≈1.4). The center pivots in this study were well managed regarding water use, causing Ks values to remain within the range from 0.9 to 1.0 ( Figure 3 ) and soil moisture close to field capacity ( Figure 4 ). Thus, ET f was expected to be close to K c values recommended for corn crops. However, resulting values varied greatly from normal K c values.
– Boxplot of fraction between actual (ET) to reference (ETo) evapotranspiration, ET f values, for center pivots cultivated in the growing seasons of 2014, 2015, and 2016.
These results indicate ET f is not adequately sensitive to represent the behavior of crop coefficient adjusted to the water stress (K c × K S ) in irrigated cornfields. To overcome this problem, the best option is to adjust the empirical coefficients, considering suitable the input of remote sensing parameters, additional objective of this study. In irrigated cornfields, Teixeira et al. (2015) Teixeira , A.H.C .; Hernandez , F.B.T .; Andrade , R.G .; Leivas , J.F .; Victoria , D.C .; Bolfe , E.L. 2015 . Corn water variables assessments from earth observation data in the São Paulo state, southeast Brazil . Journal of Hydraulic Engineering 1 : 1 - 11 . verified some pixels with ET f values close to 1.40, with values normally ranging between 0.2 and 1.2; however, regression coefficients used in this study were 1.0 and –0.008 for a and b, respectively. Silva et al. (2018b) applied SAFER in sugarcane crops in the central-western part of São Paulo State, Brazil, and reported that some ET f values were close to zero, as observed in this study.
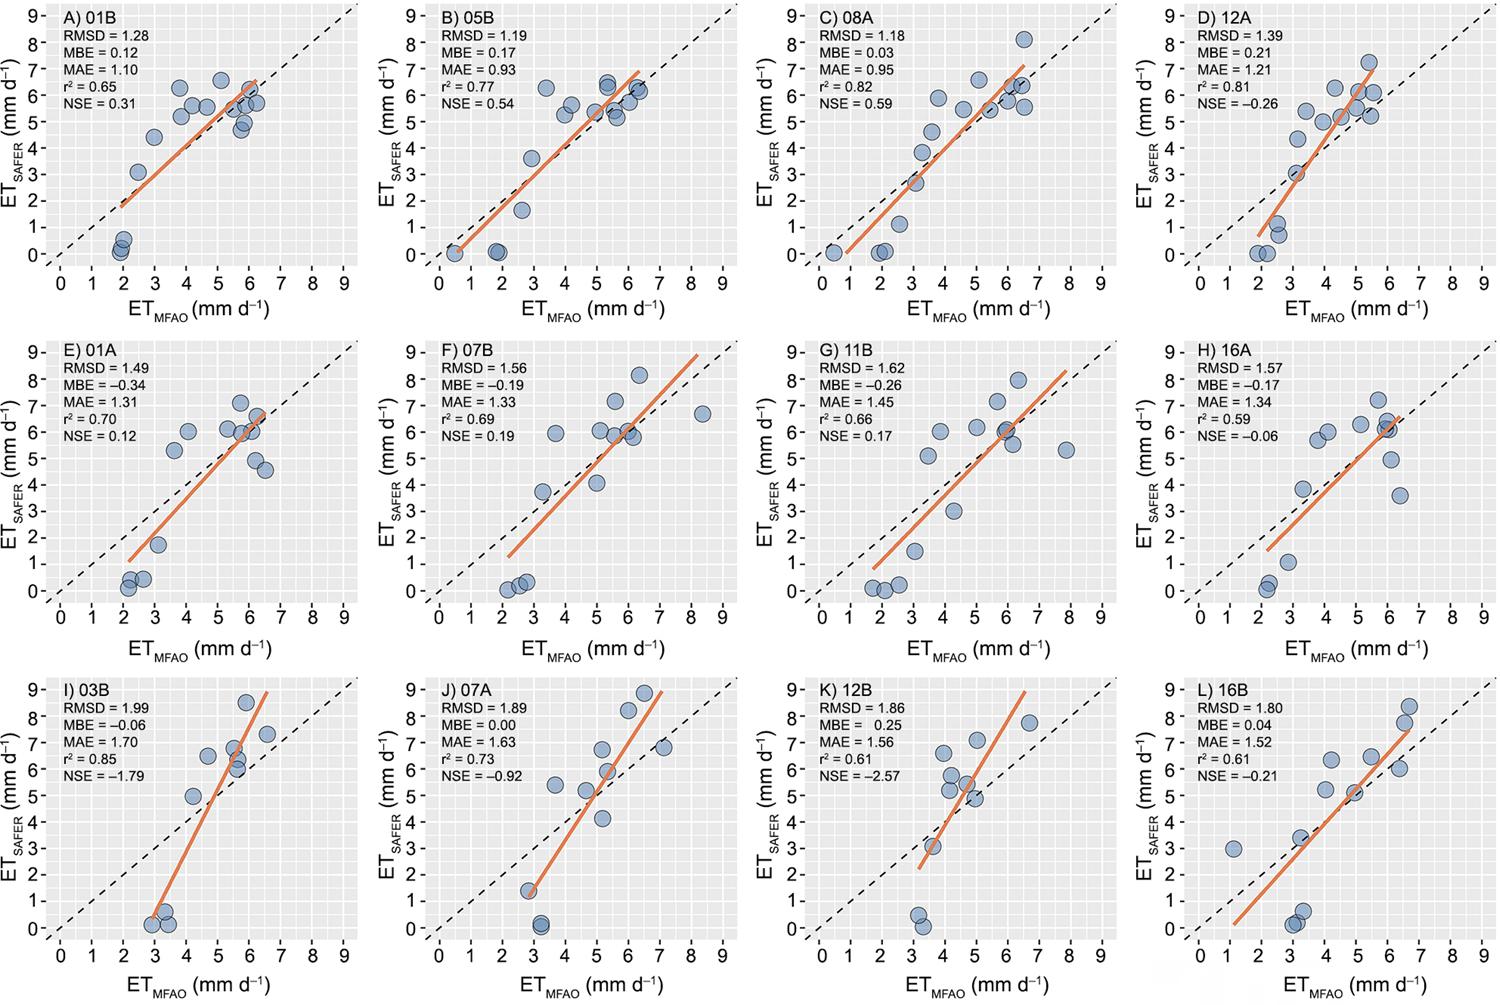
Figures 9A to 9L show scatter plots with statistical parameters between ET MFAO and ET SAFER for four center pivots selected in each of the three growing seasons (2014, 2015, and 2016). Considering only the r 2 values, agreement between ET SAFER and ET MFAO can be considered reasonable, with values greater than 0.8 in some pivots, such as 08A and 12A in 2014 ( Figures 9C and 9D , respectively) and 03B in 2016 ( Figure 9I ). However, the analysis of r 2 along with RMSD, MBE, MAE, and NSE shows that SAFER algorithm performed very poorly to estimate corn ET. For instance, in 03B pivot in 2016 ( Figure 9I ), r 2 was good (0.85); however, the RMSD value reached almost 2.00 mm d –1 , MAE was equal to 1.70 mm d –1 , and NSE was –1.79.
– Comparison between daily corn evapotranspiration (ET) estimated by SAFER algorithm (ET SAFER ) and modified FAO method (ET MFAO ) at four center pivots selected in the growing seasons of 2014, 2015, and 2016. Letters A, B, C, and D refer to center pivots 01B, 05B, 08A, and 12A, respectively, selected in growing season of 2014. Letters E, F, G, and H refers to center pivots 01A, 07B, 11B, and 16A, respectively, selected in growing season of 2015, and letters I, J, K, and L refer to center pivots 03B, 07A, 12B, and 16B, respectively, selected in growing season of 2016.
Similar results for 03B pivot were also verified in the other fields, mainly for RMSD, which remained high (greater than 1.18 mm d –1 ), and MAE (greater than 0.93 mm d –1 ), considering the magnitude of corn ET in the region. In recent years, many authors have compared ET from remote sensing-based methods with other methodologies, taking into account RMSD value to infer accuracy of estimation. Paço et al. (2014) Paço , T.A .; Pôças , I .; Cunha , M .; Silvestre , J.C .; Santos , F.L .; Paredes , P .; Pereira , L.S . 2014 . Evapotranspiration and crop coefficients for a super intensive olive orchard: an application of SIMDualKc and METRIC models using ground and satellite observations . Journal of Hydrology 519 : 2067 - 2080 ., for example, compared METRIC (Allen et al., 2007 Allen , R.G .; Tasumi , M .; Trezza , R . 2007 . Satellite-based energy balance for mapping evapotranspiration with internalized calibration (METRIC) - Model . Journal of Irrigation and Drainage Engineering 133 : 380 - 394 .) and FAO-56 dual K c approach (Allen et al., 1998 Allen , R.G .; Pereira , L.S .; Raes , D .; Smith , M . 1998 . Crop Evapotranspiration: Guidelines for Computing Crop Water Requirements . FAO , Rome, Italy . ( Irrigation and Drainage Paper, 56 ).) and considered an RMSD value less than 0.44 mm d –1 to be low. Silva et al. (2018a) compared SEBAL and FAO-56 (single K c approach) and considered SEBAL results to be satisfactory because the difference in the estimates was less than or equal to 1.00 mm d –1 . Generally, RMSD values or differences in the estimates greater than 1 mm d –1 are not satisfactory.
An equilibrium was observed for MBE, as SAFER underestimated corn ET for all center pivots in 2015 ( Figures 9E , 9F , 9G and 9H ) and for 03B in 2016 ( Figure 9I ), and overestimated ET for the rest of the pivots analyzed. For NSE, most values were below zero, showing that the mean value of variable observed obtained higher accuracy than the values simulated (Moriasi et al., 2007 Moriasi , D.N .; Arnold , J.G .; Van Liew , M.W .; Bingner , R.L .; Harmel , R.D .; Veith , T.L . 2007 . Model evaluation guidelines for systematic quantification of accuracy in watershed simulations . Transactions of the ASABE 50 : 885 - 900 .). In addition, SAFER algorithm results in major underestimations, with values practically equal to zero, when evapotranspiration estimated from ET MFAO is lower than 3 mm d –1 (Figures 9A to 9L), which normally occurs early in the growing season. In summary, the statistical parameters discussed in Figures 9A to 9L demonstrate the poorness of SAFER algorithm to estimate corn ET with original regression coefficients.
Figures 10A , 10B , and 10C show the seasonal cycle of daily ET SAFER and ET MFAO for 2014, 2015, and 2016 growing seasons, respectively. For both methodologies, daily ET had a strong seasonal cycle, with low values in the initial stage, high values during crop development and midseason stages, and a decrease in the late-season stage until harvest, normally between 135 and 150 days after sowing, in Brazil.
– Temporal evolution of daily corn evapotranspiration (ET) estimated by SAFER algorithm and modified FAO method for all center pivots cultivated during the growing seasons of 2014 (A), 2015 (B), and 2016 (C) regarding days after sowing (DAS). Growth stages: I (initial); II (crop development); III (midseason) and IV (late season).
When data were analyzed separately in each phenological phase, valuable information could be extracted ( Figures 10B and 10C ). First, we observed very low ET SAFER (close to zero) during the first 30 DAS, similar to the findings of Althoff et al. (2019) Althoff , D .; Alvino , F.C.G .; Filgueiras , R .; Aleman , C.C .; Cunha , F.F . 2019 . Evapotranspiration for irrigated agriculture using orbital satellites . Bioscience Journal 35 : 670 - 678 ., while ET MFAO remained between 2 and 3 mm d –1 . The main reason for the lower ET values could be the large area of exposed soil background during this period, since after this time, when the corn enters the development phase, ET values increase quickly until 70-80 DAS. Thus, as NDVI has a high positive correlation with soil cover (Barati et al., 2011 Barati , S. ; Rayegani , B. ; Saati , M. ; Sharifi , A. ; Nasri , M. 2011 . Comparison the accuracies of different spectral indices for estimation of vegetation cover fraction in sparse vegetated areas . Egyptian Journal of Remote Sensing and Space Science 14 : 49 - 56 .; Jiang et al., 2006 Jiang , Z .; Huete , A.R .; Chen , J .; Chen , Y .; Li , J .; Yan , G .; Zhang , X . 2006 . Analysis of NDVI and scaled difference vegetation index retrievals of vegetation fraction . Remote Sensing of Environment 101 : 366 - 378 .; Zhang et al., 2006 Zhang , X .; Yan , G .; Li , Q .; Li , Z.L .; Wan , H .; Guo , Z . 2006 . Evaluating the fraction of vegetation cover based on NDVI spatial scale correction model . International Journal of Remote Sensing 27 : 5359 - 5372 .) among the input variables to SAFER (α 0 , NDVI and T 0 ), it is possible to affirm that SAFER algorithm has a high dependence on NDVI values. Moreover, in bare soils, surface temperature is greater than in soils with vegetation cover (Song et al., 2015 Song , L .; Liu , S .; Kustas , W.P .; Zhou , J .; Ma , Y. 2015 . Using the surface temperature-albedo space to separate regional soil and vegetation temperatures from ASTER data . Remote Sensing 7 : 5828 - 5848 .), favoring low ET f values determined by equation 8.
During crop development stage (II), the opposite of the initial phase occurred, with SAFER algorithm presenting higher ET values in comparison to the MFAO method ( Figures 10A , 10B and 10C ). In addition, during the last two stages (III and IV), there was more agreement between the data; however, with ET SAFER slightly greater than ET MFAO . In summary, these results indicate that SAFER algorithm does not have capacity to estimate ET accurately, especially during the initial (underestimates) and crop development stages (overestimates).
The results of ET f in Figure 8 show the poor agreement for corn ET based on the statistical parameters ( Figures 9A to 9L ) along with poor estimation for the first 30 DAS and overestimation during the crop development stage ( Figures 10A , 10B and 10C ). Thus, showing that SAFER algorithm is not appropriate for this environment with the original parameters (a and b). We performed the second object of the study, that is, re-calibration of coefficients to increase SAFER performance for corn ET estimation at the farm level in a Brazilian semiarid region.
SAFER calibration
After calibration, the values determined for “a” and “b” coefficients were 0.32 and –0.0013, respectively, with final MSE of 0.0105. Both coefficients were very different to the value for semiarid environments (a = 1.8 and b = –0.008) recommended by Teixeira et al. (2013) Teixeira , A.H.C .; Scherer-Warren , M .; Hernandez , F.B.T .; Andrade , R.G .; Leivas , J.F . 2013 . Large-scale water productivity assessments with MODIS images in a changing semi-arid environment: a Brazilian case study . Remote Sensing 5 : 5783 - 5804 .. Because the region in our study is also semiarid, we considered these differences high. The study of Teixeira et al. (2013) Teixeira , A.H.C .; Scherer-Warren , M .; Hernandez , F.B.T .; Andrade , R.G .; Leivas , J.F . 2013 . Large-scale water productivity assessments with MODIS images in a changing semi-arid environment: a Brazilian case study . Remote Sensing 5 : 5783 - 5804 ., as well as others using SAFER (Dehziari and Sanaienejad, 2019 Dehziari , S.A .; Sanaienejad , S.H . 2019 . Energy balance quantification using Landsat 8 images and SAFER algorithm in Mashhad, Razavi Khorasan, Iran . Journal of Applied Remote Sensing 13 : 014528 .; Teixeira, 2010 Teixeira , A.H.C . 2010 . Determining regional actual evapotranspiration of irrigated crops and natural vegetation in the São Francisco river basin (Brazil) using remote sensing and Penman-Monteith equation . Remote Sensing 2 : 1287 - 1319 .; Teixeira et al., 2017 Teixeira , A.H.C .; Leivas , J.F .; Hernandez , F.B.T .; Franco , R.A.M . 2017 . Large-scale radiation and energy balances with Landsat 8 images and agrometeorological data in the Brazilian semiarid region . Journal of Applied Remote Sensing 11 : 016030 .), were conducted in large areas (e.g., river basins), which are very heterogeneous under water scarcity and natural vegetation, totally different from irrigated corn plantations. Thus, many of these differences can be attributed to these facts. In addition, comparison with areas similar to our study site (monoculture and irrigated) is difficult because this is the first study to use SAFER algorithm with newer-calibrated coefficients.
Figure 11A shows correlations between ET fSAFER with calibrated regression coefficients and ET fMFAO along with statistics for the comparison. Figure 11B also presents a scatter plot graph; however, the comparison is the actual crop evapotranspiration data. Calibration of ET fSAFER showed reasonable agreement with estimates relatively close to 1:1 line and r 2 and NSE values equal to 0.75 ( Figure 11A ). Values of RMSD (0.102) and MAE (0.092) were low, with MBE = –0.001, the calibrated SAFER algorithm tended to underestimate the data; however, the difference was almost non-significant. Overall, these results show a good improvement compared to previous results (without calibration).
– Comparison of fractions between actual (ET) and reference (ET o ) evapotranspiration (ET f ) estimated by SAFER with calibrated regression coefficients (ET fSAFER ) and ET f estimated by the modified FAO method (ET fMFAO ) (A). The ET estimated by SAFER with calibrated regression coefficients (ET SAFER ) and ET estimated by the modified FAO method (ET MFAO ) (B), using data of all center pivots cultivated during the growing seasons of 2014 and 2015. In the figure, ***indicates regression significance at p < 0.001.
Crop ET after calibration showed excellent agreement, with r 2 and NSE values equal to 0.91 ( Figure 11B ). RMSD and MAE were similar, with values lower than 0.5 mm d –1 , considered very good values. MBE for ET was slightly negative (–0.030), meaning, in general terms, a slight underestimation of ET data by SAFER algorithm ( Figure 11B ). This comparison between MFAO and SAFER methodologies is very satisfactory, as MFAO considers the water stress effect (using the K S ) on crop transpiration and crop coefficient calibrated under field conditions, meaning that ET represents an accurate estimation of ET under field conditions.
SAFER validation
Figures 12A to 12N show comparison between ET SAFER with calibrated regression coefficients and ET MFAO for each center pivot and one involving all center pivots in the growing season (GS) of 2016 ( Figure 12O ). The validation results showed good agreement, with estimates close to 1:1 line, and, based on r 2 value, ET values from SAFER explained between 66 and 97 % of data variation estimated by the modified FAO method ( Figures 12A to 12N ). Only one field, 13B ( Figure 12K ), presented r 2 value lower than 0.7 (r 2 = 0.66), with most values greater than 0.77. In general, the results determined for r 2 can be classified as very good and excellent, since most center pivots had r 2 values above 0.84, and some had r 2 values above 0.9. NSE values reinforced the very good agreement based on r 2 , with values reaching 0.92 for center pivot 04B ( Figure 12B ) and most fields with values greater than 0.7. Thus, SAFER algorithm can be classified as good (0.65 ≤ NSE ≤ 0.75) or very good (NSE > 0.75) according to Moriasi et al. (2007) Moriasi , D.N .; Arnold , J.G .; Van Liew , M.W .; Bingner , R.L .; Harmel , R.D .; Veith , T.L . 2007 . Model evaluation guidelines for systematic quantification of accuracy in watershed simulations . Transactions of the ASABE 50 : 885 - 900 . for estimating ET in an irrigated corn crop.
– SAFER algorithm validation results using corn evapotranspiration (ET) data estimated by the modified FAO method collected during the growing season of 2016. Letters A, B, C, D, E, F, G, H, I, J, K, L, M, N, and O refer to center pivots 01B, 04B, 05B, 06A, 07A, 08A, 09A, 10A, 11A, 12B, 13B, 14B, 15B, 16B and all center pivots harvested in this season, respectively. *indicates regression significance at p < 0.05, **indicates regression significance at p < 0.01 and ***indicates regression significance at p < 0.001.
Overall, SAFER algorithm tended to overestimate slightly corn ET, since MBE was positive for 10 out of 14 center pivots analyzed. Regarding the magnitude, the highest MBE (0.68 mm d –1 ) was verified in pivot 11A ( Figure 12I ). MAE was low, close to 0.5, ranging between 0.34 and 0.68. Given that the ET average value for corn crop in the study site was approximately 4.2 mm d –1 from Apr to Oct, MBE and MAE could be considered low.
Center pivots in the 2016 growing season were also analyzed together and the results were similar to those observed for individual pivots ( Figure 12O ). NSE was 0.82, with 83 % of scatter close to 1:1 line (r 2 = 0.84). RMSD was 0.58 and MAE was 0.48 mm d –1 . MBE was positive (MBE = 0.18 mm d –1 ), indicating that SAFER algorithm tended to overestimate corn ET, as mentioned above. These results are considered very good and allow to confirm calibration accuracy and assert that SAFER algorithm is capable of estimating corn ET accurately in a semiarid region and in other environments with similar conditions.
Very few studies have been published in the scientific literature with SAFER algorithm involving large areas with monocultures under full irrigation (e.g., corn) in semiarid regions. Most studies available to the scientific community were conducted in large areas involving different crops, cultivation systems, and edaphoclimatic conditions (Andrade et al., 2016 Andrade , R.G .; Teixeira , A.H.C .; Leivas , J.F .; Nogueira , S.F . 2016 . Analysis of evapotranspiration and biomass in pastures with degradation indicatives in the Upper Tocantins River Basin, in Brazilian Savanna . Revista Ceres 63 : 754 - 760 .; Coaguila et al., 2017 Coaguila , D.N .; Hernandez , F.B.T .; Teixeira , A.H.C .; Franco , R.A.M .; Leivas , J.F. 2017 . Water productivity using SAFER: Simple Algorithm for Evapotranspiration Retrieving in watershed . Revista Brasileira de Engenharia Agrícola e Ambiental 21 : 524 - 529 .; Dehziari and Sanaienejad, 2019 Dehziari , S.A .; Sanaienejad , S.H . 2019 . Energy balance quantification using Landsat 8 images and SAFER algorithm in Mashhad, Razavi Khorasan, Iran . Journal of Applied Remote Sensing 13 : 014528 .; Teixeira et al., 2017 Teixeira , A.H.C .; Leivas , J.F .; Hernandez , F.B.T .; Franco , R.A.M . 2017 . Large-scale radiation and energy balances with Landsat 8 images and agrometeorological data in the Brazilian semiarid region . Journal of Applied Remote Sensing 11 : 016030 .), that is, heterogeneous areas. Thus, our field study is somewhat novel, also demonstrating that SAFER algorithm needs to be evaluated carefully before its application in irrigated monoculture areas, since the algorithm underestimated (first 30 DAS) and overestimated (after 30 DAS) ET f and, consequently, ET.
The authors acknowledge that a more robust validation study could have been conducted if we had used field data measured by an eddy covariance system or lysimeters, for example. However, these approaches do not represent the reality of Brazilian farms to estimate evapotranspiration for irrigation management purposes. On the other hand, the MFAO method has been applied with success in Brazil by scientific research as well as hundreds of irrigators by means of IRRIGER company for over 14 years, becoming the main irrigation management methodology in Brazilian farms. Therefore, the MFAO method is considered a reliable source of field-level ET data.
Last, we used an extensive field-level dataset of actual corn ( Zea mays L.) evapotranspiration from a farm that consisted of 17 irrigated fields (center pivots), 12, 15, and 15 cultivated fields in 2014, 2015, and 2016 growing seasons, respectively. Thus, there were 42 cultivated fields in three seasons covering an area of 3,357 and conferring variability and repeatability of the analyses.
Conclusions
The SAFER algorithm was tested on fully irrigated corn crop in the western region of Bahia State, a semiarid region in Brazil, under climatic and vegetation conditions that were slightly different from the conditions of algorithm validation (relatively larger areas in a semiarid region involving irrigated crops and natural vegetation). For these cornfield conditions, SAFER algorithm without calibration performed very poorly to estimate corn ET. The RMSD value was greater than 1.8 mm d –1 in four fields and was always higher than 1.18 mm d –1 for 12 fields analyzed, and the NSE values were lower than zero in most fields.
Regarding the periods, up to 30 DAS, SAFER was very inconsistent, with ET values close to zero. When regression coefficients of ET f were calibrated, there was good agreement (RMSD = 0.012, MBE = –0.001, MAE = 0.008 and r 2 = NSE = 0.85). Validation with ET data from 2016 provided good performance of SAFER algorithm (r 2 = 0.84), with low RMSD (0.58 mm d –1 ), MBE (0.18 mm d –1 ), and MAE (0.48 mm d –1 ) values for the set of 14 center pivots cultivated in this growing season. Using validation data (2016 growing season) and taking into account all center pivots harvested in this season, cumulative ET for SAFER and MFAO was 616.44 and 595.15 mm, respectively. An overestimate of only 3.5 % of SAFER in comparison to the MFAO method.
SAFER integration with field observations can be very beneficial for precision irrigation, allowing better water use in irrigation management, particularly in environments where water is scarce.
Acknowledgements
This study was partially financed (PhD scholarship) by the Coordination for the Improvement of Higher Level Personnel (CAPES) - Finance Code 001 and by the Brazilian National Council for Scientific and Technological Development (CNPq). Thanks to the Water for Food Global Institute at the University of Nebraska (UNL), where the first author conducted part of his doctoral research. The authors are also grateful to the company IRRIGER – Irrigation Management and Engineering for making available the field data.
References
- Allen , R.G .; Tasumi , M .; Trezza , R .; Waters , R .; Bastiaanssen , W . 2002 . SEBAL: surface energy balance algorithms for land. Idaho implementation, advanced training and user’s manual, version 1.0 . University of Idaho , Moscow, ID, USA .
- Allen , R.G .; Pereira , L.S .; Raes , D .; Smith , M . 1998 . Crop Evapotranspiration: Guidelines for Computing Crop Water Requirements . FAO , Rome, Italy . ( Irrigation and Drainage Paper, 56 ).
- Allen , R.G .; Tasumi , M .; Trezza , R . 2007 . Satellite-based energy balance for mapping evapotranspiration with internalized calibration (METRIC) - Model . Journal of Irrigation and Drainage Engineering 133 : 380 - 394 .
- Althoff , D .; Alvino , F.C.G .; Filgueiras , R .; Aleman , C.C .; Cunha , F.F . 2019 . Evapotranspiration for irrigated agriculture using orbital satellites . Bioscience Journal 35 : 670 - 678 .
- Alvares , C.A .; Stape , J.L .; Sentelhas , P.C .; Gonçalves , J.L.M .; Sparovek , G . 2013 . Köppen’s climate classification map for Brazil . Meteorologische Zeitschrift 22 : 711 - 728 .
- Andrade , R.G .; Teixeira , A.H.C .; Leivas , J.F .; Nogueira , S.F . 2016 . Analysis of evapotranspiration and biomass in pastures with degradation indicatives in the Upper Tocantins River Basin, in Brazilian Savanna . Revista Ceres 63 : 754 - 760 .
- Barati , S. ; Rayegani , B. ; Saati , M. ; Sharifi , A. ; Nasri , M. 2011 . Comparison the accuracies of different spectral indices for estimation of vegetation cover fraction in sparse vegetated areas . Egyptian Journal of Remote Sensing and Space Science 14 : 49 - 56 .
- Bastiaanssen , W.G.M .; Menenti , M .; Feddes , R.A .; Holtslag , A.A.M. 1998 . A remote sensing surface energy balance algorithm for land (SEBAL). 1. Formulation . Journal of Hydrology 212-213 : 198 - 212 .
- Bernardo , S .; Mantovani , E.C .; Silva , D.D .; Soares , A.A . 2019 . Irrigation Manual = Manual de Irrigação . 9 ed. Editora UFV , Viçosa, MG, Brazil ( in Portuguese ).
- Bsaibes , A. ; Courault , D. ; Baret , F. ; Weiss , M. ; Olioso , A. ; Jacob , F. ; Hagolle , O. ; Marloie , O. ; Bertrand , N. ; Desfond , V. ; Kzemipour , F. 2009 . Albedo and LAI estimates from FORMOSAT-2 data for crop monitoring . Remote Sensing of Environment 113 : 716 - 729 .
- Cao , X.C .; Shu , R .; Chen , D .; Guo , X.P .; Wang , W.G . 2018 . Temporal-spatial distributions of water use and productivity of maize in China . Journal of Agricultural Science 156 : 528 - 536 .
- Coaguila , D.N .; Hernandez , F.B.T .; Teixeira , A.H.C .; Franco , R.A.M .; Leivas , J.F. 2017 . Water productivity using SAFER: Simple Algorithm for Evapotranspiration Retrieving in watershed . Revista Brasileira de Engenharia Agrícola e Ambiental 21 : 524 - 529 .
- Costa , J.O .; Coelho , R.D .; Wolff , W .; José , J.V .; Folegatti , M.V .; Ferraz , S.F.B . 2018 . Spatial variability of coffee plant water consumption based on the SEBAL algorithm . Scientia Agricola 76 : 93 - 101 .
- Dehziari , S.A .; Sanaienejad , S.H . 2019 . Energy balance quantification using Landsat 8 images and SAFER algorithm in Mashhad, Razavi Khorasan, Iran . Journal of Applied Remote Sensing 13 : 014528 .
- Doorenbos , J .; Pruitt , W.O . 1977 . Guidelines for predicting crop water requirements . FAO , Rome, Italy . ( Irrigation and Drainage Paper, 24 ).
- Eichelmann , E. ; Wagner-Riddle , C. ; Warland , J. ; Deen , B. ; Voroney , P. 2016 . Comparison of carbon budget, evapotranspiration, and albedo effect between the biofuel crops switchgrass and corn . Agriculture, Ecosystems and Environment 231 : 271 - 282 .
- Ezzahar , J .; Chehbouni , A .; Hoedjes, J.C.B .; Er-Raki , S .; Chehbouni , A .; Boulet , G .; Bonnefond , J.M .; De Bruin , H.A.R . 2007 . The use of the scintillation technique for monitoring seasonal water consumption of olive orchards in a semi-arid region . Agricultural Water Management 89 : 173 - 184 .
- Gharsallah , O. ; Facchi , A. ; Gandolfi , C. 2013 . Comparison of six evapotranspiration models for a surface irrigated maize agro-ecosystem in northern Italy . Agricultural Water Management 130 : 119 - 130 .
- Gheysari , M .; Sadeghi , S .; Loescher , H.W .; Amiri , S .; Zareian , M.J .; Majidi , M.M .; Asgarinia , P .; Payero , J.O . 2017 . Comparison of deficit irrigation management strategies on root, plant growth and biomass productivity of silage maize . Agricultural Water Management 182 : 126 - 138 .
- Hssaine , B.A .; Ezzahar , J .; Jarlan , L .; Merlin , O .; Khabba , S .; Brut , A .; Er-Raki , S .; Elfarkh , J .; Cappelaere , B .; Chehbouni , G . 2018 . Combining a two source energy balance model driven by MODIS and MSG-SEVIRI products with an aggregation approach to estimate turbulent fluxes over sparse and heterogeneous vegetation in Sahel region (Niger) . Remote Sensing 10 : 974 .
- Instituto Nacional de Meteorologia [INMET] . 2018 . Brazilian Climatological Standards 1981-2010 = Normais Climatológicas do Brasil 1981-2010 Digital edition . INMET , Brasília, DF, Brazil ( in Portuguese ).
- Irrigation Management and Engineering . [ IRRIGER ] . 2019 . About us. Available at: http://www.irriger.com.br/en-US/ [ Accessed July 1, 2019 ]
» http://www.irriger.com.br/en-US/ - Jiang , Z .; Huete , A.R .; Chen , J .; Chen , Y .; Li , J .; Yan , G .; Zhang , X . 2006 . Analysis of NDVI and scaled difference vegetation index retrievals of vegetation fraction . Remote Sensing of Environment 101 : 366 - 378 .
- Keller , J .; Bliesner , R.D . 1990 . Sprinkle and Trickle Irrigation . Van Nostrand Reinold , New York, NY, USA .
- Lasdon , L.S .; Waren , A .; Jain , A .; Ratner , M . 1978 . Design and testing of a generalized reduced gradient code for nonlinear programming . ACM Transactions on Mathematical Software 4 : 34 - 50 .
- Liaqat , U.W .; Choi , M .; Awan , U.K. 2015 . Spatio-temporal distribution of actual evapotranspiration in the Indus Basin Irrigation System . Hydrological Processes 29 : 2613 - 2627 .
- Lima , A.L.B .; Filgueiras , R .; Mantovani , E.C .; Althoff , D .; Santos , R.A .; Venancio , L.P. 2019 . Biophysical parameters and actual evapotranspiration of bean culture by means of remote sensing . Journal of Agricultural Science 11 : 156 - 166
- Mantovani , E.C .; Bernardo , S .; Palaretti , L.F . 2006 . Irrigation: Principles and Methods = Irrigação: Princípios e Métodos . Editora UFV , Viçosa, MG, Brazil ( in Portuguese ).
- Moriasi , D.N .; Arnold , J.G .; Van Liew , M.W .; Bingner , R.L .; Harmel , R.D .; Veith , T.L . 2007 . Model evaluation guidelines for systematic quantification of accuracy in watershed simulations . Transactions of the ASABE 50 : 885 - 900 .
- Nagy , A. ; Fehér , J. ; Tamás , J. 2018 . Wheat and maize yield forecasting for the Tisza river catchment using MODIS NDVI time series and reported crop statistics . Computers and Electronics in Agriculture 151 : 41 - 49 .
- Nash , J.E .; Sutcliffe , J.V. 1970 . River flow forecasting through conceptual models. Part I-a. Discussion of principles . Journal of Hydrology 10 : 282 - 290 .
- Nguy-Robertson , A. ; Gitelson , A. ; Peng , Y. ; Walter-Shea , E. ; Leavitt , B. ; Arkebauer , T. 2013 . Continuous monitoring of crop reflectance, vegetation fraction, and identification of developmental stages using a four band radiometer . Agronomy Journal 105 : 1769 - 1779 .
- Paço , T.A .; Pôças , I .; Cunha , M .; Silvestre , J.C .; Santos , F.L .; Paredes , P .; Pereira , L.S . 2014 . Evapotranspiration and crop coefficients for a super intensive olive orchard: an application of SIMDualKc and METRIC models using ground and satellite observations . Journal of Hydrology 519 : 2067 - 2080 .
- Richardson , A.D .; Keenan , T.F .; Migliavacca , M .; Ryu , Y .; Sonnentag , O .; Toomey , M . 2013 . Climate change, phenology, and phenological control of vegetation feedbacks to the climate system . Agricultural and Forest Meteorology 169 : 156 - 173 .
- Santos , O.F .; Cunha , F.F .; Taira , T.L .; Souza , E.J .; Leal , A.J.F . 2018 . Increase in pea productivity associated with irrigation management . Horticultura Brasileira 36 : 178 - 183 .
- Silva , B.B .; Mercante , E .; Boas , M.A.V .; Wrublack , S.C .; Oldoni , L.V . 2018a . Satellite-based ET estimation using Landsat 8 images and SEBAL model . Revista Ciência Agronômica 49 : 221 - 227 .
- Silva , C.O.F .; Lilla Manzione , R .; Albuquerque Filho , J . 2018 b. Large-scale spatial modeling of crop coefficient and biomass production in agroecosystems in southeast Brazil . Horticulturae 4 : 44 .
- Silva , B.B .; Braga , A.C .; Braga , C.C .; Oliveira , L.M.M .; Montenegro , S.M.G.L .; Barbosa Junior , B. 2016 . Procedures for calculation of the albedo with OLI-Landsat 8 images: application to the Brazilian semi-arid . Revista Brasileira de Engenharia Agrícola e Ambiental 20 : 3 - 8 .
- Silva , G.H .; Ferreira , M.G .; Pereira , S.B .; Delazari , F.T .; Silva , D.J.H . 2018c . Response of bell pepper crop subjected to irrigation depths calculated by different methodologies . Brazilian Journal of Agricultural and Environmental Engineering 22 : 45 - 50 .
- Song , L .; Liu , S .; Kustas , W.P .; Zhou , J .; Ma , Y. 2015 . Using the surface temperature-albedo space to separate regional soil and vegetation temperatures from ASTER data . Remote Sensing 7 : 5828 - 5848 .
- Sun , Z. ; Wei , B. ; Su , W. ; Shen , W. ; Wang , C. ; You , D. ; Liu , Z. 2011 . Evapotranspiration estimation based on the SEBAL model in the Nansi Lake Wetland of China . Mathematical and Computer Modelling 54 : 1086 - 1092 .
- Teixeira , A.H.C .; Miranda , F.R .; Leivas , J.F .; Pacheco , E.P .; Garçon , E.A.M . 2019 . Water productivity assessments for dwarf coconut by using Landsat 8 images and agrometeorological data . ISPRS Journal of Photogrammetry and Remote Sensing 155 : 150 - 158 .
- Teixeira , A.H.C . 2010 . Determining regional actual evapotranspiration of irrigated crops and natural vegetation in the São Francisco river basin (Brazil) using remote sensing and Penman-Monteith equation . Remote Sensing 2 : 1287 - 1319 .
- Teixeira , A.H.C .; Hernandez , F.B.T .; Andrade , R.G .; Leivas , J.F .; Victoria , D.C .; Bolfe , E.L. 2015 . Corn water variables assessments from earth observation data in the São Paulo state, southeast Brazil . Journal of Hydraulic Engineering 1 : 1 - 11 .
- Teixeira , A.H.C .; Leivas , J.F .; Hernandez , F.B.T .; Franco , R.A.M . 2017 . Large-scale radiation and energy balances with Landsat 8 images and agrometeorological data in the Brazilian semiarid region . Journal of Applied Remote Sensing 11 : 016030 .
- Teixeira , A.H.C .; Scherer-Warren , M .; Hernandez , F.B.T .; Andrade , R.G .; Leivas , J.F . 2013 . Large-scale water productivity assessments with MODIS images in a changing semi-arid environment: a Brazilian case study . Remote Sensing 5 : 5783 - 5804 .
- United States Geological Survey [USGS] . 2016 . Landsat 8 (L8) Data Users Handbook. U.S . Geological Survey, Sioux Falls , SD, USA .
- United States Geological Survey [USGS] . 2018 . Landsat 7 (L7) Data Users Handbook. U.S . Geological Survey, Sioux Falls , SD, USA .
- Venancio , L.P .; Chartuni , E.C .; Amaral , C.H .; Neale , C.M.U .; Gonçalves , I.Z .; Filgueiras , R .; Campos , I . 2019 . Forecasting corn yield at the farm level in Brazil based on the FAO-66 approach and soil-adjusted vegetation index (SAVI) . Agricultural Water Management 225 : 105779 .
- Vicente , M.R .; Mantovani , E.C .; Fernandes , A.L.T .; Neves , J.C.L .; Figueredo , E.M .; Delazari , F.T . 2017 . Spacial distribution of fertigated coffee root system . Ciência e Agrotecnologia 41 : 72 - 80 .
- Wang , R. ; Cherkauer , K. ; Bowling , L. 2016 . Corn response to climate stress detected with satellite-based NDVI time series . Remote Sensing 8 : 269 .
- Zhang , X .; Yan , G .; Li , Q .; Li , Z.L .; Wan , H .; Guo , Z . 2006 . Evaluating the fraction of vegetation cover based on NDVI spatial scale correction model . International Journal of Remote Sensing 27 : 5359 - 5372 .
Edited by
Publication Dates
-
Publication in this collection
08 July 2020 -
Date of issue
2021
History
-
Received
13 Nov 2019 -
Accepted
20 Feb 2020