 Moringa oleifera Genebank in Brazil: current status and future approaches
ABSTRACT
Moringa oleifera Lam. is a tropical tree that belongs to the Moringaceae family and is popularly known worldwide for its multiple applications. This study aimed to evaluate the genetic variability of individuals from the Moringa Genebank of Embrapa Tabuleiros Costeiros, Sergipe state, Brazil. The Moringa Genebank comprises 25 accessions, represented by 177 genotypes, of which 18 were transferred in from an exchanged germplasm of the University of Florida, USA, and the others were from different states in Brazil. Leaves of each genotype were collected for DNA extraction and polymerase chain reaction (PCR) analysis using 20 Inter simple sequence repeats (ISSR) primers. A total of 141 bands were amplified, and 100 % were polymorphic. The average expected heterozygosity (He) and Shannon's index were 0.11 and 0.16, respectively. The highest genetic divergence was found between the M4 and M18 accessions, both from Florida, USA, whereas the closest pair of accessions was M23 and M24, both from Brazil. The cluster analysis obtained through the Structure software divided moringa genotypes into two groups. These results suggest low genetic diversity between the accessions in the Moringa Genebank. Therefore, the introduction of new accessions in the Moringa GeneBank is essential to increasing the genetic variability of the species to ensure its conservation and improvement.
Keywords:
ISSR markers; Moringaceae; genetic resources
Introduction
Moringa oleifera Lam. belonging to the monogeneric Moringaceae family composed of 13 species, is the most popular and only cultivated species (Farooq and Koul, 2020). Native to India and spread over tropical areas, the species grows well in Africa, China, and Mexico. It is a fast-growing tree, which can reach up to 12 m in height and be propagated through both sexual and asexual reproduction. This plant has low demands for soil nutrients and water and is considered resistant to drought and diseases. Moringa oleifera is composed of a slender stem with drooping branches, white flowers, tripinnate leaves, and white-brown seeds with papery wings. It is a deciduous perennial tree, recognized for its multipurpose quality since every part of this plant has a specific application, including human and animal nutrition, medicine, soil fertilizer, foliar nutrients, green manure, biogas and biodiesel (Bancessi et al., 2020; Pandey et al., 2011).
The leaves of this plant have a variety of nutrients, such as minerals, proteins, vitamins A, B1, B2, B3, C, and E, carotenoids, and flavonoids, among other bioactive compounds. Due to these properties, moringa has been used as a food fortificant. Moreover, it has been recently recognized as a superfood, a valuable product for human and animal nutrition (Boopathi et al., 2021). This species has also been reported to have potential pharmacological effects, including antioxidants, anti-inflammatory, and anti-diabetic activity (Singh et al., 2020). The seeds are used for water purification, in which the powder extracted from the seeds has natural coagulant properties for water treatment (Milla et al., 2021). Additionally, the seeds have a high content of oil, known as "Ben", and can be used as a lubricant in both the culinary and cosmetic industries (Nair et al., 2021). In Brazil, it was introduced as an ornamental tree around 1950 and is now well distributed throughout the country, mainly in the northeastern region (Rivas et al., 2013).
Given the relevance of this species, it is essential to ensure that genetic variability is preserved to improve this resource for future breeding programs. Collections and genebanks are considered the key to this purpose (Leone et al., 2015), and in order to understand and conserve the genetic variability of M. oleifera, the Empresa Brasileira de Pesquisa Agropecuária (Embrapa) established the Moringa Genebank in 2009, located in Nossa Senhora das Dores, Sergipe state, Brazil. The initial objective was to identify superior individuals as regards nutritional characteristics for use in animal production, mainly in the production and quality of the leaves. Currently, the genebank consists of 25 accessions represented by 177 genotypes.
The evaluation of a germplasm collection represents an important step in promoting conservation actions and selecting crucial traits in a crop improvement program (Nair et al., 2021). Therefore, this study aimed to evaluate the genetic diversity of moringa genotypes from a Genebank of the Embrapa using Inter simple sequence repeats (ISSR) markers.
Materials and Methods
Collection of plant material
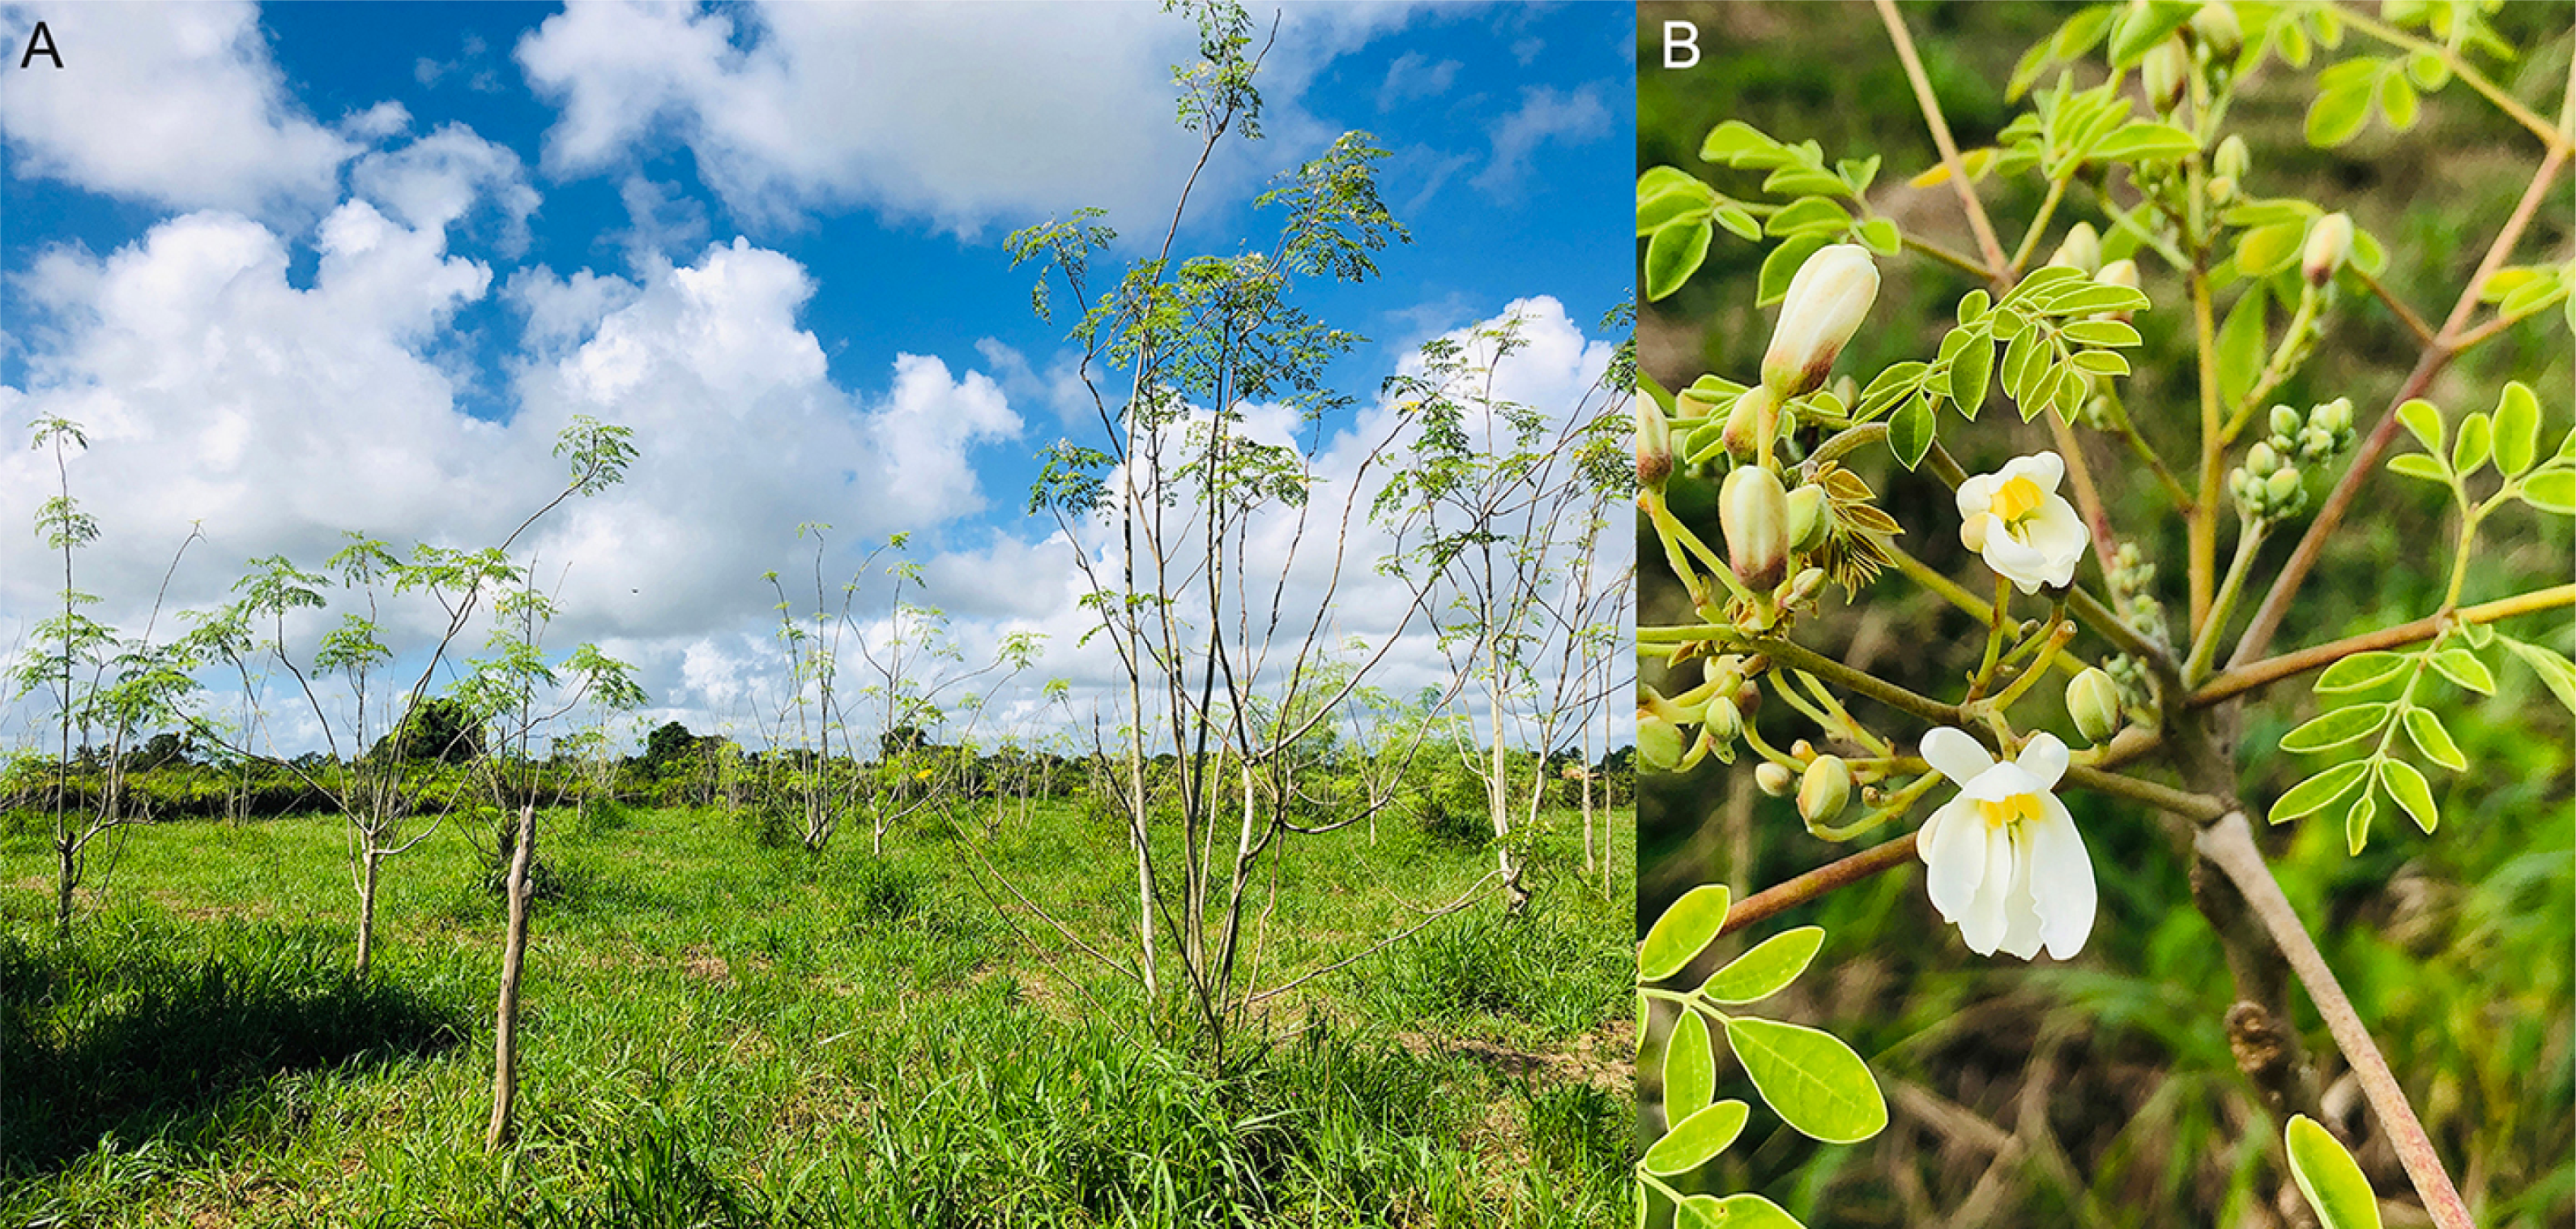
The Moringa Genebank was established in the experimental field in the city of Nossa Senhora das Dores, Sergipe state, Brazil (10°46’33" S, 37°19’16" W, altitude 204 m) (Figure 1A and B). It comprises 177 genotypes from 25 accessions, of which 18 are from exchanged germplasm of the University of Florida, USA, and the others from different states in Brazil, such as Sergipe, Pernambuco, Paraíba, Rio Grande do Norte, and Ceará (Table 1). Leaves of each genotype were collected, stored in ice to be transferred to the laboratory, and kept at −80 °C until DNA extraction.
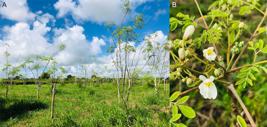
A) Moringa Genebank and (B) Inflorescence. Experimental field of Embrapa Tabuleiros Costeiros in Nossa Senhora das Dores, Sergipe state, Brazil.
Provenance and number of genotypes in the Moringa Genebank. Experimental field of Embrapa Tabuleiros Costeiros in Nossa Senhora das Dores, Sergipe state, Brazil.
DNA extraction
DNA was extracted using the protocol described by Doyle and Doyle (1990). The leaves (300 mg) were manually macerated using a mortar and pestle with the aid of liquid nitrogen using 1 mL of Cetyltrimethylammonium bromide (CTAB) buffer. A Nanodrop 2000c spectrophotometer quantified the DNA. Samples were diluted in Tris EDTA (Ethylenediaminetetraacetic acid) at a concentration of 10 ng μL−1, and then kept at −20 °C to be used in polymerase chain reaction (PCR) reactions.
PCR
The PCR mix (20 μL for each sample) consisted of 1 μL of genomic DNA solution, 2 μL 10X PCR Buffer, 0.4 μL dNTP (deoxynucleoside triphosphate) (10 mM), 0.6 μL MgCl2 (50 mM), 1 μL of each primer, 0.2 μL Taq DNA polymerase Ludwig and 14.8 μL of ultrapure water.
The samples were placed in an Axygen Maxygene thermocycler programmed to amplify the DNA. Each reaction consisted of a denaturation stage at 95 °C for 4 min, 45 cycles of amplification (denaturation at 94 °C for 45 s, annealing at each primer temperature for 45 s, and first extension at 72 °C for 2 min), followed by a final extension at 72 °C for 7 min. Twenty ISSR primers were tested (Table 2).
Sequence, annealing temperature (AT) and guanine-cytosine content (GC content) inter simple sequence repeats (ISSR) markers used to characterize the diversity and genetic structure of Moringa Genebank of Embrapa Tabuleiros Costeiros in Nossa Senhora das Dores, Sergipe state, Brazil.
Electrophoresis and ISSR marker analysis
Samples, after amplification by PCR, were submitted to electrophoresis analysis. For this, a 2 % agarose gel was placed under a constant voltage of 182V, 91 mA, and 17W for 115 min, followed by staining with ethidium bromide solution (0.5 μL mL−1 of water) for 30 min. Next, the agarose gels were submitted to visualization under ultraviolet light using Gel Doc L-pix photo documentation equipment (Loccus Biotecnologia).
Genetic diversity and statistical analysis
The bands’ presence (1) and absence (0) were transformed into a binary matrix for each gel. The genetic variability for each accession was assessed using the Shannon index, which allows for the distinguishing of the genetic variation between populations with the same number of alleles, and expected heterozygosity (He), that represents the diversity of a locus describing the proportion of heterozygous genotypes expected under the Hardy-Weinberg equilibrium (Nei, 1973), using the Genalex 6.5 software program (Peakall and Smouse, 2012).
The genetic variance between and within accessions was estimated using the Analysis of Molecular Variance (AMOVA) and the level of significance was determined by 9.999 permutations. The genetic distance between accessions (GST) was estimated (Nei, 1973), corresponding to the total genetic variation, and its significance was tested by 10.000 bootstraps. Additionally, the genetic distance of Nei between the accessions was estimated. The analyses used the Genalex 6.5 software (Peakall and Smouse, 2012).
The model of Rogers (1972) was used to evaluate the genetic distance between the accesses and was visualized by constructing a dendrogram using the unweighted pair group method with arithmetic means (UPGMA) algorithm. The analysis was carried out using the poppr package (Kamvar et al., 2014) in the software R program. The FigTree 1.4.1 software program was used to format the dendrogram. At the individual level, the principal coordinate analysis (PCoA) was carried out using the Genalex 6.5 software program.
The genetic structure of 25 accessions was estimated by the Bayesian analysis using the Structure software package v.2.3.4. The values of genetic groupings (k) varying from 1 to 25 (number of accesses) were tested, and ten independent repetitions were performed for each k. Each replicate had a burn-in period of 50,000 iterations, followed by 100,000 Markov Chain Monte Carlo (MCMC) iterations, assuming the mixture ancestry model and uncorrelated allele frequencies. The number of genetic groups (k) was identified by the ΔK method described by Evanno et al. (2005), implemented by the Structure Harvester software program. Accessions that showed membership values higher than 0.2 and lower than 0.8 were considered to have mixed ancestry.
Results
Genetic diversity indexes
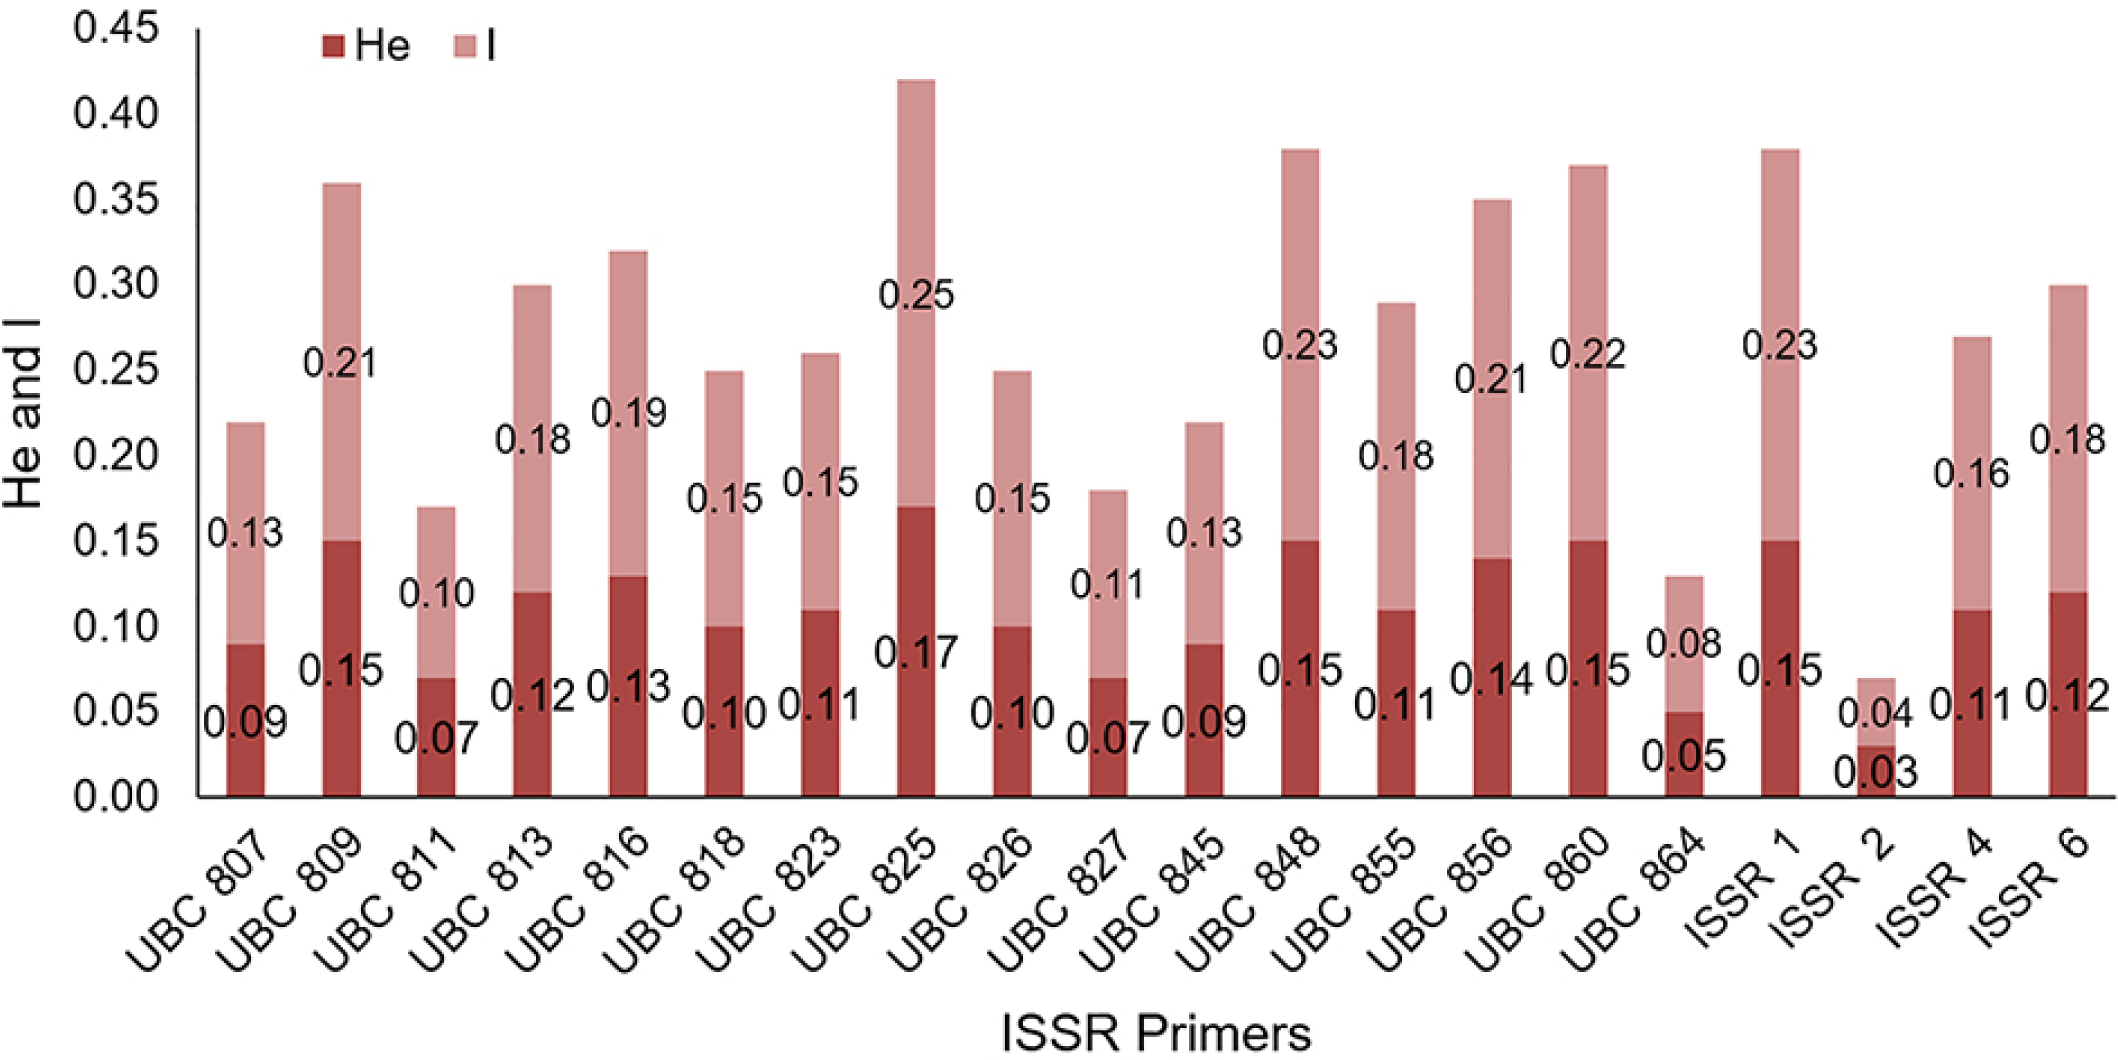
The 20 ISSR primers used in our study generated 141 bands, of which 100 % showed signs of polymorphism (Table 3). The minimum and maximum number of amplified bands ranged from three (UBC 818) to 10 (UBC 825 and 848), with an average of seven bands per primer. The He showed variations between 0.03 (ISSR2) and 0.17 (UBC 825), with an average value of 0.11. Similarly, the Shannon index ranged between 0.04 (ISSR2) and 0.25 (UBC 825), with an average value of 0.16 (Table 3; Figure 2). These results are corroborated by the AMOVA analysis, with 56 % of variance revealed within accessions and 44 % variance among accessions (Table 4).
Inter simple sequence repeat (ISSR) primers used in moringa with their respective total fragments, polymorphic fragments, polymorphism percentages, Shannon index (I) and expected heterozygosity (He).
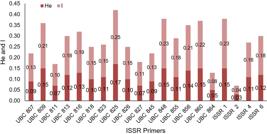
Comparison for Shannon index (I) and expected heterozygosity (He) to 25 accessions represented by 177 genotypes from of Moringa Genebank of Embrapa Tabuleiros Costeiros in Nossa Senhora das Dores, Sergipe state, Brazil. ISSR = inter simple sequence repeats.
Analysis of molecular variance (AMOVA) showing the genetic variation within and among accessions from Moringa Genebank of Embrapa Tabuleiros Costeiros based on 20 inter simple sequence repeats (ISSR) primers.
In our study, the highest coefficient of Nei's Genetic Distance was found between two accessions from the Florida exchange, M4 and M18 (0.310). On the other hand, the closest pair of accession is M23 and M24 (0.048), both from Brazil. Nei's genetic distance matrix obtained with pairwise accessions is exhibited in Table 5.
Matrix using the coefficient of Nei's Genetic Distance from Moringa Genebank of Embrapa Tabuleiros Costeiros.
Genetic distance
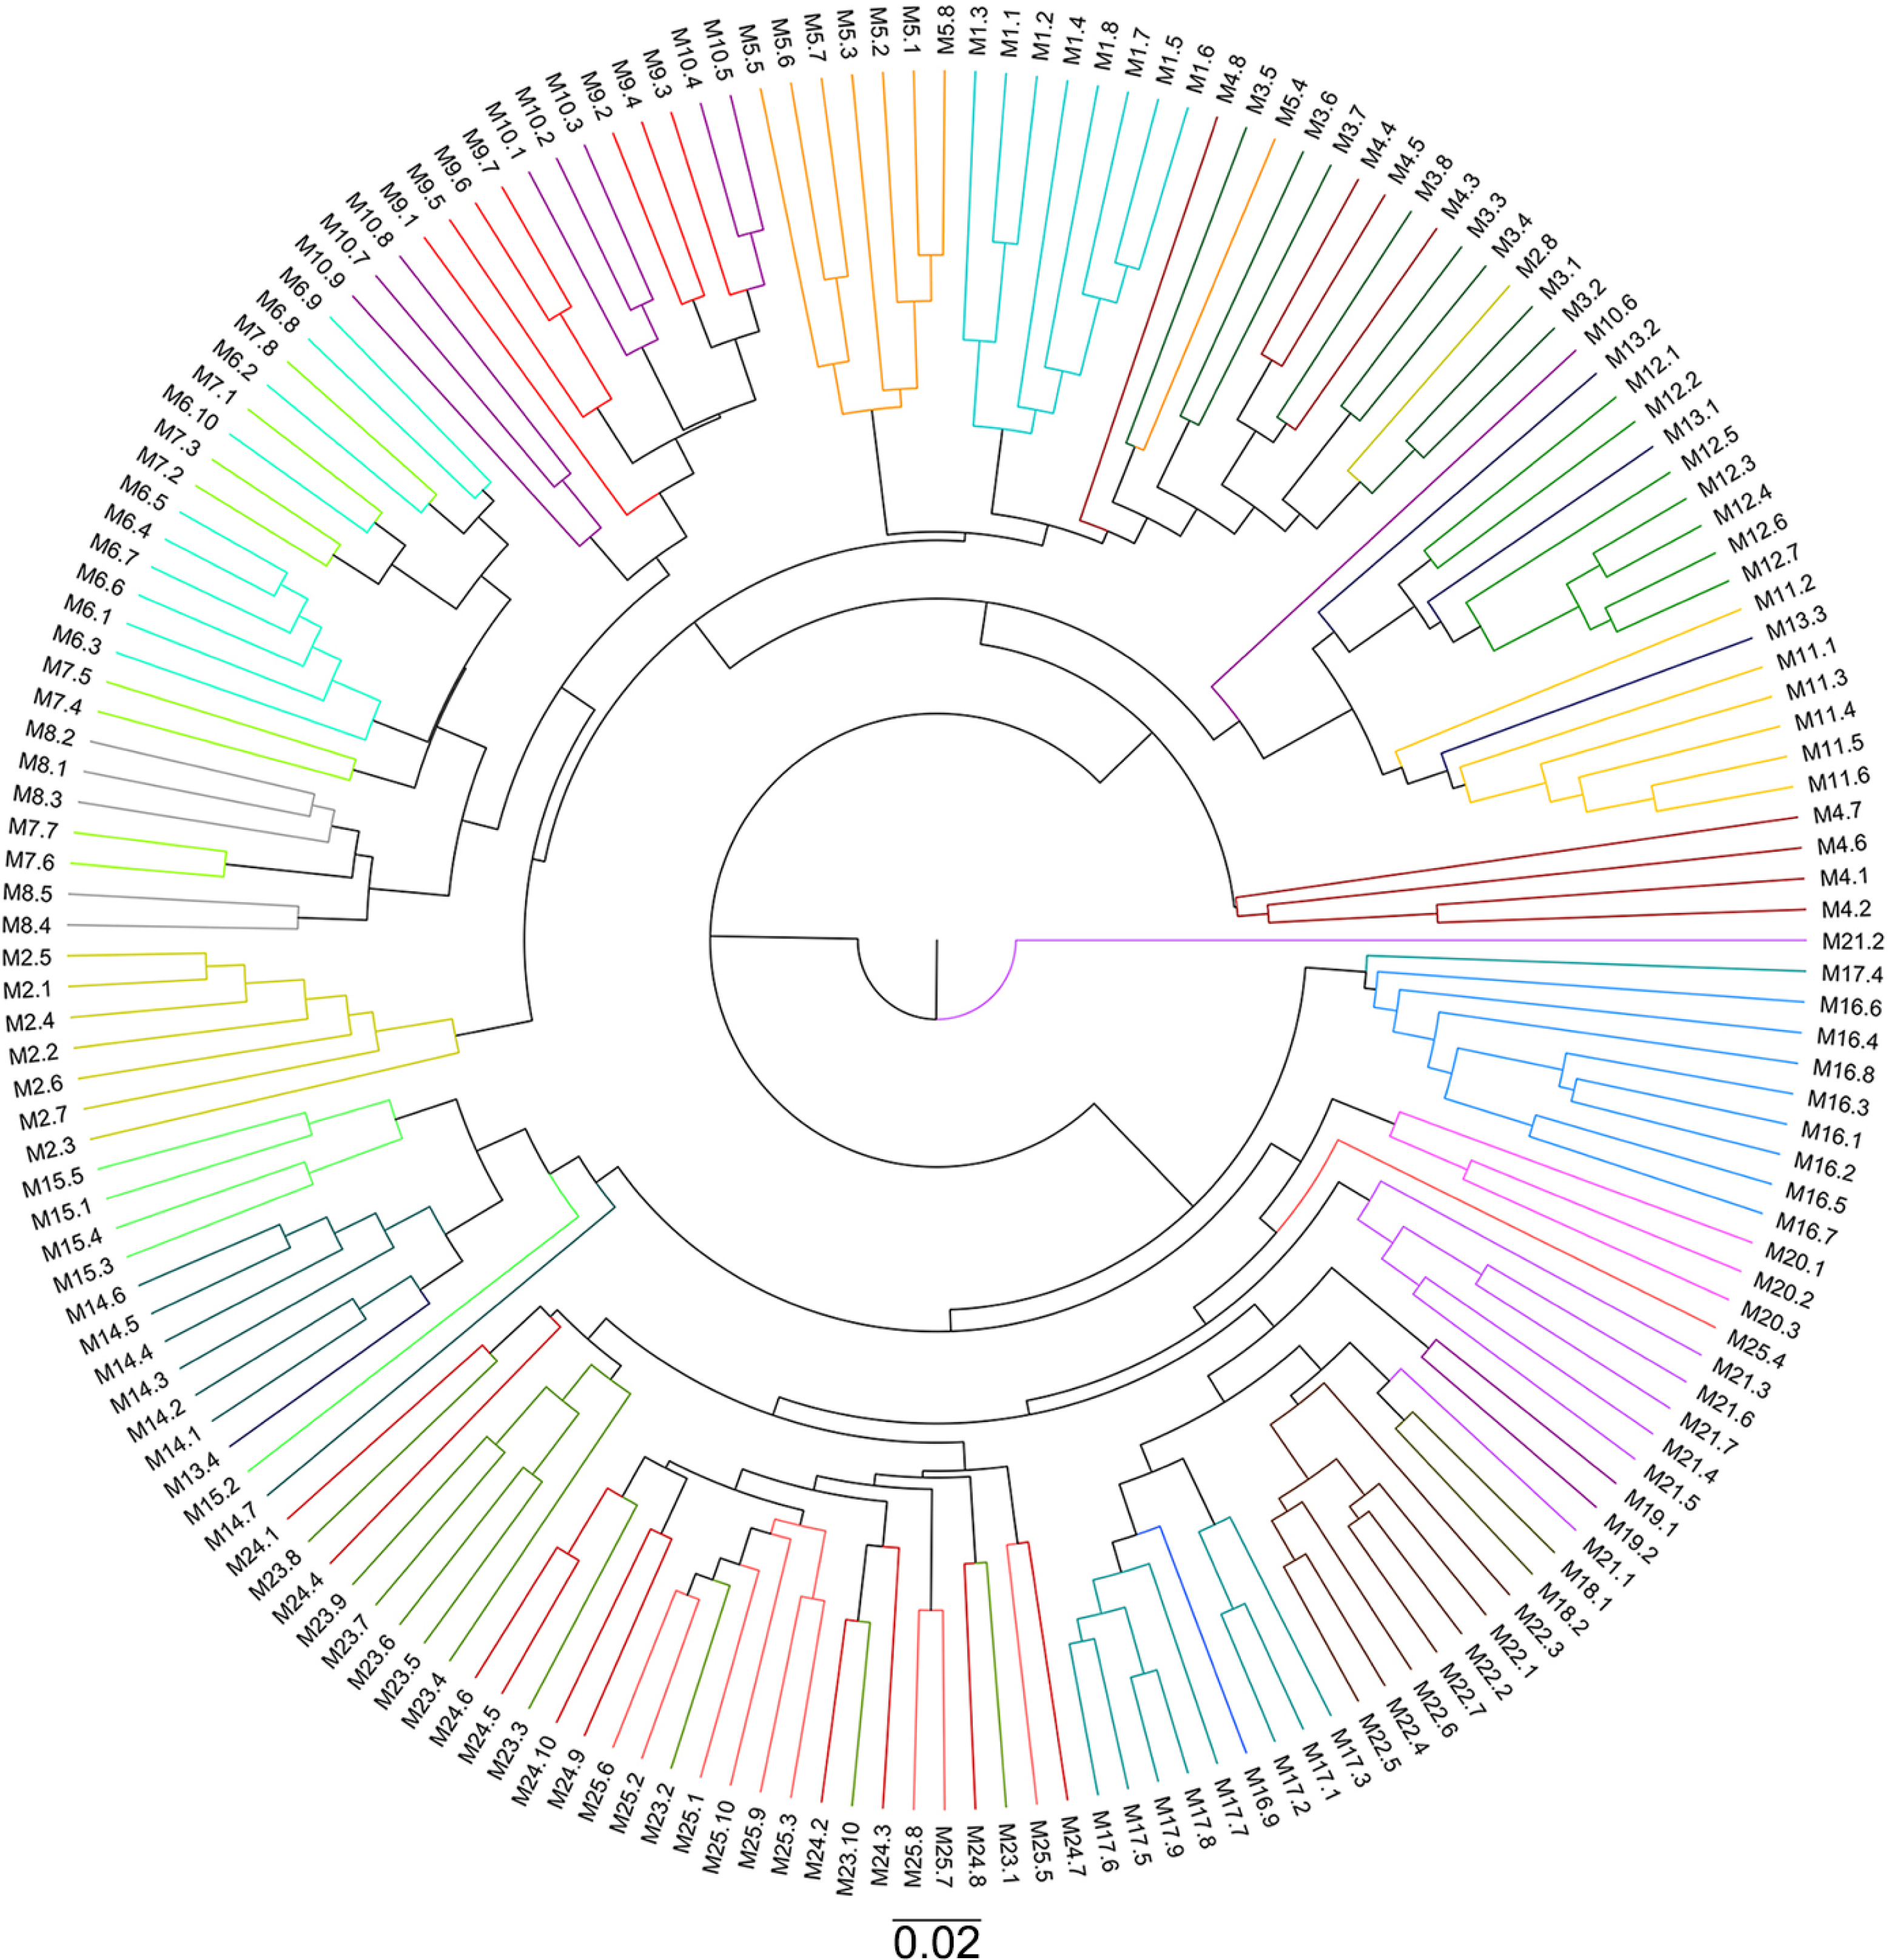
The relationship of all 177 genotypes was revealed by Roger's genetic distance (Figure 3). Moringa genotypes were categorized into two groups. One cluster was composed of M1, M2, M3, M4, M5, M6, M7, M8, M9, M10, M11, M12, and M13, in which genotypes M4.1, M4.2, M4.6, and M4.7 are highlighted for being in a different subgroup from the others. The second cluster was composed of M14, M15, M16, M17, M18, M19, M20, M21, M22, M23, M24, and M25. Within these clusters, three sub-clusters were identified, which included most of the genotypes from M16 in one sub-cluster; M14 and M15 in the second sub-cluster; and the others in the third sub-cluster. In general, the cluster analysis did not correlate with the geographic origin of the accessions.
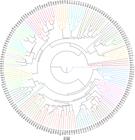
Matrix using the coefficient of Rogers from the 25 accessions represented by 177 genotypes from of Moringa Genebank of Embrapa Tabuleiros Costeiros in Nossa Senhora das Dores, Sergipe state, Brazil. Different color represents different accessions.
Genetic structure
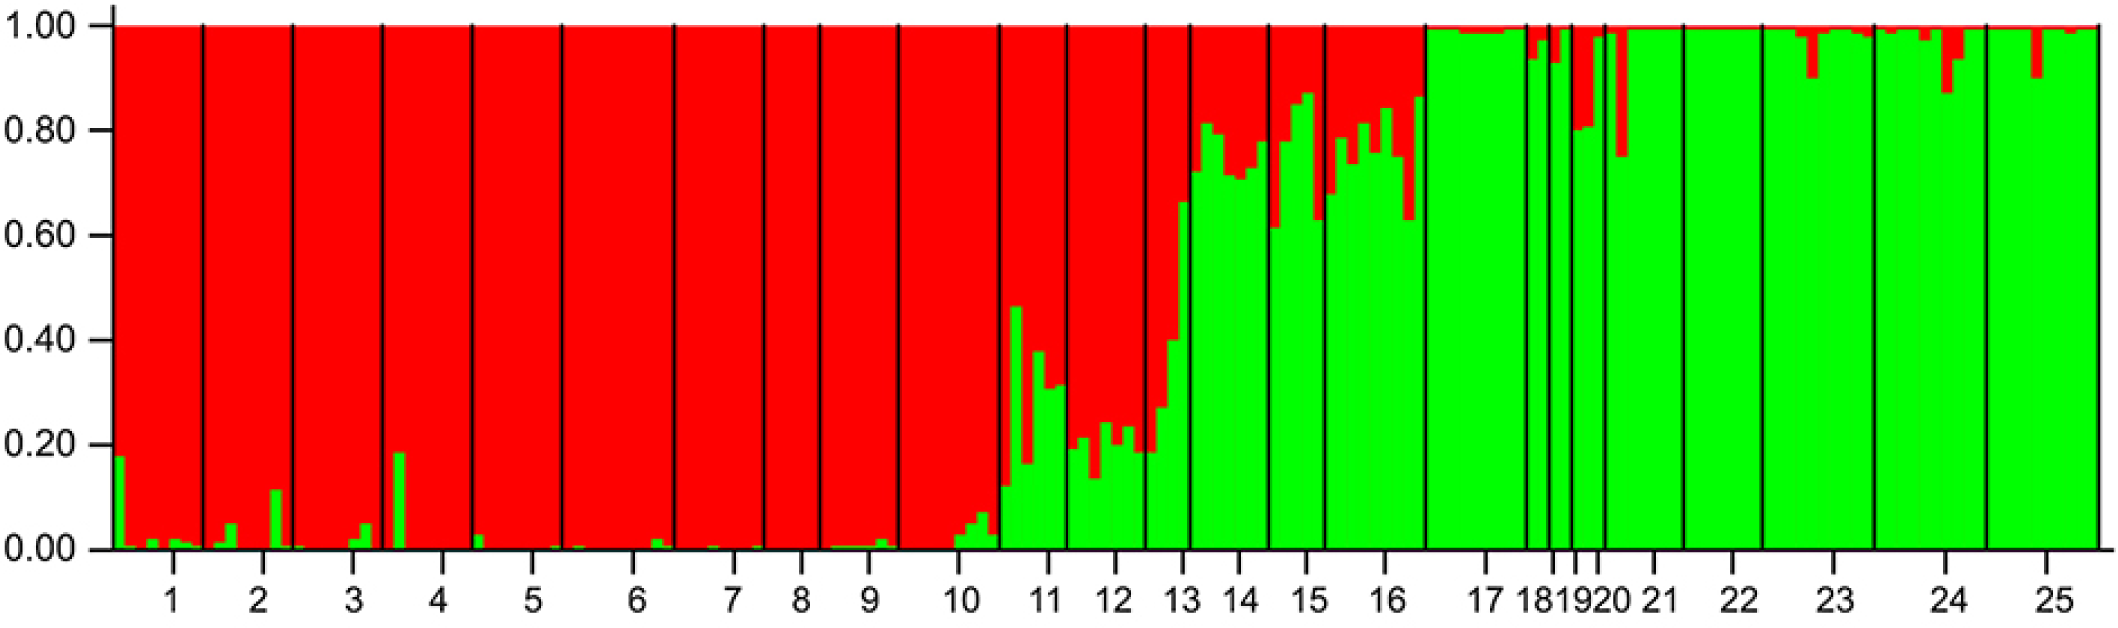
Similarly, the Bayesian analysis provided by the Structure software program grouped moringa accesses into two broad clusters (K = 2) (Figure 4). Group I (red) included all genotypes from the Florida exchange (M1, M2, M3, M4, M5, M6, M7, M8, M9, M10, M11, M12, M13), whereas accession M11, M12, and M13 were categorized as admixture (values of membership higher than 0.2). On the contrary, all accessions from Brazil (M19, M20, M21, M22, M23, M25) were ranked in Group II (green), except for M17 and M18, which were from the Florida exchange. The accessions M14, M15, and M16 were also categorized as an admixture for having membership values lower than 0.8.
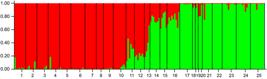
Genetic structure analysis of 25 accessions represented by 177 genotypes from Moringa Genebank of Embrapa Tabuleiros Costeiros in Nossa Senhora das Dores, Sergipe state, Brazil, according to the Bayesian analysis groupings using the Structure program for K = 2 with separated by accession. Colors represented the two groups identified and the length of each color represents the genomic composition of each individual. 1 to 28 = accessions studied. Group I = red (M1, M2, M3, M4, M5, M6, M7, M8, M9, M10, M11, M12, M13) and Group II = green (M19, M20, M21, M22, M23, M25).
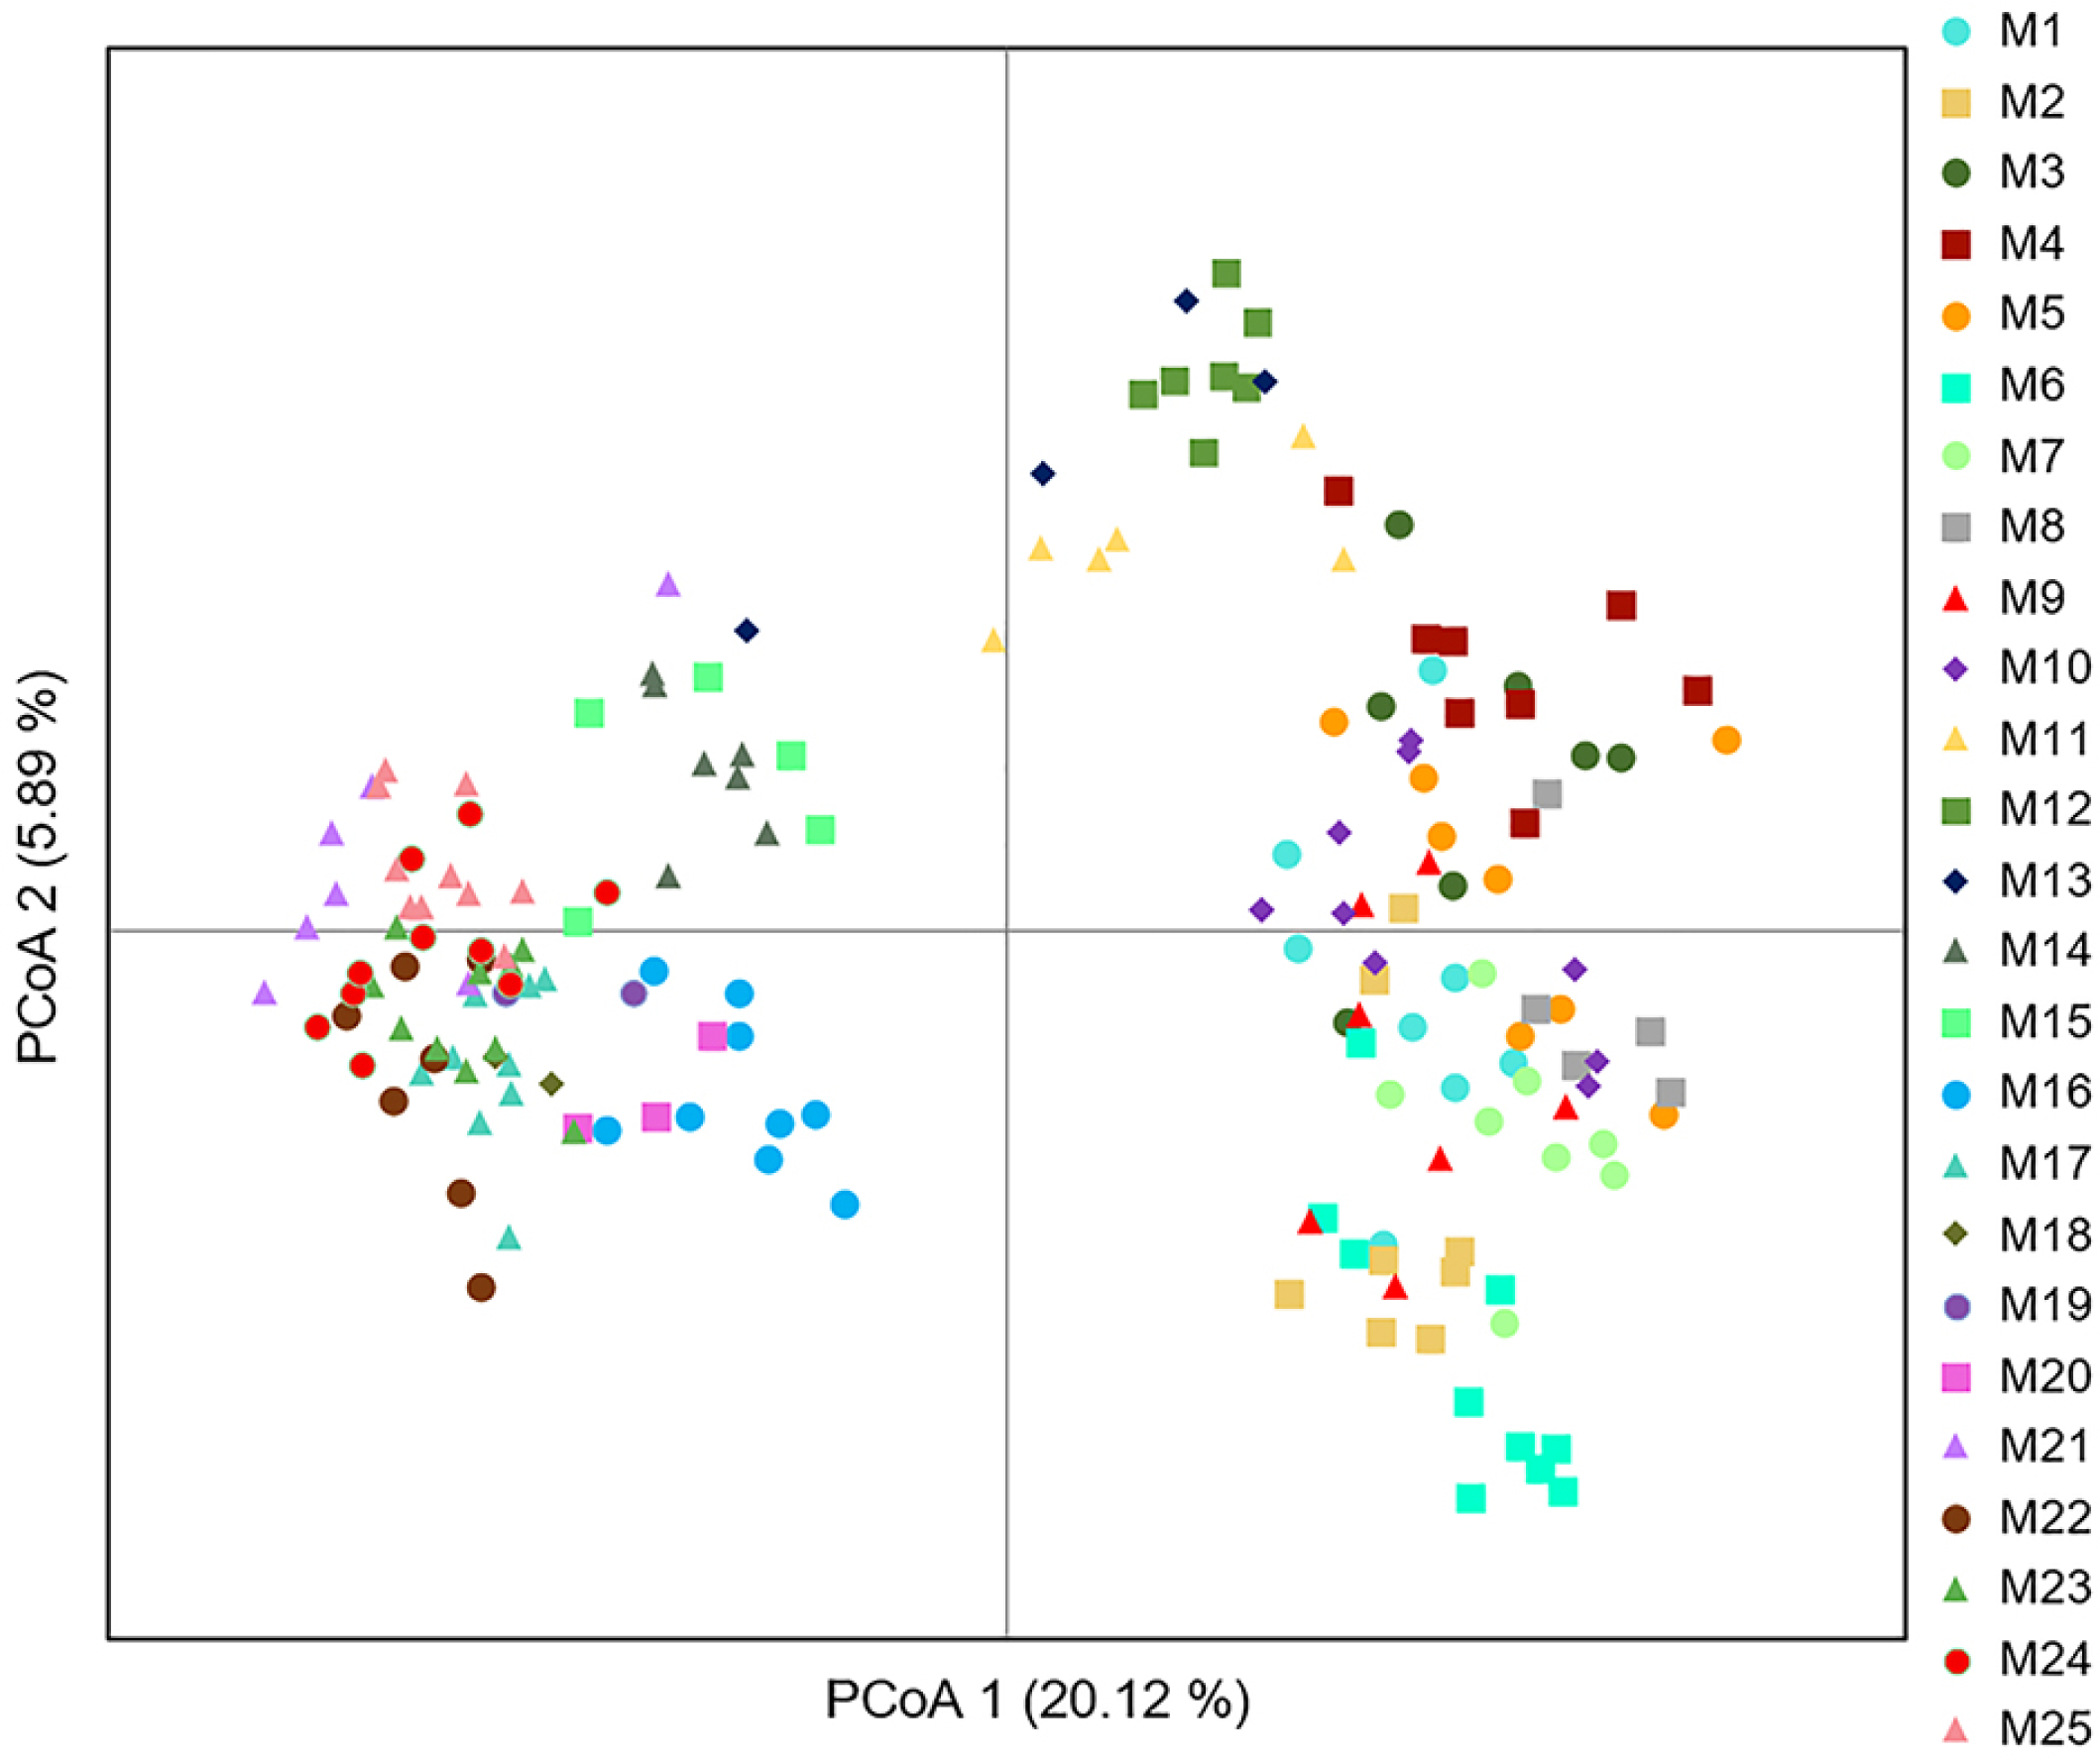
Principal coordinate analysis (PCoA) with ISSR markers showed the distribution of genetic diversity among the accessions across the two axes. The percentage of variation explained was 26.01 % (PCoA 1: 20.12 % and PCoA 2: 5.89 %) (Figure 5), which agreed with both groups formed in the aforementioned cluster analysis.
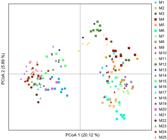
Principal coordinate analysis (PCoA) in 25 accessions represented by 177 genotypes from Moringa Genebank of Embrapa Tabuleiros Costeiros in Nossa Senhora das Dores, Sergipe state, Brazil.
Discussion
Despite the wide cultivation of moringa in America, there are only a few studies that have attempted to assess the genetic variation of the species, including studies from Mexico (Avila-Treviño et al., 2017) and Colombia (Chaves-Bedoya et al., 2017). Previously, the first molecular characterization of the Moringa Genebank was conducted with only 16 accessions from the exchanged germplasm of the University of Florida, using Random Amplified Polymorphic DNA (RAPD) markers (Silva et al., 2012). Low genetic diversity between the accessions evaluated was found. Since then, new accessions of moringa collected in Brazil have been introduced, and our study represents the first molecular evaluation of genotypes from Brazil using ISSR primers for this species.
Previous studies have reported ISSR primers as an effective molecular marker for characterizing genetic diversity in moringa (Hassan et al., 2020; Hassanein, 2018; Rajalakshmi et al., 2019; Saini et al., 2013). In our study, all observed bands were polymorphic. Similar findings were reported by Hassanein (2018), in which 10 ISSR primers amplified 65 bands and 90.8 % were polymorphic for both species Moringa oleifera and Moringa peregrine (Forssk.) Fiori. Six ISSR primers were used to detect genetic variability among eight Indian cultivars of M. oleifera, and it was found to be the most suitable marker as compared to RAPD and cytochrome P450 based markers, and the results showed a 48.57 % polymorphism rate (Saini et al., 2013). Similarly, the genetic variability of 97 accessions of M. oleifera from India was assessed using 15 ISSR markers, which amplified 100 bands, showing 59.6 % polymorphism (Rajalakshmi et al., 2019).
Within the population, greater genetic variation than that observed in the AMOVA analysis in our study was found −86 % and 95 % of the variation (Ganesan et al., 2014; Rajalakshmi et al., 2019). Since moringa is a cross-pollinated plant, it was expected that most of the variation would be found within the population (Leone et al., 2015). Moreover, different factors may affect the genetic variability in moringa populations, such as aleatory mating patterns, genetic drifts caused by changes in allelic frequency, spontaneous mutation, and migration events of alleles within the population (Lakshmidevamma et al., 2021).
The Shannon index infers genetic diversity, ranging from zero to one, in which more diversity is found in values close to 1 (Perry and McIntosh, 1991). Our study's average Shannon index was 0.16, indicating low genetic diversity. Another indicator of genetic diversity was the He which varied from 0.03 to 0.17 (mean of 0.11), indicating low variability in the 177 moringa genotypes. Natural populations typically have He values exceeding zero due to the incorporation of new alleles by crossing (Silva et al., 2014). Similarly, low genetic diversity in 45 accessions of moringa from Colombia was found, in which values of He ranged from 0.13 to 0.29 (Chaves-Bedoya et al., 2017). The authors reported that the genotypes from Colombia were probably from a single or a small number of populations.
The opposite was observed when evaluating genetic materials from India where more genetic diversity is found since it is the center of origin (Muluvi et al., 1999). A high level of genetic diversity was found when evaluating seven advanced breeding lines from different locations in India (Kumar et al., 2017). Higher genetic diversity was observed for genotypes from India and Myanmar (He 0.36 to 0.76) using microsatellite markers (Wu et al., 2010). Nineteen SSR primers were used to assess genetic diversity among 300 genotypes from 12 populations from northern (Himachal Pradesh) and southern (Tamil Nadu) India (Ganesan et al., 2014).
They also found high genetic diversity in the Indian collection, reinforcing the idea that moringa originated in northern India and progressively established itself in the south, where it became more diverse. Another study using genotypes of natural populations from India, Malawi and Kenya showed that Nei's average values ranged from 0.040 (Kenya) and 0.122 (Indian population), and the highest level of genetic diversity was found in Indian populations (Muluvi et al., 1999).
The Bayesian analysis provided by the Structure software program is a well-established tool used to obtain information about the population structure using bands of molecular markers (Pritchard et al., 2000). In our study, Bayesian analysis was also a valuable grouping method for categorizing moringa genotypes, making it possible to identify which genotypes are considered an admixture by establishing a threshold score (Figure 2). Even though Moringa Genebank accessions were divided into two groups and most of the accession from the University of Florida were allocated in Group I, some of them (M11, M12, M13, M14, M15, M16, M17, and M18) share similarities with accessions collected in Brazil, which belongs to Group II. Similar observations were obtained from the PCoA plot that together with structure data and cluster dendrogram can provide a more reliable outlook from the results (Figure 5).
A possible explanation for the lack of correlation between genetic variability and geographic origin is the center of origin of moringa. The majority of genetic studies on moringa are carried out in Asia, more specifically in India, its center of origin (Muluvi et al., 1999; Saini et al., 2013; Ganesan et al., 2014; Kumar et al., 2017; Ravi et al., 2020). In addition, studies with cultivated and natural accessions that quantify the genetic diversity of moringa across the world are considered meagre, although the conservation of genetic resources for this species by using germplasm banks is increasing (Boopathi et al., 2021).
The literature reports that moringa was introduced as an ornamental tree in the USA in 1915, more specifically in southern Florida, with seeds from Cuba and Nicaragua. The Director of the Educational Concerns of Hunger Organization (ECHO) has shown interest in moringa due to its adaptability. He has distributed seeds to other countries, such as Haiti and Brazil. In Brazil, the author reported a seed shipment to the Maranhão state, which resulted in the planting of 25,000 trees (Morton, 1991).
In Pakistan, they evaluated genetic diversity in 131 accessions from a wild population and 30 accessions obtained from ECHO (Florida), which were from nine different countries: Haiti, Mexico, Belize, USA (Florida), Zimbabwe, Mozambique, Tanzania, Senegal, and India. Interestingly, although there was high genetic diversity in the Pakistani wild collection, low genetic diversity was found in the accessions obtained from ECHO (Shahzad et al., 2013). Consequently, the authors suggest that those accessions are probably from the same population or a few populations since moringa was introduced from India to different countries by traders or immigrants and ECHO received seeds from these farmers. It has been reported that the low genetic diversity in introduced populations may be due to the use of related accessions when they were introduced into a new location. In addition, high selection factors can be operating to reduce the genetic diversity in these populations (Muluvi et al., 1999). Our findings also agree with this same pattern; that is to say, the collection of accessions was probably collected from the same or a few populations, which would explain the low genetic diversity observed.
Our study observed a discrepancy in genetic diversity between the Moringa Genebank in Brazil and the species’ center of origin, indicating a low representation of moringa natural diversity. Therefore, actions to expand the bank are required to cover the species’ wide diversity and provide genetic material for crop improvement in future plant breeding programs to develop local varieties, which include exchanges of genetic material between other germplasm banks, especially in regions of high diversity such as India.
The ISSR markers were effective in assessing genetic variability in M. oleifera. Overall, the 25 accessions of Moringa Genebank were distributed over two large groups. However, it was not possible to group them geographically. In addition, low genetic diversity was found between the accessions. The information obtained from this study can be used in management actions of the Moringa Genebank to improve genetic resources, such as the introduction of new genotypes. The goal is to ensure conservation strategies for this species and encourage future breeding programs. We suggest future studies using high throughput genotyping molecular markers to discriminate the germplasm and the morphological characterization of this collection.
Data availability statement
The data that support the findings of this study are available on request from the corresponding author.
Acknowledgments
This study was financed by the Coordenação de Aperfeiçoamento de Pessoal de Nível Superior (CAPES) - Finance Code 001. We also acknowledge the assistance of Silvio Gomes dos Santos, a Technician at Embrapa Tabuleiros Costeiros, who helped with the laboratory analysis.
References
-
Avila-Treviño JA, Muñoz-Alemán JM, Pérez-Molphe-Balch E, Rodríguez-Sahagún A, Morales-Domínguez JF. 2017. In vitro propagation from bud and apex explants of Moringa oleifera and evaluation of the genetic stability with RAMP marker. South African Journal of Botany 108: 149-156. https://doi.org/10.1016/j.sajb.2016.10.003
» https://doi.org/10.1016/j.sajb.2016.10.003 -
Bancessi A, Bancessi Q, Baldé A, Catarino L. 2020. Present and potential uses of Moringa oleifera as a multipurpose plant in Guinea-Bissau. South African Journal of Botany 129: 206-208. https://doi.org/10.1016/j.sajb.2019.06.013
» https://doi.org/10.1016/j.sajb.2019.06.013 - Boopathi NM, Raveendran M, Kole C. 2021. The Moringa Genome. Springer, Cham, Switzerland.
-
Chaves-Bedoya G, Galvis-Pérez ZL, Ortiz-Rojas LY. 2017. Genetic diversity of Moringa oleifera Lam. in the northeast of Colombia using RAMs markers. Revista Colombiana de Ciências Hortícolas 11: 408-415. https://doi.org/10.17584/rcch.2017v11i2.7343
» https://doi.org/10.17584/rcch.2017v11i2.7343 - Doyle JJ, Doyle JL. 1990. Isolation of plant DNA from fresh tissue. Focus 12: 13-15.
-
Evanno G, Regnaut S, Goudet, J. 2005. Detecting the number of clusters of individuals using the software STRUCTURE: a simulation study. Molecular Ecology 14: 2611-2620. https://doi.org/10.1111/j.1365-294X.2005.02553.x
» https://doi.org/10.1111/j.1365-294X.2005.02553.x -
Farooq B, Koul B. 2020. Comparative analysis of the antioxidant, antibacterial and plant growth promoting potential of five Indian varieties of Moringa oleifera L. South African Journal of Botany 129: 47-55. https://doi.org/10.1016/j.sajb.2018.12.014
» https://doi.org/10.1016/j.sajb.2018.12.014 -
Ganesan SK, Singh R, Choudhury DR, Bharadwaj J, Gupta V, Singode A. 2014. Genetic diversity and population structure study of drumstick (Moringa oleifera Lam.) using morphological and SSR markers. Industrial Crops and Products 60: 316-325. https://doi.org/10.1016/j.indcrop.2014.06.033
» https://doi.org/10.1016/j.indcrop.2014.06.033 -
Hassan FAS, Ismail IA, Mazrou R, Hassan M. 2020. Applicability of inter-simple sequence repeat (ISSR), start codon targeted (SCoT) markers and ITS2 gene sequencing for genetic diversity assessment in Moringa oleifera Lam. Journal of Applied Research on Medicinal and Aromatics Plants 18: 100256. https://doi.org/10.1016/j.jarmap.2020.100256
» https://doi.org/10.1016/j.jarmap.2020.100256 -
Hassanein AMA. 2018. Nutritional, chemical and molecular characterisation of Moringa oleifera Lam. and Moringa peregrina (Forssk) Fiori genotypes. Journal of Horticultural Science and Biotechnology 93: 500-509. https://doi.org/10.1080/14620316.2017.1399834
» https://doi.org/10.1080/14620316.2017.1399834 -
Kamvar, ZN, Tabima, JF, Grünwald, NJ. 2014. Poppr: an R package for genetic analysis of populations with clonal, partially clonal, and/or sexual reproduction. PeerJ 2: e281. https://doi.org/10.7717/peerj.281
» https://doi.org/10.7717/peerj.281 -
Kumar P, Dolkar R, Manjunatha G, Pallavi HM. 2017. Molecular fingerprinting and assessment of genetic variations among advanced breeding lines of Moringa oleifera L. by using seed protein, RAPD and Cytochrome P450 based markers. South African Journal of Botany 111: 60-67. https://doi.org/10.1016/j.sajb.2017.03.024
» https://doi.org/10.1016/j.sajb.2017.03.024 - Lakshmidevamma TN, Ugalat J, Apoorva KA, Suresh SPG, Doddamani M, Kadam S, et al. 2021. Genetic diversity of moringa (Moringa oleifera Lam.). p. 57-66. In: Boopathi NM, Raveendran M, Kole C. eds. The Moringa Genome: Compendium of Plant Genomes. Springer, Cham, Switzerland.
-
Leone A, Spada A, Battezzati A, Schirald A, Aristil J, Bertoli S. 2015. Cultivation, genetic, ethnopharmacology, phytochemistry and pharmacology of Moringa oleifera leaves: an overview. International Journal of Molecular Sciences 16: 12791-12835. https://doi.org/10.3390/ijms160612791
» https://doi.org/10.3390/ijms160612791 -
Milla PG, Peñalver R, Nieto G. 2021. Health benefits of uses and applications of Moringa oleifera in bakery products. Plants 10: 318. https://doi.org/10.3390/plants10020318
» https://doi.org/10.3390/plants10020318 -
Morton JF. 1991. The horseradish tree, Moringa pterygosperma (Moringaceae): a boon to Arid Lands? Economic Botany 45: 318-333. https://doi.org/10.1007/BF02887070
» https://doi.org/10.1007/BF02887070 -
Muluvi GM, Sprent JI, Soranzo N, Provan J, Odee D, Folkard G, et al. 1999. Amplified fragment length polymorphism (AFLP) analysis of genetic variation in Moringa oleifera Lam. Molecular Ecology 8: 463-470. https://doi.org/10.1046/j.1365-294X.1999.00589.x
» https://doi.org/10.1046/j.1365-294X.1999.00589.x -
Nair KR, Satish D, Jagadeesha RC, Basavraj N, Raghavendra S, Awatti M, et al. 2021. Genetic dissection of variability using morphological traits in Drumstick (Moringa oleifera Lam.) genotypes. Indian Journal Pure & Applied Biosciences 9: 442-449. http://doi.org/10.18782/2582-2845.8584
» http://doi.org/10.18782/2582-2845.8584 -
Nei M. 1973. Analysis of gene diversity in subdivided populations. Proceedings of the National Academy of Sciences of the United States of America. 70: 3321-3323. https://doi.org/10.1073/pnas.70.12.3321
» https://doi.org/10.1073/pnas.70.12.3321 -
Pandey A, Pradheep K, Gupta R, Nayar ER, Bhandari DC. 2011. "Drumstick tree" (Moringa oleifera Lam.): a multipurpose potential species in India. Genetic Resources and Crop Evolution 58: 453-460. https://doi.org/10.1007/s10722-010-9629-6
» https://doi.org/10.1007/s10722-010-9629-6 -
Peakall R, Smouse PE. 2012. GenAlEx 6.5: genetic analysis in Excel. Population genetic software for teaching and research – an update. Bioinformatics 28: 2537-2539. https://doi.org/10.1093/bioinformatics/bts460
» https://doi.org/10.1093/bioinformatics/bts460 -
Perry MC, McIntosh MS. 1991. Geographical patterns of variation in the USDA soybean germplasm collection: I. morphological traits. Crop Science 31: 1350-1355 https://doi.org/10.2135/cropsci1991.0011183X003100050054x
» https://doi.org/10.2135/cropsci1991.0011183X003100050054x -
Pritchard JK, Stephens M, Donnelly P. 2000. Inference of population structure using multilocus genotype data. Genetics 155: 945-959. https://doi.org/10.1093/genetics/155.2.945
» https://doi.org/10.1093/genetics/155.2.945 -
Rajalakshmi R, Rajalakshmi S, Parida A. 2019. Genetic diversity, population structure and correlation study in Moringa oleifera Lam. using ISSR and SRAP markers. Proceedings of the National Academy of Sciences, India Section B: Biological Sciences 89: 1361-1371. https://doi.org/10.1007/s40011-018-1059-9
» https://doi.org/10.1007/s40011-018-1059-9 -
Ravi RSD, Siril EA, Nair BR. 2020. The efficiency of cytochrome P450 gene-based markers in accessing genetic variability of drumstick (Moringa oleifera Lam.) accessions. Molecular Biology Reports 47: 2929-2939. https://doi.org/10.1007/s11033-020-05391-w
» https://doi.org/10.1007/s11033-020-05391-w -
Rivas R, Oliveira MT, Santos MG. 2013. Three cycles of water deficit from seed to young plants of Moringa oleifera woody species improves stress tolerance. Plant Physiology and Biochemistry 63: 200-208. https://doi.org/10.1016/j.plaphy.2012.11.026
» https://doi.org/10.1016/j.plaphy.2012.11.026 - Rogers JS. 1972. Measures of genetic similarity and genetic distance. p. 145-153. In: Studies in Genetics VII. University of Texas Publication 7213, Austin, TX, USA.
-
Saini RK, Saad KR, Ravishankar GA, Giridhar P, Shetty NP. 2013. Genetic diversity of commercially grown Moringa oleifera Lam. cultivars from India by RAPD, ISSR and cytochrome P450-based markers. Plant Systematics and Evolution 299: 1205-1213. https://doi.org/10.1007/s00606-013-0789-7
» https://doi.org/10.1007/s00606-013-0789-7 -
Shahzad U, Khan MA, Jaskani MJ, Khan IA, Korban SS. 2013. Genetic diversity and population structure of Moringa oleifera Conservation Genetics 14: 1161-1172. https://doi.org/10.1007/s10592-013-0503-x
» https://doi.org/10.1007/s10592-013-0503-x - Silva AVC, Santos ARF, Ledo AS, Feitosa RB, Almeida CS, Silva GM, et al. 2012. Moringa genetic diversity from germplasm bank using RAPD markers. Tropical and Subtropical Agroecosystems 15: 31-39
-
Silva AVC, Freire KCS, Ledo AS, Rabbani ARC. 2014. Diversity and genetic structure of jenipapo (Genipa americana L.) Brazilian accessions. Scientia Agricola 71: 387-393. https://doi.org/10.1590/0103-9016-2014-0038
» https://doi.org/10.1590/0103-9016-2014-0038 -
Singh AK, Rana HK, Tshabalala T, Kumar R, Gupta A, Ndhlala AR, et al. 2020. Phytochemical, nutraceutical and pharmacological attributes of a functional crop Moringa oleifera Lam: an overview. South African Journal of Botany 129: 209-220. https://doi.org/10.1016/j.sajb.2019.06.017
» https://doi.org/10.1016/j.sajb.2019.06.017 -
Wu JC, Yang J, Gu ZJ, Zhang YP. 2010. Isolation and characterization of twenty polymorphic microsatellite loci for Moringa oleifera (Moringaceae). HortScience 45: 690-692. https://doi.org/10.21273/HORTSCI.45.4.690
» https://doi.org/10.21273/HORTSCI.45.4.690
Edited by
-
Edited by:
Feng Lin