
 Feasibility of Using Drones for Monitoring Soybean Crops: A Comparative Study in Jataí-GO
Abstract
Technological advancements have reduced geographical barriers, demanding rapid adaptation across all sectors, including the use of remotely piloted aircraft (RPAs), commonly known as drones, which have been widely applied in areas such as urban and agricultural monitoring. In municipalities like Jataí-GO, where agribusiness is predominant, the use of RPAs for measuring vegetative indices (VIs) brings benefits for more precise and sustainable agricultural practices. However, the cost of some RPAs limits their broader adoption, as many devices can exceed R$ 160,000 (Brazilian currency). This research is experimental and aimed to develop techniques for using rotary-wing drones, which are more affordable than other models available on the market, to generate vegetation indices for mapping and monitoring commercial grain crops. The methodology consisted of: 1) field surveys in soybean planting areas; 2) acquisition of images from the Sentinel-2 satellite and the drone; 3) processing of images captured by the Phantom 4 PRO drone, equipped with a MAPIR Survey 3W camera; and 4) analysis of correlations between the VIs obtained by the drone and Sentinel-2 in two areas on the campus of the Federal University of Jataí (UFJ), for validation. Data collection included the use of a high-precision Trimble R4s GNSS for georeferencing. The results show a strong correlation between the VIs calculated using drone and Sentinel-2 images for soybean crops, with coefficients of determination (R²) exceeding 0.72 for VARI and 0.73 for NDVI. Plot 001 stood out for its uniformity, achieving high coefficients of determination, reinforcing the effectiveness of the geotechnologies employed. In more heterogeneous areas, such as plot 002, the VIs revealed differences, particularly with the VARI index, which proved less efficient for mixed cultivation environments. The data confirms that VIs generated by cost-effective drones can indicate planting variations, demonstrating the feasibility of their application in the agricultural sector without significant investments.
Keywords:
Aerial Photogrammetry; Geotechnologies; MAPIR; Vegetation Indices
Resumo
Os avanços tecnológicos têm diminuído as barreiras geográficas, demandando uma rápida adaptação de todos os setores, incluindo o uso de aeronaves remotamente pilotadas (RPA’s), conhecidas como drones, que têm sido aplicadas amplamente em áreas como o monitoramento urbano e agrícola. Em municípios como Jataí-GO, onde o agronegócio é predominante, o uso de RPA’s para mensuração de índices vegetativos (IV’s) traz ganhos para práticas agrícolas mais precisas e sustentáveis. Contudo, o custo de alguns RPA’s limita seu uso mais amplo, pois muitos equipamentos chegam a ultrapassar R$ 160.000. A pesquisa tem caráter experimental e objetivou desenvolver técnicas para o uso de drones de asa rotativa, com valor de mercado mais acessível do que os demais modelos existentes no mercado, na geração de índices de vegetação para o mapeamento e monitoramento de cultivos comerciais de grãos. A metodologia consistiu em: 1) levantamento de campo em áreas de plantio de soja; 2) aquisição de imagens do satélite Sentinel-2 e do drone; 3) processamento das imagens captadas pelo drone Phantom 4 PRO, equipado com uma câmera MAPIR Survey 3W; e 4) análise de correlações entre os IV’s obtidos por drone e pelo Sentinel-2 em duas áreas no campus da Universidade Federal de Jataí (UFJ), para validação. A coleta de dados incluiu o uso de GNSS de alta precisão Trimble R4s para georreferenciamento. Os resultados mostram boa correlação entre os IV’s calculados com imagens do drone e do Sentinel2 na cultura da soja, com coeficientes de determinação (R²) superiores a 0,72 para o VARI e 0,73 para o NDVI. O talhão 001 destacou-se pela uniformidade, obtendo altos coeficientes de determinação, reforçando a eficácia das geotecnologias empregadas. Em áreas mais heterogêneas, como no talhão 002, os IV’s revelaram diferenças, especialmente com o índice VARI, que se mostrou menos eficiente para ambientes de cultivo misto. Os dados confirmam que os IV’s gerados por drones de custo acessível podem indicar variações de plantio, comprovando a viabilidade de sua aplicação no setor agrícola sem investimentos expressivos.
Palavras-chave:
Aerofotogrametria; Geotecnologias; MAPIR; Índices de Vegetação
INTRODUCTION
The rapid evolution of technologies, especially after the Cold War, has reduced distances and demanded adaptations across various sectors. About geotechnologies, this evolution has brought significant gains in efficiency and quality in geographic studies. According to Rosa (2009), geotechnologies encompass a set of technologies focused on the collection, processing, analysis, and dissemination of information with geographic reference.
These technologies stand out in monitoring urban and agricultural areas, being used in practices such as precision agriculture, pest control, and the management of production and harvesting processes. These advancements have contributed to popularizing aerial photogrammetry, facilitated by access to high-resolution satellite images and field surveys (Matias et al., 2015). Among these technologies, drones have emerged as one of the primary tools.
The flexibility and versatility of drones have expanded the possibilities for applications in geographic studies, enabling efficient and precise data capture in various environmental and urban contexts. These devices offer a new perspective for spatial data collection, allowing detailed and up-to-date analyses of hard-to-reach or large-scale areas (Alzahrani et al., 2020).
Images captured by cameras mounted on drones enable the analysis of relationships between different spectral bands, facilitating the calculation of vegetation indices. These indices are essential for assessing the health and vigor of plants in a specific area (Silva Júnior et al., 2018). In this research, indices such as the Visible Atmospherically Resistant Index (VARI), the Normalized Difference Vegetation Index (NDVI), and the Leaf Area Index (LAI) were tested and utilized, as they are recommended for analyses in agricultural activities (Schwalbert et al., 2020; Andrade Júnior et al., 2022).
One of the main challenges in using drones for surveys is the cost of equipment, such as fixed-wing drones, which can exceed R$ 150,000.00 (Brazilian currency). Thus, the use of more affordable drones and sensors is crucial to making this technology viable for mapping and monitoring agricultural areas.
The availability of more economical drones and sensors broadens the possibilities for applying these tools, especially in agriculture. This accessibility allows the generation of vegetation indices and other essential data for agricultural management more economically and efficiently. Thus, farmers and land managers can make more informed and precise decisions, promoting more sustainable and effective use of agricultural areas.
This research aims to evaluate the effectiveness of cost-effective technologies, such as the Phantom 4 PRO drone and the MAPIR Survey 3W multispectral camera, in monitoring soybean crops in the Jataí-GO region. For this purpose, vegetation indices extracted from both drone-captured images and Sentinel-2 satellite images are compared using statistical models, such as the coefficient of determination (R²), to verify the correlation and accuracy of the applied technologies. Here, the choice of Sentinel-2 as a reference for validation is justified by the free access to medium spatial resolution images and a temporal resolution of 5 days, making it the most viable option among the low-cost alternatives targeted by the research.
This issue is fundamental for assessing the potential and feasibility of using drones and geotechnologies in agriculture, especially in regions like Jataí-GO, where agricultural production is significant. Investigating this issue can provide valuable results for farmers, researchers, and managers, contributing to the advancement of knowledge and the improvement of agricultural practices in the pursuit of greater profitability and sustainability.
MATERIALS AND METHODS
Characterization of the Study Area
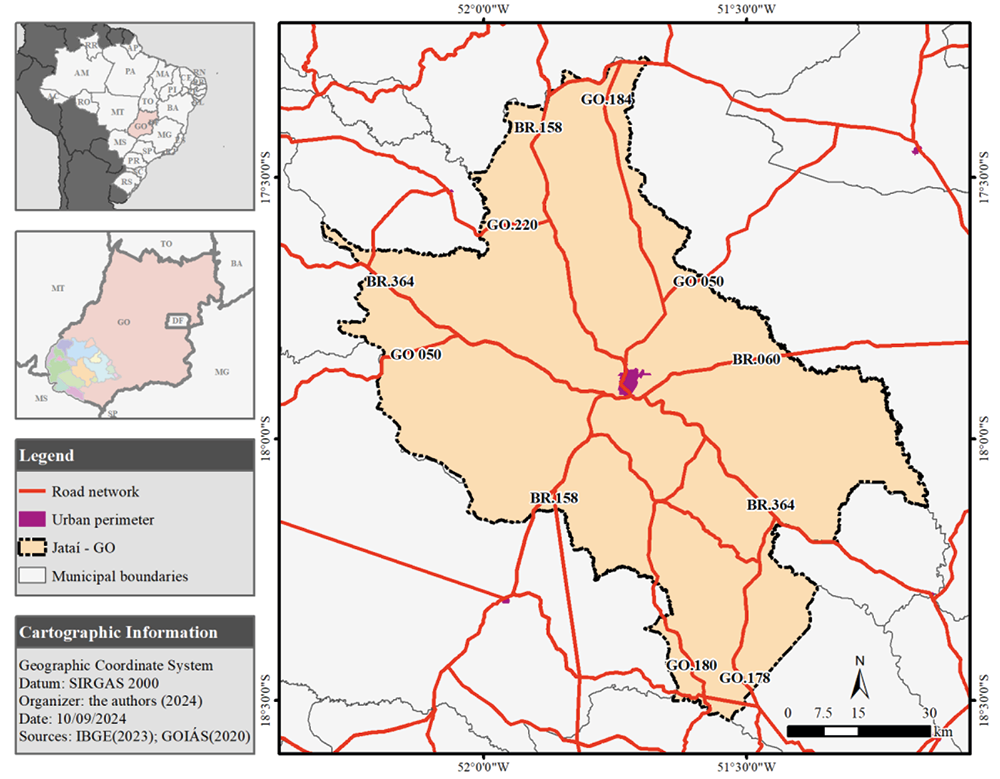
The southwestern region of Goiás is one of the most productive areas in the state and the country in terms of agriculture and livestock. The combination of favorable climate, fertile soil, and advanced technologies has enabled robust agricultural development. The municipality of Jataí-GO (Figure 1) stands out in this region for its significant grain production and its role as a center for agricultural innovation. The intensive use of land has been crucial for increasing productivity in the region, as highlighted by Martins et al. (2022).

The Universidade Federal de Jataí (UFJ - Federal University of Jataí) is located in a rural area (Jatobá campus), where research is carried out in the agronomy program on experimental grain cultivation areas. Therefore, two soybean plots were selected for monitoring, named "plot 001" and "plot 002," measuring 7.42 hectares and 8.77 hectares, respectively.
Equipment Used
A Phantom 4 PRO-DJI drone was used, equipped with an infrared imaging kit and NDVI generation capabilities, along with an integrated Mapir Survey 3w GPS (Figure 2). Acquired through funding from the Universal Call MCTIC/CNPq No. 28/2018, the drone enables high-resolution aerial photos for photogrammetry, with sensors ensuring flight stability and smartphone-based monitoring.

The NDVI camera is essential for agricultural monitoring, being one of the most precise indices for capturing the spectral signature of vegetation. The Mapir Survey 3w sensor captures high-resolution images (12 Megapixels - 4000 x 3000 px) in RAW (12 bits per channel) and JPG (8 bits per channel) formats, generating a Ground Sample Distance (GSD) of 5.5 cm/px at 120 m altitude. This model, identified as OCN (Orange, Cyan, and NIR), uses specific filters: cyan (490 nm), orange (615 nm), and near-infrared (808 nm), enabling detailed analysis of agricultural crop conditions. Additionally, it features an integrated external GNSS (Mapir, 2020; Santos et al., 2022).
Execution of Flights and Data Processing
Aerial surveys were conducted weekly to monitor soybean development across different phenological stages. According to the classification by Fehr and Caviness (1977), the soybean cycle is divided into two main phases: vegetative stages (V), representing the initial growth of the plant, and reproductive stages (R), marking the transition to flowering and grain formation.
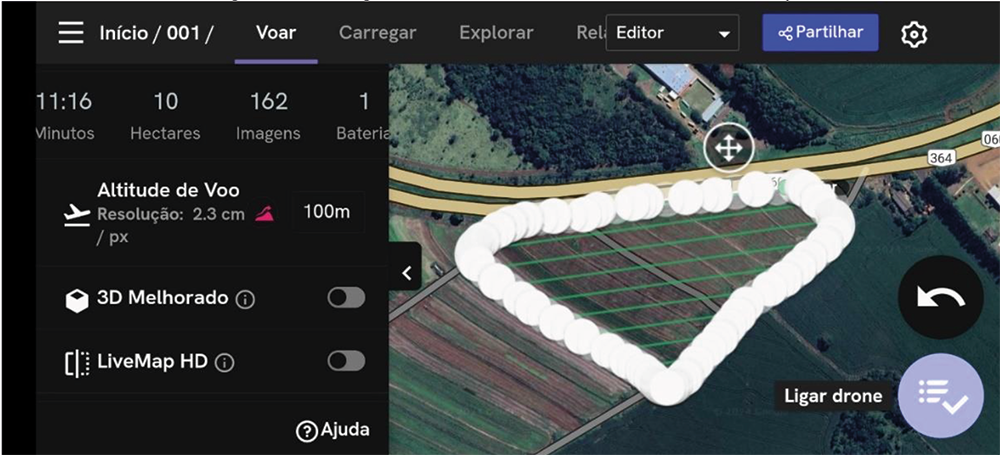
For the flights, the free application DroneDeploy was used, enabling planned and automated flights for capturing aerial photographs. The flights were conducted at an altitude of 100 m, with 75% lateral and frontal overlap (Figure 3), always between 9:00 AM and 11:00 AM to avoid significant variation in solar angle, and with the camera positioned at 90°. RGB images were generated in natural color, without contrast adjustment. An initial flight was conducted for georeferencing the plots, using the high-precision Trimble R4s GNSS to collect control points. This flight took place before the crop season, with the soil exposed, facilitating the visibility of control points. Twenty control points were collected around and within the plots.

The points collected by the GNSS were processed in Trimble Pathfinder Office® software, with differential correction, and exported in .shp and .txt formats. The reference for post-processing was the Jataí station (GOJA) from the Rede Brasileira de Monitoramento Contínuo (RBMC - Brazilian Continuous Monitoring Network).
The aerial photos were processed in Agisoft Metashape® software, version 2.1.0, (Agisoft, 2023), following photogrammetry steps: image alignment, dense point cloud generation, digital terrain model creation, and orthophoto mosaic generation. The first flight's images were georeferenced using the control points collected in the field and processed with differential correction, along with coordinates captured by the drone's navigation system. This controlled orthomosaic served as a reference for correcting subsequent orthomosaics, including RGB and multispectral images.
The correction of subsequent orthomosaics was performed using the georeferencing tool in ArcGIS 10.8, version 10.7.0.10450, (ESRI, 2024), using fixed points such as poles and sewer networks to ensure image positioning accuracy (Figure 4).

Sentinel-2 satellite images, distributed free of charge by the European Union's space program, were used as an additional reference. The selected bands were blue (B2), green (B3), red (B4), and near-infrared (B8), with a spatial resolution of 10 meters and a search criterion considering 0% cloud cover over the plots.
These images were processed using SNAP software, provided by the European Space Agency (ESA), where vegetation indices (VARI, NDVI, and LAI) and color compositions of the satellite images were generated. The indices generated by the drone were calculated using the raster calculator tool, applying the formulas for VARI, NDVI, and LAI specified in Table 1. Subsequently, the data were processed in ArcGIS 10.8 for georeferencing, area calculation, information cross-referencing, and thematic map generation.
To ensure the consistency of the results when calculating LAI, a correction to the NDVI index was necessary, based on the additive property of equality. Since the MAPIR camera generates negative NDVI values during periods with lower leaf coverage, an adjustment was applied to ensure the values fell within a coherent scale. In this context, by adding the lowest recorded NDVI value to all pixels across all dates, the LAI calculation better reflected the conditions observed in the field. For example, without this correction, a pixel of a leaf could show an NDVI of -0.1, while a pixel of bare soil could show -0.2, resulting in a higher calculated LAI value for the bare soil, which does not align with reality. With this correction, the results obtained more accurately represent the variations in the studied areas.
Sampling and Statistical Analyses
A sampling criterion was established for each plot, selecting 9 pixels from Sentinel-2, resulting in parcels of 900 m². In plot 001, 45 parcels were analyzed, and in plot 002, 68 parcels were analyzed. The samples were selected to ensure they were entirely within the plots and contained all 9 complete Sentinel-2 pixels.
To extract the results, the zonal statistics as a table tool were used, which calculates an average for each sample based on the number of pixels within that area. This allowed the extraction of the mean values for each index from both drone-captured images and satellite images, enabling statistical analysis in Microsoft Excel,version 2504, (Microsoft Corporation, 2022).
A total of 60 flights were conducted. After excluding images with high cloud cover, the analyses focused on overflights conducted on the following dates: 11/04/2022, 11/05/2022, 11/17/2022, 11/25/2022, 01/11/2023, 01/20/2023, 02/03/2023, 02/15/2023, 11/21/2023, 01/16/2024, 02/09/2024, and 02/22/2024.
From the organized spreadsheet data, the Pearson linear correlation coefficient (R), the coefficient of determination (R²), and Willmot et al. (1985) D coefficient were calculated. According to Oliveira (2016), these coefficients have a performance scale ranging from poor to excellent, as follows: poor <0.40; bad 0.40 to 0.50; fair 0.50 to 0.60; moderate 0.60 to 0.65; good 0.65 to 0.70; very good 0.75 to 0.85; and excellent >0.85. Additionally, the root mean square error (RMSE) was calculated to assess the degree of similarity between the observations and the reference data (Oliveira, 2016).
RESULTS AND DISCUSSIONS
The results are presented for the soybean-cultivated plots during the 2022-23 and 2023-24 crop seasons. In the first season, planting occurred in October 2022, and harvesting in February 2023, while in the second season, planting took place in November 2023, with harvesting in March 2024.
As shown in Figure 5, the collected data indicate a high correlation between the VARI and NDVI indices obtained from the drone and the satellite data, with the coefficient of determination (R²) ranging between 0.724 and 0.905, with plot 001 standing out for better results. Plot 001 showed an R² of 0.891 for VARI and 0.905 for NDVI, while plot 002 exhibited greater variation between the crop seasons.
Greater dispersion was observed in the data from plot 002, especially for VARI. Although the R² indicates a good correlation, the data dispersion suggests variability in the response indices related to crop development, associated with factors such as soil heterogeneity.
The VARI index tends to fluctuate during the vegetative stage, especially when the plant develops pods, due to its dependence on the visible band. In contrast, NDVI, which uses the near-infrared band, remains more stable and shows a more precise correlation with satellite images, better reflecting the cellular structure of the plants. This behavior of the indices is evident throughout the planting cycle.
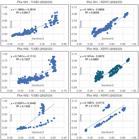
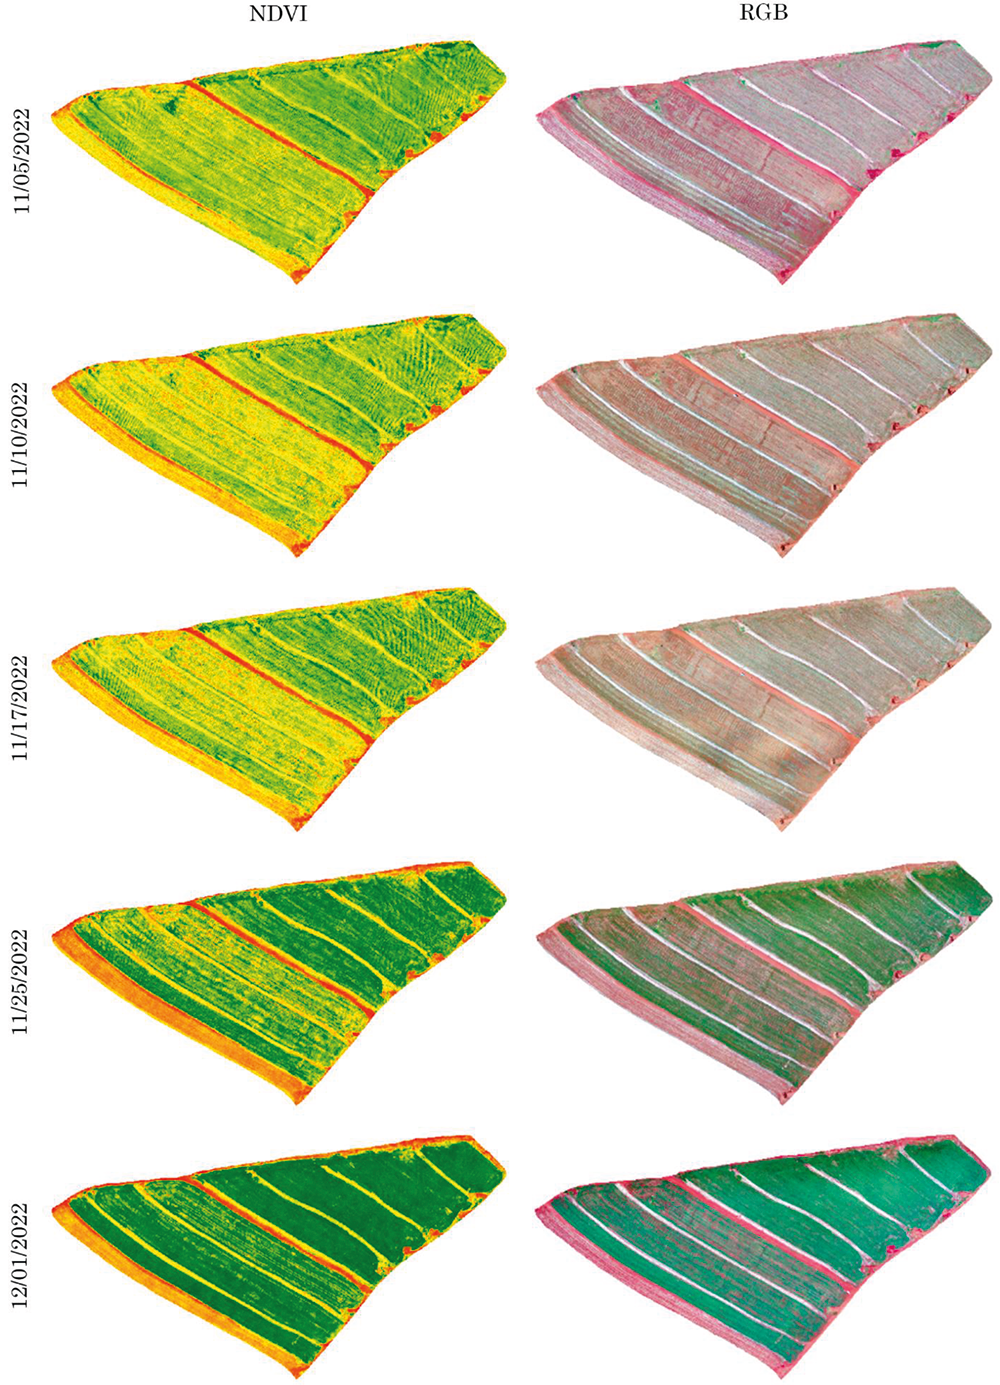
In plot 001, the NDVI and LAI indices showed relatively lower performance on 11/05/2022 and 01/11/2023, with R² values between 0.70 and 0.73. This lower performance at the beginning of the cycle is attributed to the low density of leaf coverage, which intensifies the spectral influence of straw and exposed soil (Figure 6).
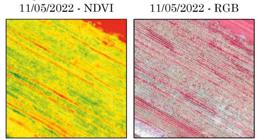
The NDVI and LAI, measured by the MAPIR camera, recorded values of -0.019 and 0.416, respectively, while Sentinel-2 showed average values of 0.269 and 0.275, reinforcing the influence of bare soil. Despite recording NDVI values below the satellite references, the MAPIR camera allows for the identification of areas of plant stress and land use with high resolution, as noted by Santos et al. (2022) and Koopmans (2020).
On 01/11/2023, the reduced NDVI and LAI values are attributed to a four-day difference between the drone-captured image and the satellite image, which was replaced by the image from 01/15/2023 due to cloud cover. On 11/17/2022, 11/25/2022, 02/03/2023, and 02/15/2023, comparisons with only a one-day difference showed high R² values for NDVI and LAI, reaching up to 0.93 (both plots).
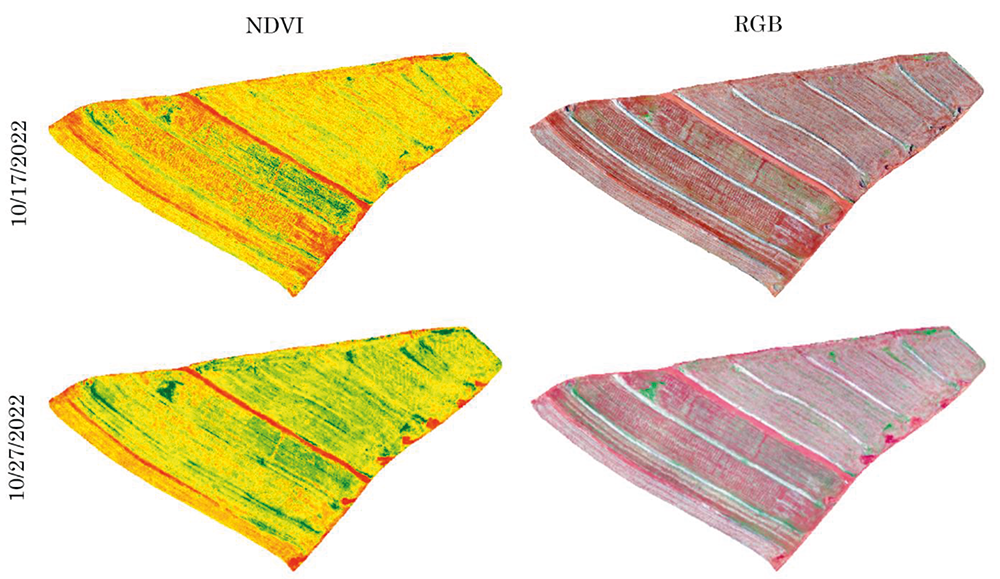
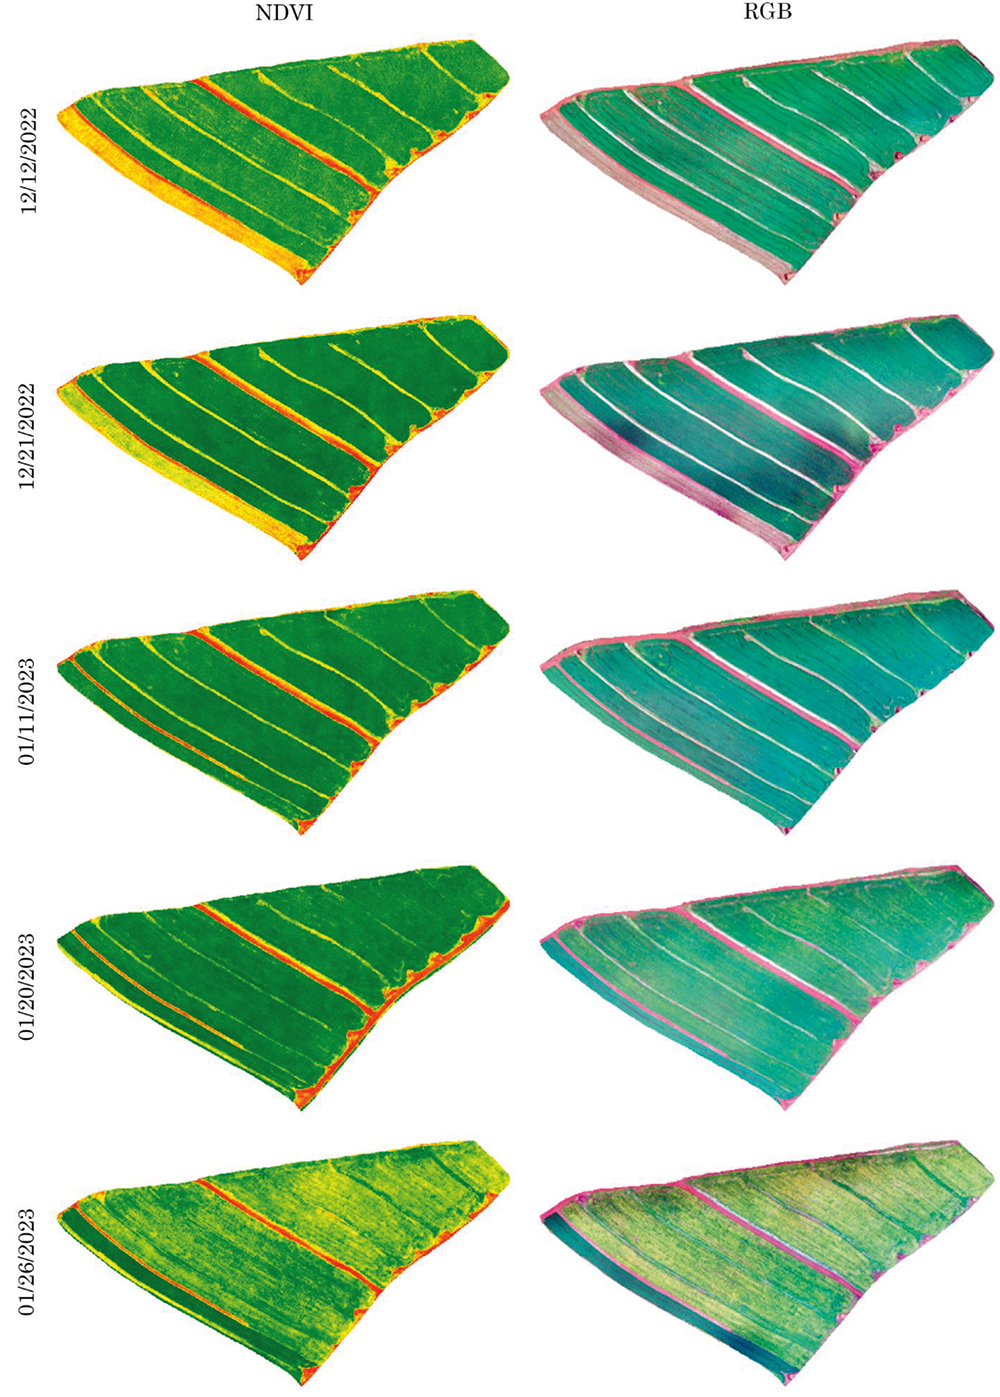
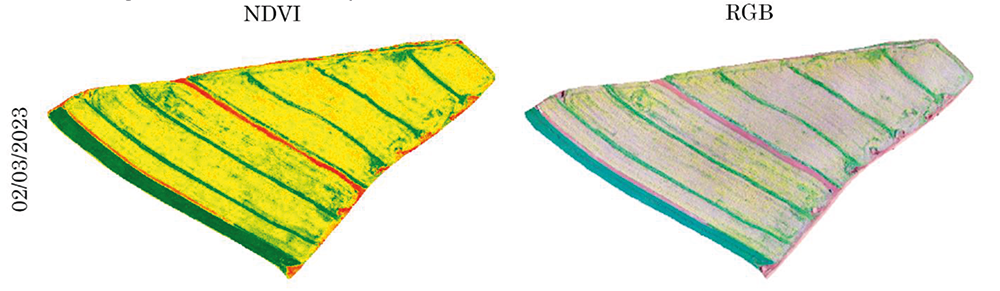
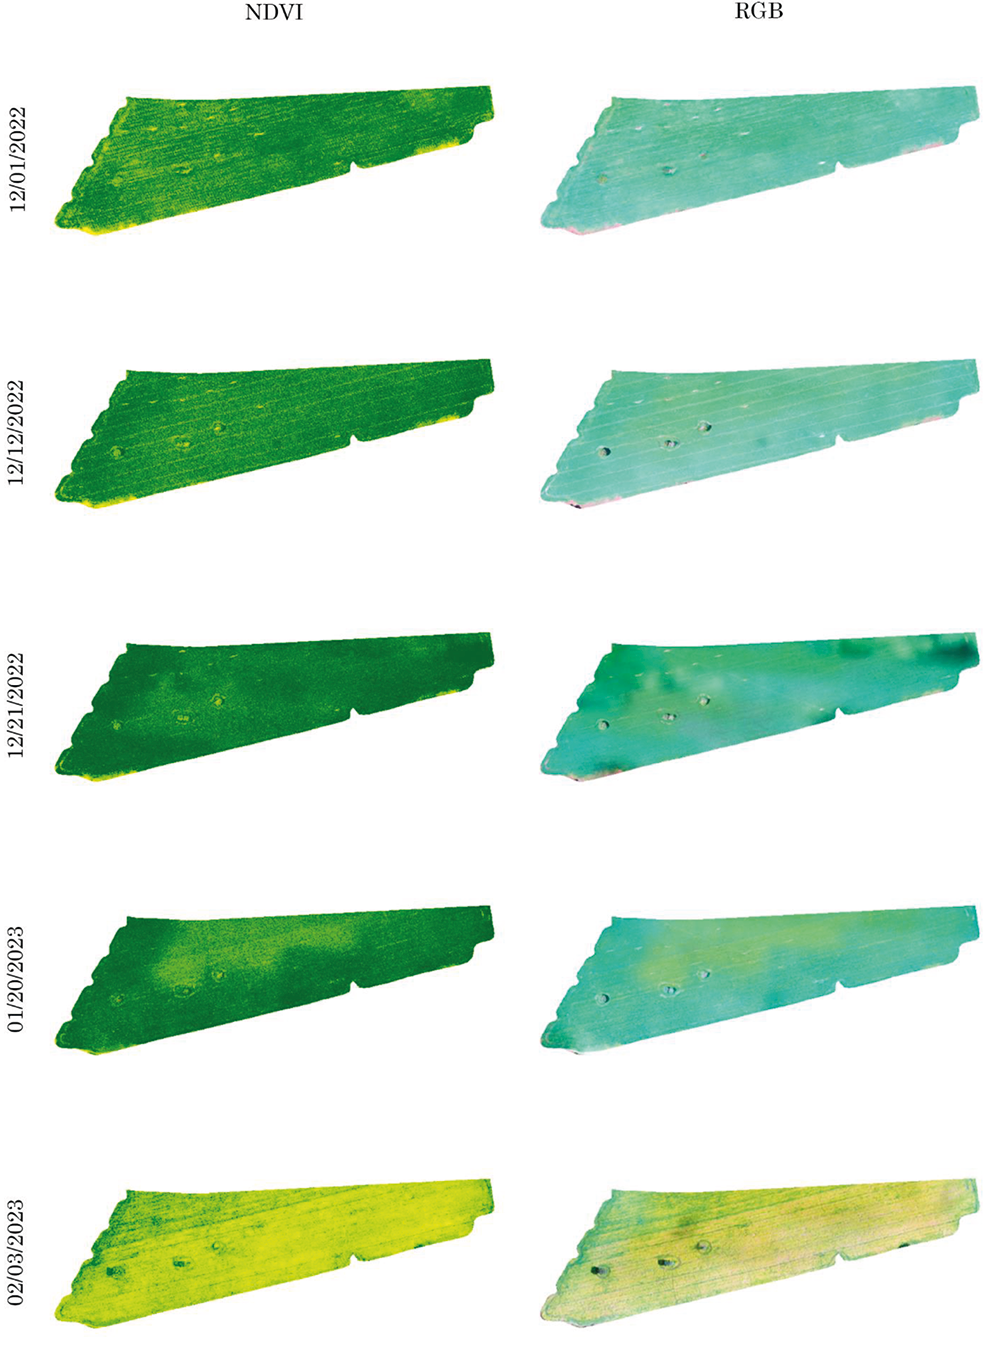
Although between 11/25/2022 and 01/11/2023 it was not possible to obtain cloud-free satellite images, the soybean development stages are clearly identifiable in the aerial photographs. NDVI values increased significantly after 11/25/2022, peaking between 12/21/2022 and 01/11/2023, with averages of 0.079 and 0.060, respectively, from the MAPIR camera. NDVI and LAI values decreased from 01/26/2023 as the soybeans advanced to maturation and harvest stages, with NDVI and LAI recorded by MAPIR on 02/15/2023 showing values of -0.017 and 0.423, respectively. Figures 7, 8, 9, and 10 illustrate the spatial variation of NDVI throughout the soybean cultivation cycle, from planting to harvest.
The performance index D indicates excellent performance of the MAPIR camera for calculating NDVI and LAI in plot 001, with values above 0.88 for all dates except 11/05/2022, where LAI recorded 0.74 due to the presence of straw and bare soil. This good performance is corroborated by RMSE values between 0.04 and 0.12, reflecting the precise fit of the model.

Thematic image demonstrating spatial variation of NDVI and drone-captured RGB images in plot 001 with soybean cultivation for the 2022/23 season, between 10/17/2022 and 10/27/2022

Thematic image demonstrating spatial variation of NDVI and drone-captured RGB images in plot 001 with soybean cultivation for the 2022/23 season, between 11/05/2022 and 12/01/2022

Thematic image demonstrating spatial variation of NDVI and drone-captured RGB images in plot 001 with soybean cultivation for the 2022/23 season, between 12/12/2022 and 01/26/2023

Thematic image demonstrating spatial variation of NDVI and drone-captured RGB images in plot 001 with soybean cultivation for the 2022/23 season, on 02/03/2023
During the initial growth stages (11/05, 11/17, and 11/25/2022), the VARI index showed satisfactory performance, with coefficients of determination of 0.65 and 0.60 for the first two dates and 0.80 for the third, demonstrating average values for the drone of -0.026, -0.042, and 0.160, respectively, while Sentinel-2 showed values of -0.289, -0.285, and -0.064.
On 01/11/2023 and 02/03/2023, as the soybeans progressed through the vegetative cycle and entered the senescence phase, the VARI from the MAPIR camera recorded averages of 0.773 and 0.049, while Sentinel-2 obtained 0.398 and -0.093. This confirms an increase in the index on 01/11 and a reduction on 02/03, coinciding with the grain drying process.
The difference between the drone and Sentinel-2 VARI values emphasizes that the drone's lower altitude (100 m) minimizes atmospheric interference, resulting in more precise data, while Sentinel-2, operating in medium orbit, is more susceptible to atmospheric variations.
Despite variations in the VARI R², the D and RMSE indices showed high accuracy for most dates, with D above 0.81 and RMSE between 0.01 and 0.04, except on 01/11/2023, when D was 0.49. This result highlights that the OCN camera, with infrared capture, is more suitable for observing these aspects.
Figures 11, 12, and 13 demonstrate the spatial variation of VARI for plot 001 in the 2022/23 season. Although VARI shows slightly lower statistical indices than NDVI, its high spatial resolution allows for detailed visual analysis, identifying soybean development stages throughout the cycle.
In plot 002, during the 2022/23 season, the NDVI and LAI indices maintained strong and stable correlation values. However, on 11/04/2022 and 01/20/2023, these indices showed lower performance, with R² between 0.50 and 0.60, reflecting the initial planting stages and the presence of bare soil (Figure 14), as in plot 001. The average NDVI and LAI values captured by the drone were -0.010 and 0.281, while the satellite images recorded 0.349 and 0.396.
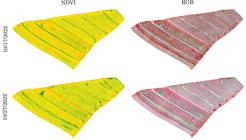
Thematic image demonstrating spatial variation of VARI and drone-captured RGB images in plot 001 with soybean cultivation for the 2022/23 season, on 10/17/2022 and 10/27/2022
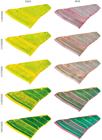
Thematic image demonstrating spatial variation of VARI and drone-captured RGB images in plot 001 with soybean cultivation for the 2022/23 season, between 11/05/2022 and 12/01/2022
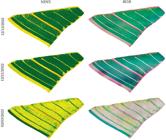
Thematic image demonstrating spatial variation of VARI and drone-captured RGB images in plot 001 with soybean cultivation for the 2022/23 season, between 12/12/2022 and 02/03/2023
The days with the highest R² values (11/17/2022, 11/25/2022, and 02/03/2023) showed images with a maximum difference of 2 days between the aerial photographs and the Sentinel-2 images, with excellent performance: R² = 0.78 (NDVI) and 0.77 (LAI) on 11/17/2022, R² = 0.91 (NDVI) and 0.90 (LAI) on 11/25/2022, and R² = 0.94 (NDVI and LAI) on 02/03/2023.
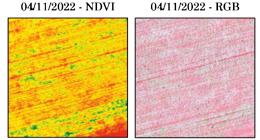
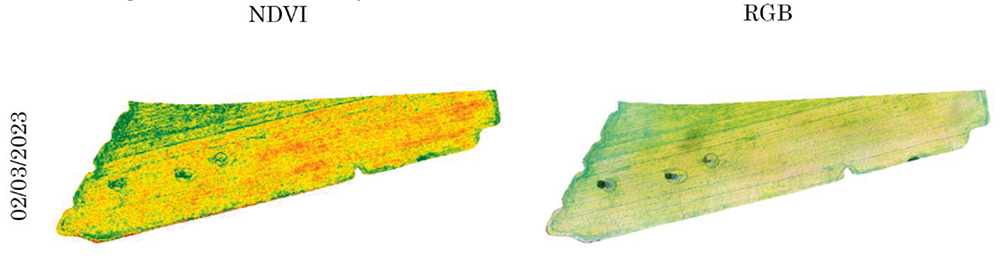
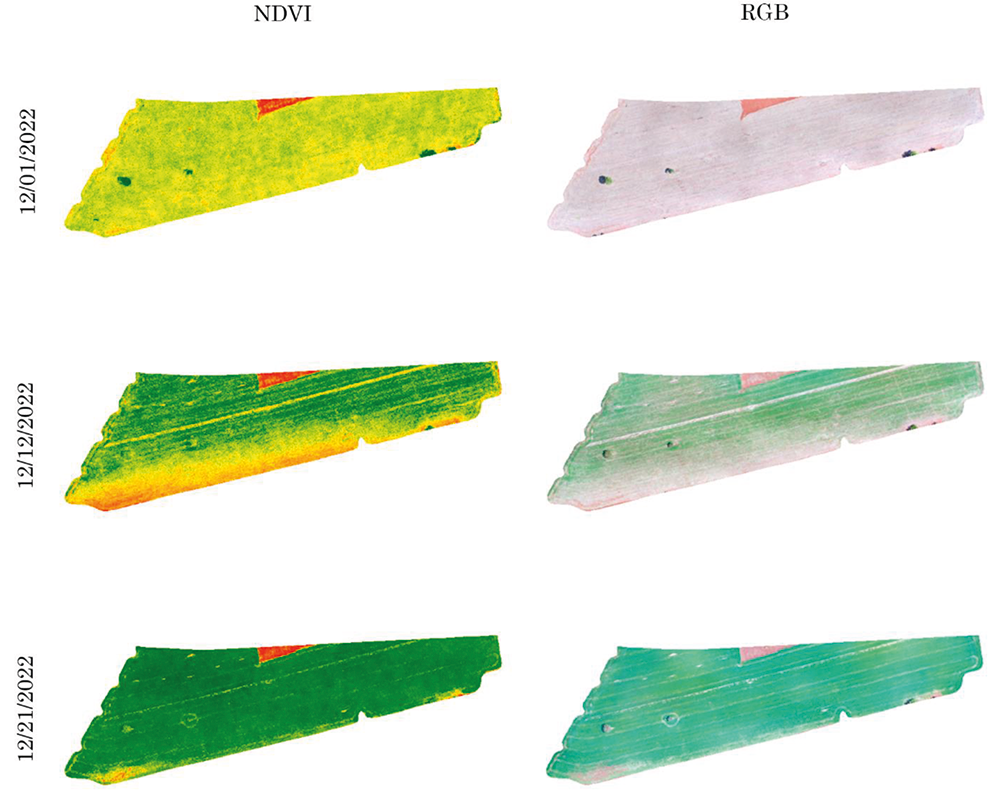
As in plot 001, it is possible to identify the soybean stages in plot 002 through the images. The lowest NDVI values occurred at the beginning of planting, on 11/04/2022, 11/10/2022, and 11/17/2022, with average values of -0.010, -0.035, and -0.026, respectively. On 11/04/2022 (Figure 15), in addition to straw and bare soil, weed patches were observed, with higher values compared to 11/10/2022 and 11/17/2022, when herbicide had already been applied for desiccation.

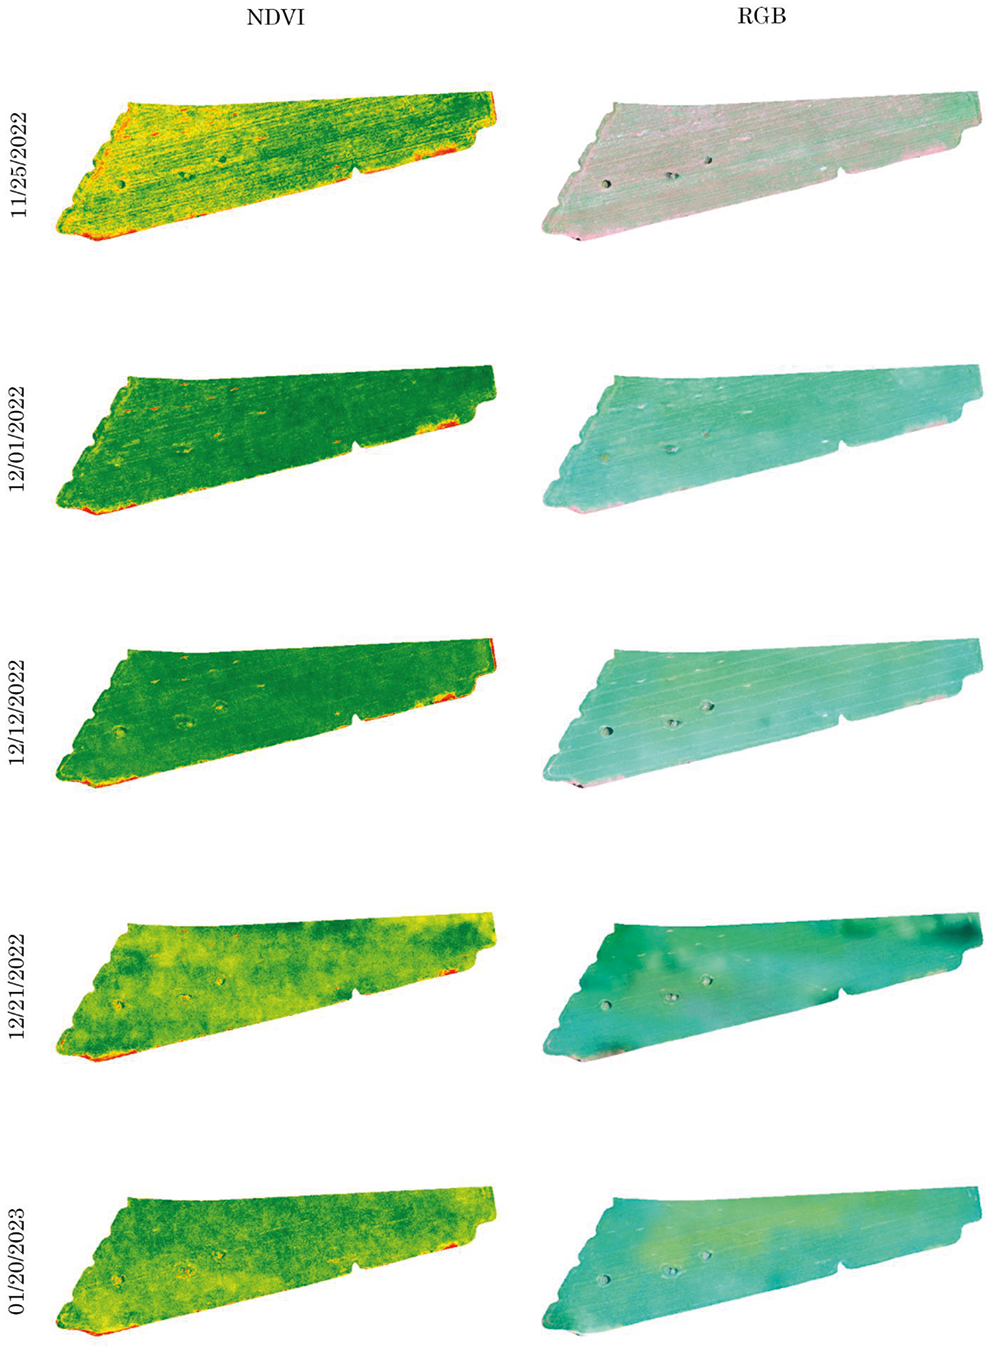
On 12/21/2022 and 01/20/2023, NDVI and LAI reached their highest values, indicating greater vegetation coverage. The averages were 0.090 and 0.086 for NDVI, and 0.434 and 0.427 for LAI, respectively. These values were slightly lower than those in plot 001 for the same stage, suggesting potentially lower productivity for this area. During the maturation phase, on 02/03/2023, the vegetation indices began to decrease, with averages of 0.009 for NDVI and 0.307 for LAI. This confirms that the indices can be used to monitor soybean cultivation stages. Figures 16, 17, and 18 illustrate the spatial variation of the NDVI index in plot 002 throughout the cultivation cycle.

Thematic image demonstrating spatial variation of NDVI and drone-captured RGB images in plot 002 with soybean cultivation for the 2022/23 season, between 11/04/2022 and 11/17/2022

Thematic image demonstrating spatial variation of NDVI and drone-captured RGB images in plot 002 with soybean cultivation for the 2022/23 season, between 11/25/2022 and 01/20/2023

Thematic image demonstrating spatial variation of NDVI and drone-captured RGB images in plot 002 with soybean cultivation for the 2022/23 season, on 02/03/2023
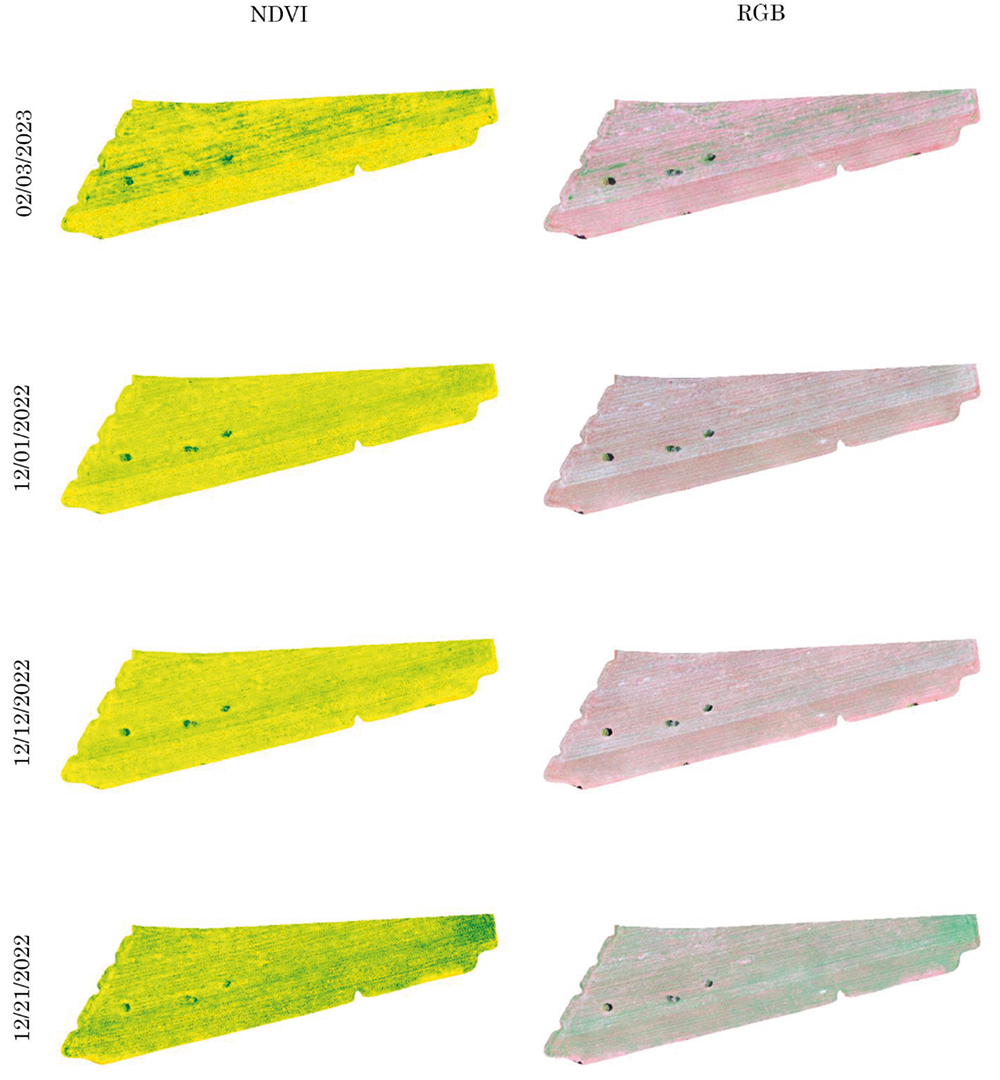
The D and RMSE indices demonstrated excellent performance of the MAPIR camera for calculating NDVI and LAI in plot 002, with the D index always above 0.88 and RMSE between 0.05 and 0.10, confirming the good fit of the model, similar to the results in plot 001. However, VARI did not show good performance indices in plot 002, with low values on 11/04/2022, 11/17/2022, 11/25/2022, and 01/20/2023, except for 02/03/2023, which showed R² = 0.75, demonstrating good performance. On 01/20/2023, the performance was the lowest, with a drop in VARI captured by the drone (0.412) compared to previous stages, while Sentinel-2 recorded an increase (0.512), which may have been influenced by the 5-day difference between the images. Although VARI showed unsatisfactory results, the D and RMSE indices remained excellent, as in plot 001. Figures 19 and 20 present the spatial variation of VARI in plot 002 during the 2022/23 season. Based on these results, we decided to conduct a second survey in the 2023/24 season to compare the two surveys.
Seven flights were conducted, but only on 4 dates was it possible to compare with satellite images. On 11/21/2023, due to the presence of straw and bare soil, the R² values were lower, with R² = 0.29 for NDVI and R² = 0.28 for LAI. The average NDVI value recorded by the MAPIR camera was -0.054, and LAI was 0.268. During this period, the construction of the UFJ technology park began, occupying a small area within the study zone, resulting in the exclusion of some samples. The number of samples decreased from 65 to 54.

Thematic image demonstrating spatial variation of VARI and drone-captured RGB Images in plot 002 with soybean cultivation for the 2022/23 season, between 11/04/2022 and 11/25/2022
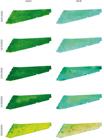
Thematic image demonstrating spatial variation of VARI and drone-captured RGB images in plot 002 with soybean cultivation for the 2022/23 season, between 12/01/2022 and 02/03/2023
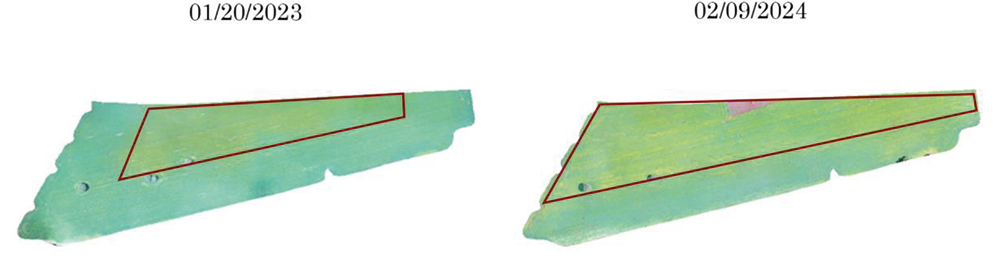
On 01/16/2024, during the grain-filling period, the average NDVI value recorded by the drone was 0.087, with an LAI of 0.495, while the satellite values were 0.535 for NDVI and 0.787 for LAI. The R² values were 0.66 for NDVI and 0.62 for LAI. Although the R² values are below 0.7, the D index was above 0.90 for both variables, indicating excellent performance of the multispectral camera compared to Sentinel-2 images. The next available image for analysis was recorded on 02/09/2024, during the maturation and early senescence phase. The average NDVI and LAI values captured by MAPIR were 0.071 and 0.465, respectively, while Sentinel-2 values were 0.501 and 0.703, slightly lower than the previous date. This indicated issues in plant development, possibly due to irregular rainfall or soil characteristics in the area, similar to what was observed in plot 002 during the 2022/23 season. Figure 21 shows, in the RGB composition, that plant development in the upper part of the plot differed from the lower part.

RGB Composition for 01/20/2023 and 02/09/2024, demonstrating development issues in plot 002
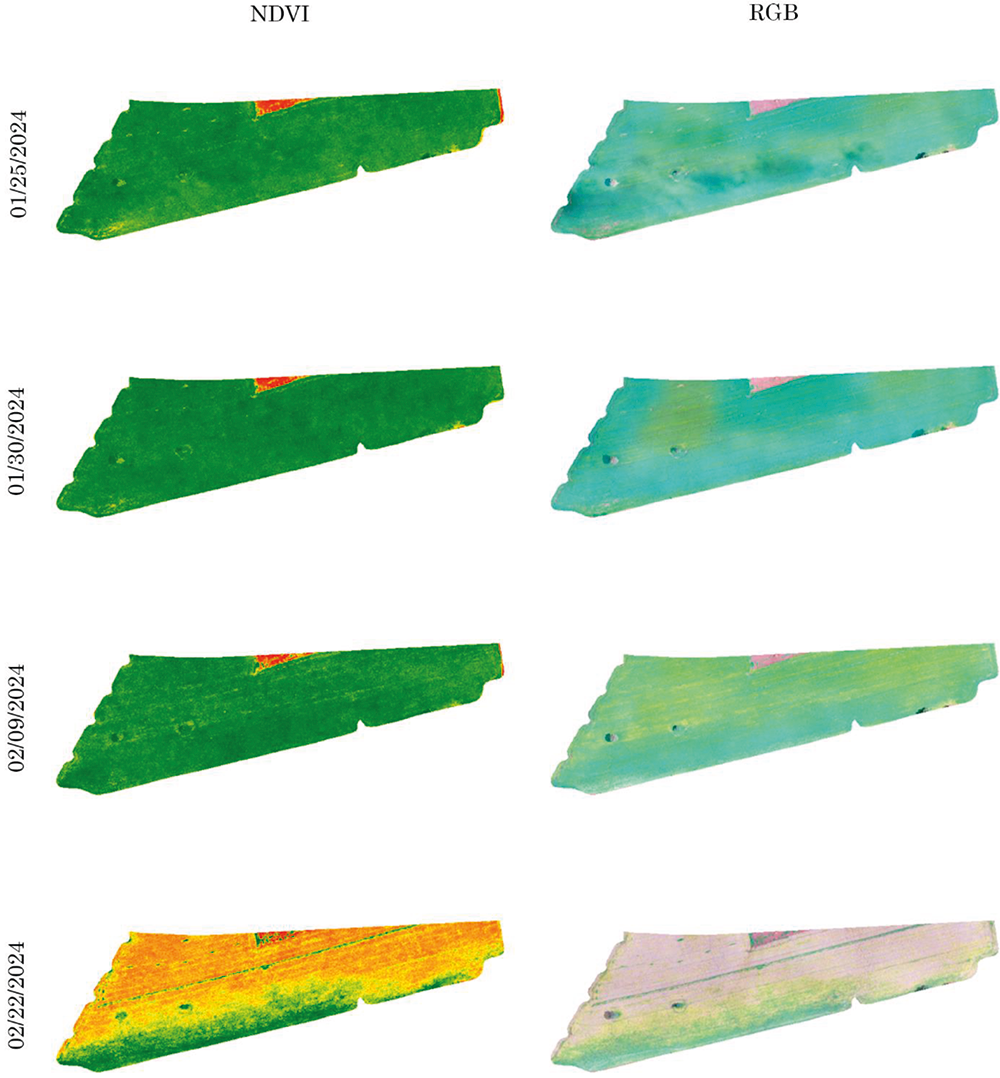
During the plant maturation phase, recorded in the flight on 02/22/2024, the plot already showed progressive yellowing of the leaves. The average NDVI and LAI values for the drone were -0.011 and 0.330, respectively, while for Sentinel-2 they were 0.423 and 0.330. These values indicate a reduction in the indices compared to the previous date, signaling that the grains were in the maturation phase and that harvest planning could begin. Figures 22 and 23 present the RGB images for these dates, along with the thematic image generated from the NDVI index.
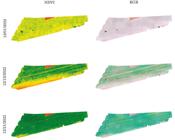
Thematic image demonstrating spatial variation of NDVI and drone-captured RGB images in plot 002 with soybean cultivation for the 2023/24 season, between 11/21/2023 and 01/16/2024
Thematic image demonstrating spatial variation of NDVI and drone-captured RGB images in plot 002 with soybean cultivation for the 2023/24 season, between 01/25/2024 and 02/22/2024
When comparing the correlations for plot 002 across the two analyzed crop seasons, it is observed that the NDVI and LAI indices calculated from drone images have a lower correlation compared to plot 001, which showed superior performance. This difference is explained by the lack of uniformity in plant development in plot 002, which affects the results. The satellite images, such as those from Sentinel-2, have a spatial resolution of 10 meters, making it difficult to capture detailed variations in plant development, especially in heterogeneous areas. In contrast, the drone offers more detailed resolution, making it better suited for such areas.
Additionally, on all dates, the D index was above 0.86, indicating excellent performance of the drone camera for calculating NDVI and LAI. The only exception was on 11/21/2023, when exposed soil and straw interfered with the LAI values. The good performance is further confirmed by RMSE values between 0.02 and 0.10, demonstrating an effective fit of the model for these variables.
FINAL CONSIDERATIONS
Agricultural monitoring geotechnologies, particularly using drones equipped with low-cost multispectral cameras, proved effective in analyzing soybean crops. The application of these tools enabled precise data collection on plant development, demonstrating the potential for analyses ranging from identifying planting gaps to monitoring crop growth cycles.
The results revealed a strong correlation between vegetation indices (VARI, NDVI, and LAI) calculated from imagery captured by the rotary-wing drone and free Sentinel-2 satellite images. For soybean crops, the overall coefficient of determination (R²) exceeded 0.72 for VARI and 0.73 for NDVI. Plot 001 stood out for its uniformity, with high R² values validating the efficacy of the geotechnologies employed. The study showed that NDVI exhibited greater robustness in advanced growth stages with denser vegetation, while VARI faced limitations in scenarios with higher crop diversity, particularly in Plot 002, where this diversity affected performance metrics.
The collected data validated vegetation indices and examined how variations in growing conditions and soil properties influenced results. The findings underscore the importance of implementing more sustainable and precise management strategies to help farmers make informed decisions.
The evidence presented in this research not only contributes to the discussion on drone efficacy in agriculture but also paves the way for future studies exploring the integration of diverse technologies and approaches. We suggest that the subsequent research should investigate the relationship between vegetation indices and soil characteristics, as well as the impact of pests and diseases on crops.
The relevance of this study reflects the transformative potential of geotechnologies in agricultural practices, enabling more efficient and sustainable management. The results aim to serve as a foundation for further research and to empower public agencies, recent graduate professionals, research laboratories, small businesses, and small-scale farmers to adopt these technologies as decision-support tools.
ACKNOWLEDGMENT
The first author thanks the Coordenação de Aperfeiçoamento de Pessoal de Nível Superior (CAPES) for the master's scholarship granted through process N. 23854.006647/2022-13. The second author thanks the Research Productivity Grant (PQ2) from CNPq through process N. 307438/2021-0.
References
- AGISOFT LLC. Agisoft Metashape® Agisoft, 2023. (licenciado para o segundo autor da pesquisa - Universidade Federal de Jataí - UFJ).
-
ALZAHRANI, B.; OUBBATI, O. S.; BARNAWI, A.; ATIQUZZAMAN, M.; ALGHAZZAWI, D. UAV assistance paradigm: State-of-the-art in applications and challenges. Journal of Network and Computer Applications, v. 166, 2020. https://doi.org/10.1016/j.jnca.2020.102706
» https://doi.org/10.1016/j.jnca.2020.102706 -
ANDRADE JÚNIOR, A. S. de; SILVA, S. P. da; SETÚBAL, I. S.; SOUZA, H. A. de; VIEIRA, P. F. M. J.; CASARI, R. A. C. N. Predicting soybean grain yield using aerial drone images. Revista Brasileira de Engenharia Agrícola e Ambiental, v. 26, n.6, p.466-476, 2022. https://doi.org/10.1590/1807-1929/agriambi.v25n1p3-9
» https://doi.org/10.1590/1807-1929/agriambi.v25n1p3-9 -
CARVALHO, G. A.; LEITE, D. V. B. Geoprocessamento na gestão urbana municipal a experiência dos municípios mineiros Sabará e Nova Lima. In: Simpósio Brasileiro de Sensoriamento Remoto, 14, 2009, Natal. Anais [...]. Natal: INPE, 2009, p. 3643-3650. Disponível em: http://marte.sid.inpe.br/col/dpi.inpe.br/sbsr@80/2008/11.14.21.52/doc/3643-3650.pdf Acesso em: 12 nov. 2024.
» http://marte.sid.inpe.br/col/dpi.inpe.br/sbsr@80/2008/11.14.21.52/doc/3643-3650.pdf -
DECEA - Departamento de Controle do Espaço Aéreo. Aeronaves não tripuladas e o acesso ao espaço aéreo brasileiro (ICA 100-40). Brasil, 2020. Disponível em: https://publicacoes.decea.mil.br/publicacao/ica-100-40 Acesso em: 12 nov. 2024.
» https://publicacoes.decea.mil.br/publicacao/ica-100-40 - ESRI - Environmental Systems Research Institute. ArcGIS PRO® ESRI, 2024. (licenciado para o segundo autor da pesquisa-Universidade Federal de Jataí-UFJ).
-
FEHR, W. R.; CAVINESS, C. E. Stages of soybean development. Ames: Iowa State University of Science and Technology, 1977. p.11 (Special report, 80). Disponível em: https://dr.lib.iastate.edu/handle/20.500.12876/90239 Acesso em: 18 nov. 2024.
» https://dr.lib.iastate.edu/handle/20.500.12876/90239 -
GITELSON, A. A.; VIÑA, A.; ARKEBAUER, T. J. Remoteestimation of leaf area index and green leaf biomass in maizecanopies. Geophysical Research Letters, v. 30, n. 5, p. 52, 2003. https://doi.org/10.1029/2002GL016450
» https://doi.org/10.1029/2002GL016450 -
GOIÁS. Secretaria de Estado de Gestão e Planejamento. Sistema Estadual de Geoinformação - SIEG. Camada de rodovias (BR’s). Goiânia: SEGPLAN, 2020. Disponível em: https://sieg.go.gov.br Acesso em: 08 out. 2024.
» https://sieg.go.gov.br -
IBGE. Instituto Brasileiro de Geografia e Estatística. Base territorial contínua do Brasil: municípios. Rio de Janeiro. IBGE, 2023. Disponível em: https://www.ibge.gov.br/geociencias/downloads-geociencias.html Acesso em: 08 out. 2024.
» https://www.ibge.gov.br/geociencias/downloads-geociencias.html -
KOOPMANS, M. Enhancement of geodata: The assessment of a near-infrared UAV sensor and a performance study of a low-cost dual-frequency GNSS receiver. FetureWater. 2020. Disponível em: https://www.futurewater.nl/wp-content/uploads/2020/12/Final_internship_report_Myke_Koopmans.pdf Acesso em: 12 nov. 2024.
» https://www.futurewater.nl/wp-content/uploads/2020/12/Final_internship_report_Myke_Koopmans.pdf -
MAPIR. How to Choose a Survey3 Camera Model. 2020. Disponível em: https://www.mapir.camera/pages/how-to-choose-a-survey3-camera-model Acesso em: 15 nov. 2024.
» https://www.mapir.camera/pages/how-to-choose-a-survey3-camera-model -
MARTINS, ALÉCIO PERINI; Morais, Wilker Alves; PÔSSA, ÉVELYN MÁRCIA; CASTRO, RAYSA MORAES; BORGES DE MOURA, DERICK MARTINS. USLE modelling of soil loss in a Brazilian cerrado catchment. Remote Sensing Applications: Society and Environment, v. 27, 2022. https://doi.org/10.1016/j.rsase.2022.100788
» https://doi.org/10.1016/j.rsase.2022.100788 -
MATIAS, G. R de M.; GUZATTO, M. P.; SILVEIRA, P. G. Mapeamento topográfico cadastral por integração de imagens adquiridas com VANT a técnicas tradicionais. 2015, 175f. Trabalho de Conclusão de Curso (Graduação em Engenharia Cartográfica), Universidade Federal do Rio Grande do Sul (UFRGS). Porto Alegre, 2015. Disponível em: https://lume.ufrgs.br/bitstream/handle/10183/115412/000963866.pdf?sequence=1&isAllowed=y Acesso em: 12 nov. 2024.
» https://lume.ufrgs.br/bitstream/handle/10183/115412/000963866.pdf?sequence=1&isAllowed=y - MICROSOFT CORPORATION. Microsoft Excel® Microsoft, 2022. (licenciado para o autor da pesquisa).
-
MIRANDA, R. Q.; NÓBREGA, R. L. B.; MOURA, M. S. B.; RAGHAVAN, S.; GALVÍNCIO, J. D. Realistic and simplified models of plant and leaf area indices for a seasonally dry tropical forest. International Journal of Applied Earth Observation and Geoinformation, v. 85, 2020. https://doi.org/10.1016/j.jag.2019.101992
» https://doi.org/10.1016/j.jag.2019.101992 -
OLIVEIRA, R. P. de. Apoio à Decisão na Adoção da Agricultura de Precisão: A Tecnologia da Informação em Apoio ao Conhecimento Agronômico. RECoDAF - Revista Eletrônica Competências Digitais para Agricultura Familiar, Tupã, v. 2, n.1, p.89-109, 2016. ISSN: 2448-0452. Disponível em: https://ainfo.cnptia.embrapa.br/digital/bitstream/item/153090/1/2016-131.pdf Acesso em: 12 nov. 2024.
» https://ainfo.cnptia.embrapa.br/digital/bitstream/item/153090/1/2016-131.pdf -
ROSA, R. Introdução ao Sensoriamento Remoto. 7ª ed. Uberlândia: EDUFU, 2009. https://doi.org/10.14393/EDUFU-978-85-7078-219-9
» https://doi.org/10.14393/EDUFU-978-85-7078-219-9 -
ROUSE, J. W.; HAAS, R. H.; SCHELL, J. A.; DEERING, D. W. Monitoring Vegetation Systems in the Great Plains with ERTS. 1974. Third ERTS-1 Symposium NASA, NASA SP-351, Washington DC, p.309-317, 1974. Disponível em: https://ntrs.nasa.gov/api/citations/19740022614/downloads/19740022614.pdf Acesso em: 12 nov. 2024.
» https://ntrs.nasa.gov/api/citations/19740022614/downloads/19740022614.pdf -
SANTOS, C. V. B. dos; MOURA, M. S. B. de; CARVALHO, H. F. de S.; GALVÍNCIO, J. D.; MIRANDA, R. de Q.; NISHIWAKI, A. A. M.; MONTENEGRO, S. M. G. L. Avaliação do índice de área foliar e índice de área da planta em floresta seca utilizando modelos simplificados em imagens de alta resolução com o uso de VANT. Journal of Hyperspectral Remote Sensing, v.12, n.03, p.109-123, 2022. https://doi.org/10.29150/2237-2202.2022.254276
» https://doi.org/10.29150/2237-2202.2022.254276 -
SCHWALBERT, R. A.; AMADO, T.; CORASSA, G.; POTT, L. P.; PRASAD, P. V. V.; CIAMPITTI, I. A. Satellite-based soybean yield forecast: Integrating machine learning and weather data for improving crop yield prediction in southern Brazil. Agricultural and Forest Meteorology, v. 284, 2020. https://doi.org/10.1016/j.agrformet.2019.107886
» https://doi.org/10.1016/j.agrformet.2019.107886 -
SILVA JUNIOR, C. A.; NANNI, M. R.; SHAKIR, M.; TEODORO, P. E.; OLIVEIRA-JÚNIOR, J. F. de; CEZAR, E.; GOIS, G. de; LIMA, M.; WOJCIECHOWSKI, J. C.; SHIRATSUCHI, L. S. Soybean varieties discrimination using non-imaging hyperspectral sensor. Infrared Physics & Technology, v.89, p.338-350, 2018. https://doi.org/10.1016/j.infrared.2018.01.027
» https://doi.org/10.1016/j.infrared.2018.01.027 -
WILLMOT, C. J.; ACKLESON S. G.; DAVIS R. E.; FEDDEMA J. J.; KLINK K. M.; LEGATES D. R.; O’DONNELL J.; ROWE, C. M. Statistics for the Evaluation and Comparison of Models. Journal of geophysical research, v. 90, n. C5, p. 8995-9005, 1985. https://doi.org/10.1029/JC090iC05p08995
» https://doi.org/10.1029/JC090iC05p08995
-
FUNDING SOURCE
Process No. 23854.006647/2022-13, CAPES Graduate Scholarship Call. Master's scholarship granted to the first author. Title: Feasibility Study on the Use of Rotary-Wing Drones for Monitoring and Mapping Short-Cycle Crops in the Municipality of Jataí-GO. Process No. 307438/2021-0, CNPq Productivity Grant Call - 2021. Title: Aerial Photogrammetry Applied to the Mapping and Monitoring of Agricultural Experiments. Process No. 409915/2018-1, CNPq Universal Call - 2018. Title: Feasibility Study on the Use of Drones for Aerial Photogrammetric Surveys: Applications in Urban Planning, Land Regularization, and Agricultural and Environmental Monitoring.

 Source:
  Source: The authors (2024).
 Source: The authors (2024).
 Source: The authors (2024).
 Source: The authors (2024).
 Source: The authors (2024).
 Source: The authors (2024).
 Source: The authors (2024).
 Source: The authors (2024).
 Source: The authors (2024).
 Source: The authors (2024).
 Source: The authors (2024).
 Source: The authors (2024).
 Source: The authors (2024).
 Source: The authors (2024).
 Source: The authors (2024).
 Source: The authors (2024).
 Source: The authors (2024).
 Source: The authors (2024).
 Source: The authors (2024).
 Source: The authors (2024).
 Source: The authors (2024).
 Source: The authors (2024).