
 Predicting the Future of a Fragmented Landscape: Soybean and Tree Plantations Competing Expansions in Western Santa Catarina State, Brazil
Abstract
The Western Santa Catarina region underwent significant changes due to the 20th-century colonization, which led to landscape fragmentation and Atlantic Forest decline. The present study is an analysis of historical land-use change dynamics observed from 1985 to 2023, besides predicting future changes expected to happen up to 2050. It was done by using MapBiomas Collection 9 reclassified into 12 categories. Land use changes were modeled with TerrSet Land Change Modeler based on the Weighted Normalized Likelihood to model transition potentials; furthermore, the Markov chain approach was applied to model future scenarios. Model validation was performed through computing accuracy and agreement/disagreement statistics to compare a predicted map for 2023 data to a 2023 ground truth map, which proved highly accurate (0.936). Results recorded for the 2023-2050-time frame have shown that soybean areas are projected to increase by 38% and planted forests by 37.3%; therefore, they remain as key land use drivers. Native forest remnants will decline due to Mixed Ombrophilous Forest loss by 37.2% in addition to the 25% loss recorded from 1985 to 2023, and to increasing landscape fragmentation. The model accurately mapped the 2050 landscape and highlighted future regional challenges, according to which, soybeans and forest plantations will be the major change drivers in the region. This progress will have consequences for the remaining native forests. Result scopes are essential to help better understanding future impacts of land use change on ecosystems and communities and consequently, to lay the foundation for informed decision-making, as well as to guide conservation and landscape management.
Keywords:
Remote Sensing; Deforestation; Land-use and cover change; Mapbiomas; Land Change Modeler
INTRODUCTION
Land use change is the primary cause for biodiversity loss given the still observed high extinction rates (Cabernard et al., 2024). Land use changes create a complex challenge simultaneously affecting several sustainability aspects from ecosystem conservation to social equity and food security. These changes must be faced head on in order to address global sustainability challenges because they affect carbon balance, habitat loss, and food production (Winkler et al., 2021). The effects of land use changes on South American biomes are significant, given that non-Amazonian ecosystems (excluding Temperate Grasslands) recorded 45% forest loss from 2000 to 2012. The Atlantic Forest is the second most impacted biome; 81% (978,031 km²) of its original potential extent had already been lost by 2012 (Salazar et al., 2015).
Land use changes in Brazil are mostly driven by agricultural production fuel that stem from the global growing demand for corn, wheat and soybeans observed from 1976, onwards (Schlindwein et al., 2021). According to global studies, forests and grasslands showed conversion to 2.87 % and 2.02% croplands from 1992 to 2015, respectively (Tian et al., 2021). Araucaria Forests in Southern Brazil are part of the Atlantic Forest and one of the regions most affected by human pressure (Mazza et al., 2016).
According to “Sistema de Estimativas de Emissões e Remoções de Gases de Efeito Estufa” (Greenhouse Gas Emissions and Removals Estimation System), land use changes are the first greenhouse gas emission source in Brazil, followed by agriculture and livestock (SEEG, 2025). Meat, grains and timber production for export purposes are an important source of income for the country and for the Southern region. The agribusiness sector accounts for more than 25% of the state's Gross Domestic Product (GDP) (Catarinense, 2025). These industries’ expansion is closely linked to landscape changes caused by fields planted with eucalyptus, soybean and corn crops, as well as by swine and poultry farms. These businesses dominate a highly fragmented landscape responsible for relevant homogenization features.
Thus, it is essential to understand how such changes affect the landscape and how they may progressively evolve if the current patterns remain in place. This analysis can help with identifying critical ecosystem health factors, and land use changes’ social and economic impacts. Currently, Southern Brazil is Characterized by a dynamic and expanding economy that spans multiple sectors, although agriculture still plays a key role in it. The present study is a prospective and historical analysis of the Western Santa Catarina landscape, which is part of the Atlantic Forest biome and a landscape dominated by monocultures and growing small towns.
It is therefore essential to analyze how human activities have shaped landscapes over time, applying machine learning techniques to guide land management and support conservation strategies for environmental planning, sustainable resource management, and the protection of the Atlantic Forest. The present study focuses on two phenomena that dominate the region: the expansion of monocultures and the loss of the Mix Ombrophilous and Deciduous forest. The analysis prioritizes understanding how monocultures interact with forest loss, utilizing classification data from widely recognized and validated biome maps. The objective of this study is to address an existing information gap concerning the region, where research on large-scale future land-use changes has been limited, and to deliberate on its ramifications for territorial planning.
MATERIALS AND METHODS
Study Site
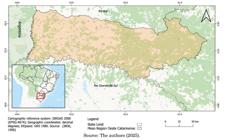
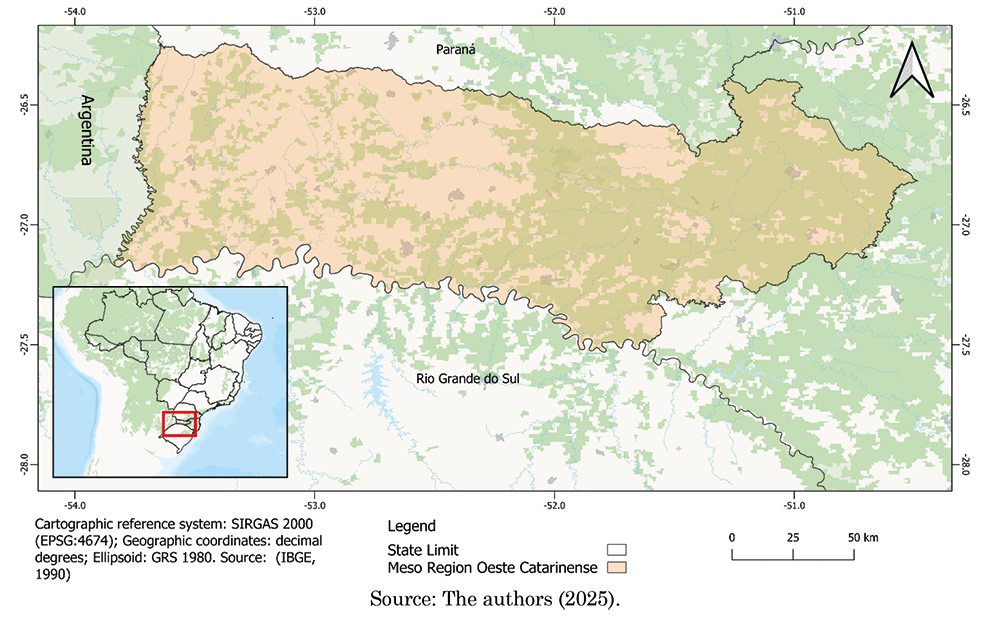
The Western Santa Catarina State mesoregion, which covers 27.314 km² in Southern Brazil, was the study site (Figure 1). It comprises 118 municipalities and has a population density of 79.5 inhabitants per square kilometer (IBGE, 2023b). This is a vital region for Santa Catarina agribusiness, which is the nation’s largest swine meat producer, since it accounts for 29.5% of the national output (16.9 million head), in addition to being a major poultry producer that contributes 13.4% (839 million head) of Brazil's total production. (Catarinense, 2025).
The modeling methodology followed a series of structured steps to ensure an understandable land use and land cover (LULC) dynamics analysis. The main stages were (1) data collection and transformation, (2) analysis of changes in Land Use Land Change (LULC) recorded from 1985 to 2023, (3) transition potential modeling, (4) LULC changes prediction, (5) model validation and (6) simulated time frame analysis (2023-2050).
Data Collection and Transformation
LULC Maps
The land use land cover (LULC) classification obtained at 1985, 1990, 1995, 2000, 2005, 2010, 2015, 2020 and 2023 from MapBiomas Collection 9 was used in the study (MapBiomas Project, 2024). The collected data comprised a set of classified rasters at 30-m resolution based on Landsat images provided by the U.S. Geological Survey (USGS). The MapBiomas collection has been used in several studies to assess land use changes in Brazil and their outcomes (Mataveli et al., 2022; Ribeiro et al., 2024; Vanin et al., 2024).
The MapBiomas dataset was reclassified into 12 classes that have been identified as of particular interest for the study. This reclassification took place after the initial 13 classes were? found in the region (Chart 1). The distinction for native forests followed the phytogeographic distribution in order to differentiate the Mixed Ombrophilous Forest (MOF) from the Seasonal Deciduous Forest (SDF) (Klein, 1978 updated by MonitoraSC, 2021).
Driving Factors
Additional data from multiple dataset sources, including Brazilian Agricultural Research Corporation (Embrapa, 2005) and Brazilian Institute of Geography and Statistics (IBGE, 2023a), were gathered to build the driving factors, which influence LULC changes. The main regionally varying drivers have had significant impact on many environmental aspects. Therefore, if drivers behind past changes continue, they may remain influential in the future (Leta et al., 2021).
Driver factors were divided into many categories (Chart 2); 19 were selected to highlight major land use change drivers based on previous studies (e.g.) (Girma et al., 2022; Mutale; Qiang, 2024; Zhang et al., 2024), as well as the regional work by Souza (2022). A transformation was carried out to help the modeling process applied for drivers holding a distance raster; a natural logarithm (ln) was adopted based on recommendations by the TerrSet team. No transformation was applied for the remaining predictors.
Some landscape metrics were computed to be included as predictive factors, given the high regional fragmentation and complexity. These metrics were generated in Habitat Biodiversity Modeler (HBM), in TerrSet, based on the Landscape Analysis module. Edge Density was calculated (see Chart 2) through 7 x 7 neighborhood to maximize the details. Furthermore, landscape-level change metrics were derived from 2000 and 2020 images in the "Landscape Change Process Analysis" module. Both outcomes worked as driver factors.
Building Modeling Constraints
All rivers classified as permanent or temporary were selected based on IBGE data. A buffer was applied to represent legally established protection zones as follows: 30 m buffer for rivers less than, or equal to, 10 m wide; 100 m buffer for rivers ranging from 50 to 200 m wide; and 500 m buffer for major rivers, at least 600 m wide. A minimum width buffer (100 m, at least) in rural areas was applied to areas surrounding the lakes (Brasil, 2012). Finally, the output was merged with protected areas; the resulting areas were ignored throughout the modeling process.
All datasets were turned into raster formats through geoprocessing approaches conducted in R software, version 4.5.0 (R Core Team, 2023), and in Terra (Hijmans, 2020). Standardized 30-m resolution raster was generated and projected for CRS at the WGS84 datum.
Analysis of Changes in Land Use Land Change (LULC) Recorded from 1985 to 2023
Land use and land cover (LULC) change analysis was conducted in the Land Change Modeler (LCM) module, in the TerrSet software. A historical change analysis was performed based on data from 1985 to 2023. This analysis demanded calculating net changes recorded for each land use class through Equation 1:
Data was plotted into a graph to compare the T1 (1986) to the T2 (2023) state in order to assess landscape dynamics and changes, as well as yearly change rates (Girma et al., 2022; Hassen; Assen, 2017; Leta et al., 2021).
Transition Potentials Modeling
The transition potentials tab accounted for organizing land-cover transitions into sub-models - each sub-model is linked to specific drivers or explanatory variables. A map was plotted for each transition to illustrate the time-specific potential for changes (Eastman, 2024). A criterion was formulated to identify transitions exceeding 40000 cells with a view to reduce the number of transitions to be modelled. The total of 53 transitions were identified.
Weighted Normalized Likelihood (WNL) was selected among the algorithms available to model transition potentials applied to land cover change by using an empirical approach based on normalized and weighted likelihoods (Eastman et al., 2019).
The 19 drivers were the variables adopted to feed the transition potential modeling (Table 2). The 150 bins at filter size 7 and 3 filter iterations were used. The number of bins sets the histogram classes (default 200 for quantitative variables). Filter size and iterations control the smoothing process to reduce overfitting; the 3-iterations 7-point filter forms a 19-point Gaussian filter. This approach allowed getting the transition potential results shown in Table 1.
LULC Change Prediction (LCM)
LCM uses two LULC maps, one for the initial year and one for the final year. Maps plotted for 2000 and 2020 were used for future predictions because, according to the historical change analysis carried out in previous stages, soybean and plantation areas rose sharply from these years onwards.
LCM uses a Markov chain model to set the chances of transitioning from one LULC type to another and creates a transition probability matrix by using earlier and later LULC maps and the date specified for the prediction, based on a future projection of transition potentials (Jalayer et al., 2022). It was first set for 2023 in order to validate predictions; later on, it was applied to 2050 to predict future land use changes. The transitional area matrix holds the number of pixels expected to change based on each LULC class over the specified time frame (Leta et al., 2021) (Table 2). LCM provides two change prediction types, namely: soft and hard. The hard prediction method is based on the multiobjective land allocation module (MOLA), and its result is plotted into a landcover map presenting the same categories as inputs (Eastman, 2024). Hard prediction was used to create LULC maps in the current study.
Constraints were herein set for all transitions. The number of recalculation steps was set to one transition; only water transitions were excluded. The prediction date was adjusted to 2050 based on the 2023 map validation. This process was reiterated to model the future land use map and the LULC analysis applied to the simulated time frame (2023-2050).
Model Validation
The 2023 MapBiomas raster worked as ground truth to validate the model through result comparisons. The CARET R package (Kuhn et al., 2024) was adopted to find metrics like Accuracy, Precision, Recall and F1 Score, which were calculated for each land cover class. Accuracy showed overall correctness, Precision indicated prediction reliability, Recall measured detection ability and F1 Score is the balanced combination of precision and recall. The TERRSET VALIDATE module assessed similarity between the model’s simulated map and the reference map based on Pontius’ methods (Pontius, 2000, 2002; Pontius; Suedmeyer, 2004) which quantify agreement and disagreement components. The validation procedure broke down the agreement and disagreement between the simulated map and the reference map into components, which allows the identification of different error types. The Agreement by Chance estimates the ratio of matches attributable to chances, whereas the Agreement in Quantity assesses whether the model properly reproduces the total amounts from each class, regardless of their location (Pontius; Millones, 2011). The Agreement at Gridcell Level measures the direct spatial agreement between pixels by identifying correct matches in the exact location. Disagreement at Gridcell Level reflects spatial location errors, and Disagreement in Quantity captures discrepancies in the amounts predicted for each class. Altogether, these metrics lead to an understandable spatial and thematic quality of the LULC model. This sort of validation method gives an idea of agreement or disagreement levels between projected and current LULC maps (Leta et al., 2021).
RESULTS AND DISCUSSION
1985-2023 Land Use Change Analysis
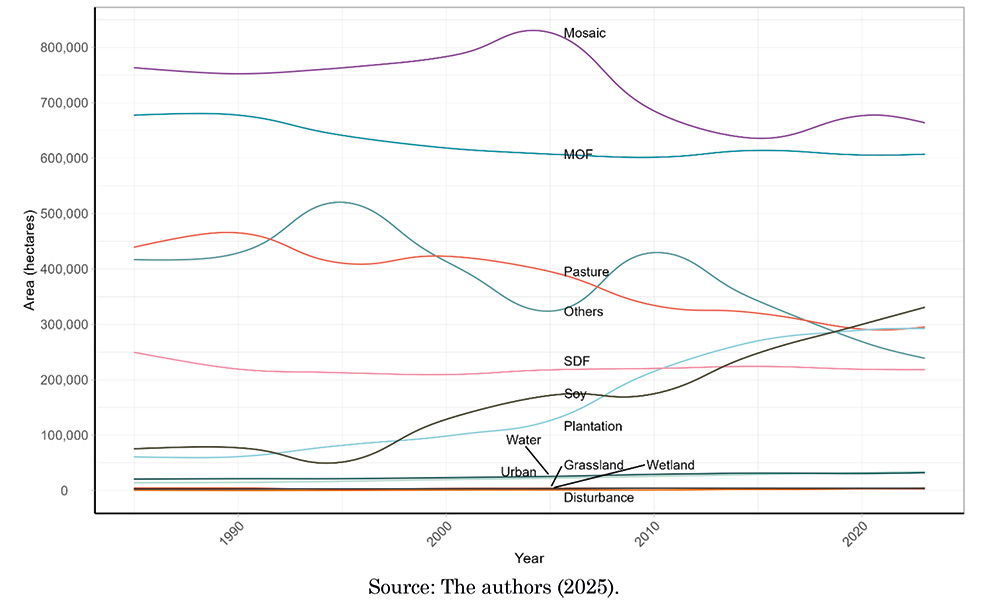
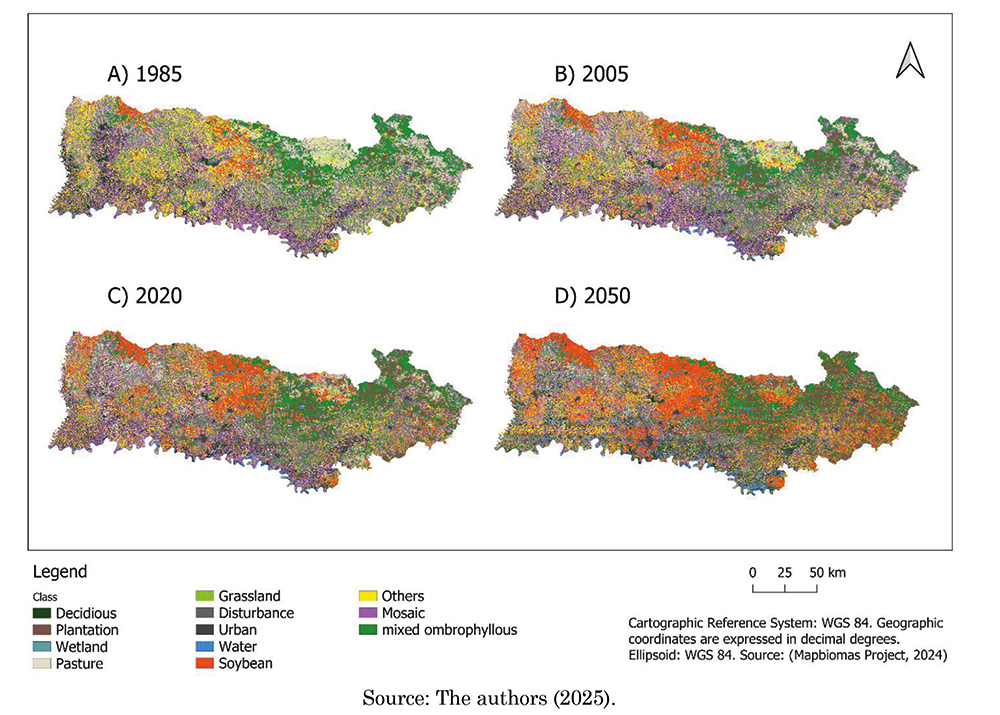
Large-scale soy production expanded from Southern to Northern regions from the 1950s onwards, starting from the Atlantic forest to Cerrado and, finally, to the Amazon (Lima et al., 2019). Although crops have been observed in the region assessed herein for decades, the first set of analyses has shown that soy emerged as one of the main drivers of change, particularly after 2000. This trend was followed by forest plantations that comply with the 2020 Global Forest Resources Assessment (Figure 2) (FAO, 2020). Pasture and other landscapes started to decline from 2005 onwards, while urban expansion experiences relatively slow increase.
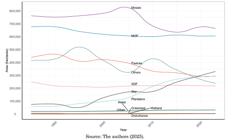
Plantations underwent a period of substantial expansion from 2005 to 2015, whereas urban areas recorded moderate growth rate. Class disturbance appointed towards relevant change degree (14.99%, inform 2015 to 2023), which highlighted anthropogenic pressure acceleration (Table 3).
LULC Prediction Results
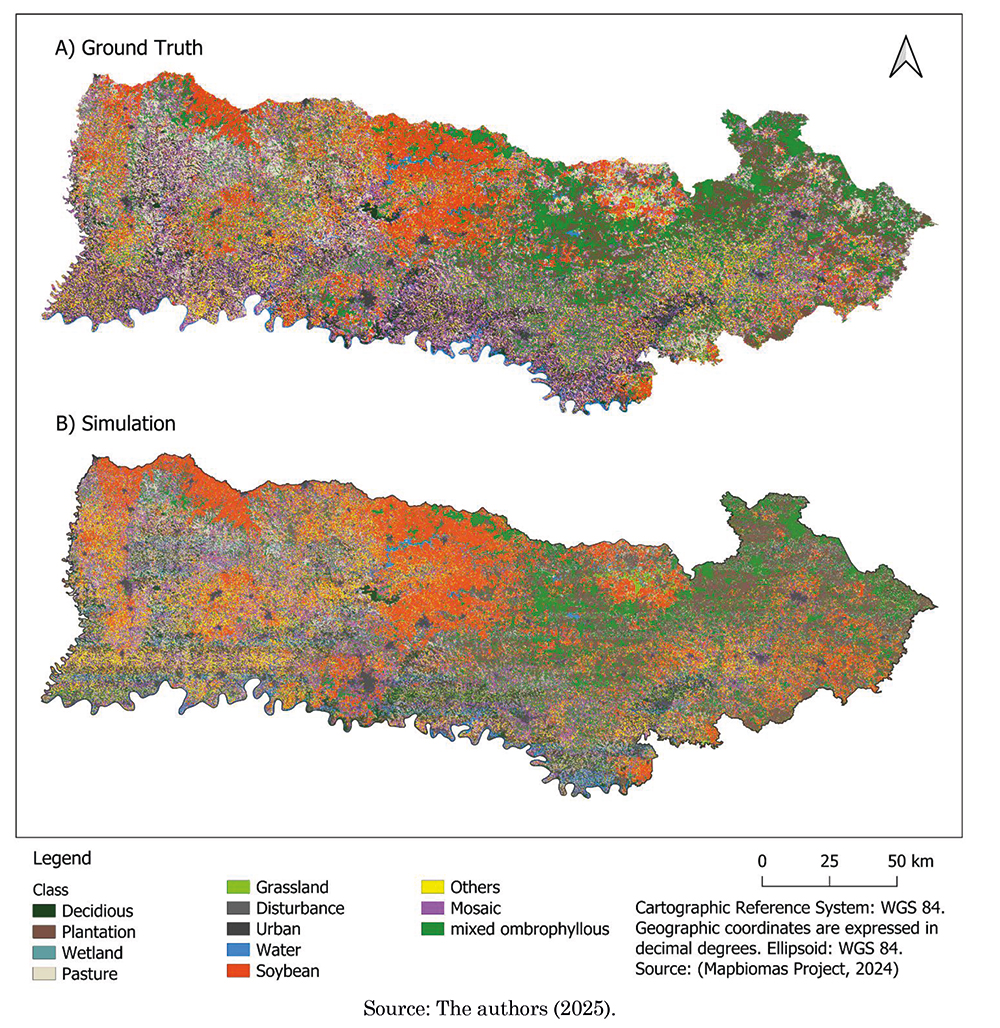
The map plotted from 2023 LULC prediction data showed significant similarity to the ground truth (Figure 3).
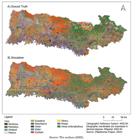
Higher accuracy was achieved through the current configuration. The model overall showed robust performance in compliance with results by Eastman et al. (2019): 0.94 WNL and 0.93 MLP (multilayer perceptron) through model comparison (Table 4). A previous model developed in this region found similar class “Accuracy” (Souza et al., 2022). Complete statistics for each class (Table 6).
The model showed high spatial accuracy degree highlighted by the pixel-level agreement Gridcell, which accounts for most of the overall accuracy. Disagree Gridcell Location errors were relatively minor, and it points out the model correctly assigning classes, but it occasionally misplacing them. Similarly, discrepancies in quantity were small, and it showed that the model effectively predicted the total volume of each class, regardless of their location (Table 5). Only 7.69% agreement could derive from chances, and it implies that the close correlation between the simulation and reference maps mainly resulted from the model's performance, rather than from random coincidences.
The model performed well in classes like plantation, soy, wetland, grassland, disturbance, urban and water, at class level. However, it performed lower in pasture, others and mosaic, which likely pinpointed classification conflicts (Table 6).
Model Limitations
This study's model has key limitations rooted in its modeling approach. It primarily relies on historical data and is based on a business-as-usual scenario; therefore, it does not account for external influences such as future climate conditions, and economic and social shifts, as well as for public policy implementation.
Net Change
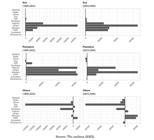
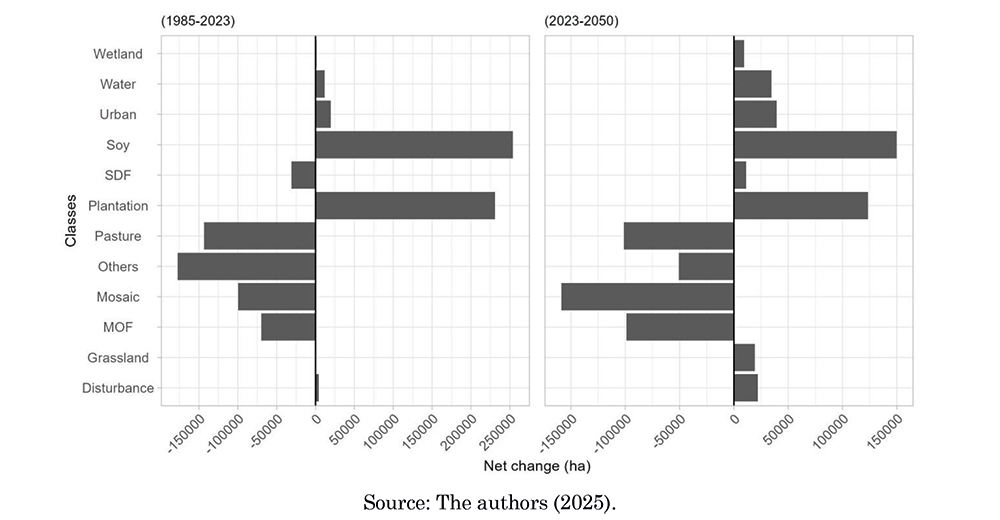
The comparison of time frames highlighted the land use change evolution. The first time frame (1985-2023) was mostly driven by soybean expansion. On the other hand, the second time frame (2023-2050) featured a more complex drivers’ interplay. Nonetheless, pasture, mosaic and MOF will keep on experiencing losses, whereas other classes will experience it through a less pronounced intensity (Figure 4).
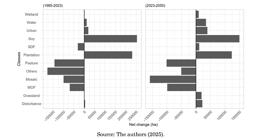
Future land use change rates must be projected to accelerate. MOF forested areas will face significant increase in loss in the second time frame: 98.913 hectares (2023-2050), in comparison to the 69.988 hectares recorded in the first one (1985-2023). This loss will be a threat to an already vulnerable area and increase the pressure put on biodiversity. Similarly, class mosaic will undergo the greatest loss (158.864 hectares from 2023 to 2050) in comparison to the 99.383 hectares recorded in the previous time frame.
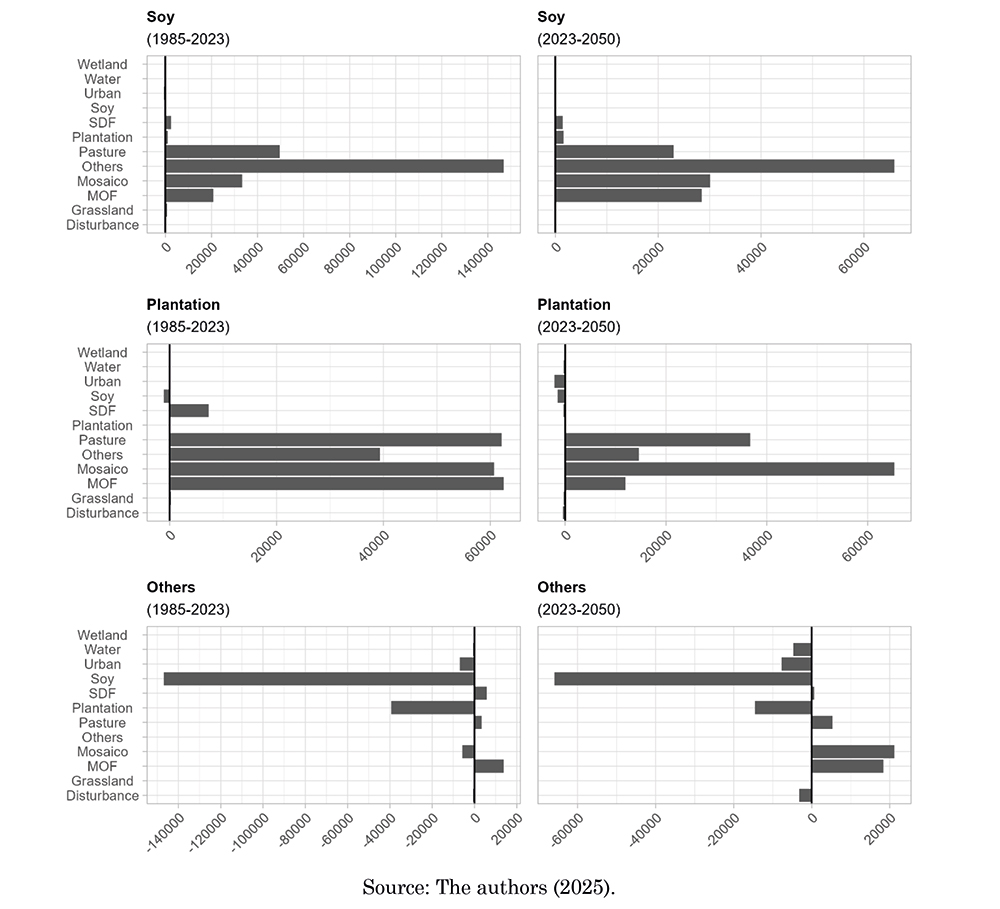
The following trends were identified for soybean when change drivers were the target, namely: agricultural expansion. Class others was the primary source of new soybean fields over the first time frame (1985-2023); it accounted for 146.946 hectares and was followed by pastures (49.607ha) and mosaic (33.305 ha). On the other hand, the land conversion pattern was projected to dramatically shift to others in the second timeframe. The total area converted from pasture, mosaic and MOF (81,587 ha) exceeded the total area converted from this single class.
In the first time frame, pasture, mosaic, and MOF each transferred ~60,000 ha to plantations. In the second, mosaic led with 65,320 ha. plantation expansion over agricultural lands is expected to continue, worsening tensions between agriculture and forestry. This issue has already been identified at global scale; forest areas will be suitable for agriculture in the next few decades, mainly in the Atlantic Forest. It contrasts with other Brazilian areas that are expected to become less suitable for it; consequently, it will increase the pressure on other lands (Bousfield et al., 2024). Finally, when it comes to class others, the previously mentioned point was confirmed, namely: soybean accounts for the largest allocation area in both time frames (Figure 5).
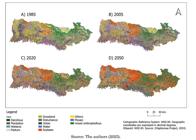
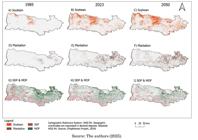
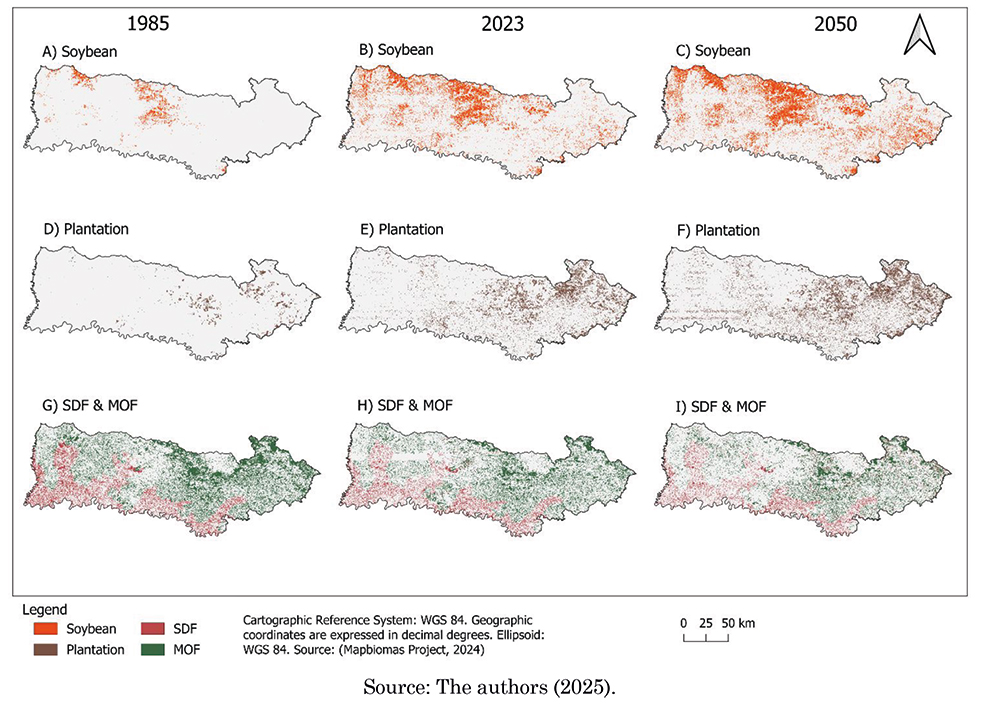
The observed spatial trend indicates that changes mostly take place primarily in the Central and Northern regions of the study site, due mainly because of soybean crops expansion (Figure 6). Initially (1985), plantations were more dispersed; however, by 2050, the trend will mostly head East (Figure 7). Observations pointed towards marked fragmentation in the last MOF remnants as deforestation in the primary forests can still be observed in the far Northern and Southern parts of the Atlantic Forest (Caballero et al., 2023). SDF areas did not present a high deforestation rate since deforestation took place before 1985. Consequently, the remaining SDF patches are currently largely stable, although they only represent a fraction of their original extension (Figure 7).
Environmental and Social Implications
According to Song et al. (2021), soybean cultivation will remain as main change and deforestation driver. From 2000 to 2019, soybean cultivated areas nearly doubled across the Pampas, Cerrado, and Atlantic Forest regions. Continued soybean expansion, driven by increasing climate suitability, could undermine Brazil's ability to meet its greenhouse gas emissions reduction targets under international climate agreements (Lima et al., 2019). This landscape configuration has been shaped by priority high-value agribusiness commodities aimed at international markets, which has a strong impact on staple food availability for domestic consumption and leads to price volatility and to growing food-access disparities (Souza; Ribeiro, 2025). In 2018, low-income households in parts of this region faced a high food insecurity risk despite strong income growth, remaining the most vulnerable (Cherol et al., 2023).
Like soybean, plantations are expanding globally in tropical forests, especially the Atlantic Forest Fagan et al. (2022). Though a carbon sink, plantations of pine/eucalyptus threaten biodiversity when replacing native forests. The Atlantic Forest has few old-growth remnants -80% are <50 ha. Most landscapes hold <30% native forest, with mean cover <20 years; ~1/3 have cover <10 years (Rosa et al., 2021). Such fragmentation endangers biodiversity due to small patch sizes (Branco et al., 2022; Scarano, 2015).
In this context, restoration action is imperative. As discussed by Bachion and Antoniazzi (2021), the concept of restoration extends beyond the mere recovery of vegetation cover. Instead, it encompasses the comprehensive revitalization of the landscape in its entirety, thereby enhancing its resilience and capacity to support both wildlife and human well-being. This approach to sustainable landscapes is predicated on the reinforcing of a holistic, integrated approach. In the context of the Atlantic Forest, the financial implications of restoration are subject to considerable variation, contingent on the methodology employed. According to Benini and Adeodato (2017), the financial outlay required for the implementation of the proposed measures ranges from R$ 21.271,00 per hectare for total planting to R$ 186,00 per hectare for natural regeneration. However, the success depends on various factors, such as institutional capacity and the organization of stakeholders. The Planaveg 2.0 has expanded the objectives of the restoration initiative (Brasil, 2024). In this context, land-use planning plays a crucial role, as the application of models and the analysis of landscape metrics enable the identification of areas with great potential to maximize connectivity between fragments, minimizing edge effects, and generating habitat patches with optimized dimensions and configurations.
CONCLUSION
Future trends analysis is essential for land-use planning. This study used machine learning and landscape-based variables to model fragmented areas across two-time frames: 1985-2023 dominated by soybean expansion and 2023-2050 marked by increases in both soybean and plantation forestry. This future scenario will accelerate losses of Mixed Ombrophilous Forest as it converts to eucalyptus and pine. The analysis also revealed high future competition between agriculture and forestry for land resources. These projected changes pose serious threats to biodiversity and ecosystem stability, highlighting the urgent need for integrated planning, conservation policies, and new forest management approaches. Without intervention, the ecological value of the Atlantic Forest biome will be increasingly compromised.
The preservation of native forest remnants must be reinforced by restoration policies and land-use planning, as ecosystem health is vital for agriculture. It is recommended that future studies incorporate climate scenarios to facilitate a more comprehensive understanding of the interactions between climate and land use change. This research constitutes a preliminary investigation into the future transformation of the region.
ACKNOWLEDGMENTS
During the preparation of this manuscript/study, the author(s) used Grammarly Pro for style and grammatical corrections.
Data availability
The data that underpin the results of this study may be made available by the corresponding author, upon duly justified request. [Norman Blanco Lupio].
REFERENCES
-
BACHION, L. C.; ANTONIAZZI, L. Análise econômica da cadeia produtiva da recuperação da vegetação nativa. Oportunidades para a recuperação em escala de paisagem na Mata Atlântica. São Paulo, Brasil: AGRICONE, 2021. Available: https://www.agroicone.com.br/wp-content/uploads/2021/06/Analise-cadeia-restauracao_relatorio-final.pdf Accessed on: apr. 14, 2026.
» https://www.agroicone.com.br/wp-content/uploads/2021/06/Analise-cadeia-restauracao_relatorio-final.pdf - BENINI, R. de M.; ADEODATO, S. Economia da restauração florestal. São Paulo (SP): The Nature Conservancy, 136 pp. 2017
-
BOUSFIELD, C. G.; MORTON, O.; EDWARDS, D. P. Climate change will exacerbate land conflict between agriculture and timber production. Nature Climate Change, v. 14, n. 10, p. 1071-1077, 2024. https://doi.org/10.1038/s41558-024-02113-z
» https://doi.org/10.1038/s41558-024-02113-z -
BRANCO, A. F. V. C.; LIMA, P. V. P. S.; MEDEIROS FILHO, E. S. de; COSTA, B. M. G.; PEREIRA, T. P. Avaliação da perda da biodiversidade na Mata Atlântica. Ciência Florestal, v. 31, p. 1885-1909, 2022. https://doi.org/10.5902/1980509853310
» https://doi.org/10.5902/1980509853310 -
BRASIL. LEI No 12.651 de 25 de agosto de 2012. Dispõe sobre a proteção da vegetação nativa, Brasília, DF, 2012. Available: https://www.planalto.gov.br/ccivil_03/_ato2011-2014/2012/lei/l12651.htm Accessed: 28 May 2025.
» https://www.planalto.gov.br/ccivil_03/_ato2011-2014/2012/lei/l12651.htm -
BRASIL. Plano Nacional de Recuperação da Vegetação Nativa 2025-2028: rota estratégica para recuperação de 12 milhões de hectareas. Brasilia: Ministério do Meio Ambiente e Mudança do Clima, 2024. Available: https://www.gov.br/mma/pt-br/composicao/sbio/dflo/plano-nacional-de-recuperacao-da-vegetacao-nativa-planaveg/planaveg_2025-2028_2dez2024.pdf Accessed on: apr. 13, 2026.
» https://www.gov.br/mma/pt-br/composicao/sbio/dflo/plano-nacional-de-recuperacao-da-vegetacao-nativa-planaveg/planaveg_2025-2028_2dez2024.pdf -
CABALLERO, C. B.; BIGGS, T. W.; VERGOPOLAN, N.; WEST, T. A. P.; RUHOFF, A. Transformation of Brazil’s biomes: The dynamics and fate of agriculture and pasture expansion into native vegetation. Science of The Total Environment, v. 896, p. 166323, 2023. https://doi.org/10.1016/j.scitotenv.2023.166323
» https://doi.org/10.1016/j.scitotenv.2023.166323 -
CABERNARD, L.; PFISTER, S.; HELLWEG, S. Biodiversity impacts of recent land-use change driven by increases in agri-food imports. Nature Sustainability, v. 7, n. 11, p. 1512-1524, 2024. https://doi.org/10.1038/s41893-024-01433-4
» https://doi.org/10.1038/s41893-024-01433-4 -
CATARINENSE, Observatório Agro. SC na frente. Observatório Agro Catarinense. 2025. Available: https://www.observatorioagro.sc.gov.br/publicacoes/artigos/diversos/sc-na-frente /. Accessed on: jun. 6, 2025.
» https://www.observatorioagro.sc.gov.br/publicacoes/artigos/diversos/sc-na-frente -
CHEROL, C. C. de S.; FERREIRA, A. A.; LIGNANI, J.de B.; SALLES-COSTA, R. Regional and social inequalities in food insecurity in Brazil, 2013-2018. Cadernos de Saúde Pública, v. 38, e00083822, 2023. https://doi.org/https://doi.org/10.1590/0102-311XEN083822
» https://doi.org/10.1590/0102-311XEN083822 -
EASTMAN, J. R. TerrSet LiberaGIS Geospatial Monitoring and Modeling System. Clark University, 2024. Available Available https://s45055.pcdn.co/centers/geospatial-analytics/www-content/blogs.dir/7/files/sites/354/2024/11/Terrset-liberaGIS-Manual.pdf Accessed on: jan. 16, 2025
» https://s45055.pcdn.co/centers/geospatial-analytics/www-content/blogs.dir/7/files/sites/354/2024/11/Terrset-liberaGIS-Manual.pdf -
EASTMAN, J. R.; STEFANO, C. C.; HANNAH, R. R.; KAIXI, Z. A weighted normalized likelihood procedure for empirical land change modeling. Modeling Earth Systems and Environment, v. 5, p. 985-996, 2019. https://doi.org/10.1007/s40808-019-00584-0
» https://doi.org/10.1007/s40808-019-00584-0 -
EMBRAPA. SRTM - Portal Embrapa. 2005. Available: https://www.embrapa.br/satelites-de-monitoramento/missoes/srtm Accessed on: feb. 26, 2025.
» https://www.embrapa.br/satelites-de-monitoramento/missoes/srtm -
FAGAN, M. E.; KIM, D.-H.; SETTLE, W.; FERRY, L.; DREW, J.; CARLSON, H.; SLAUGHTER, J.; SCHAFERBIEN, J.; TYUKAVINA, A.; HARRIS, N. L.; GOLDMAN, E.; ORDWAY, E. M. The expansion of tree plantations across tropical biomes. Nature Sustainability , v. 5, no. 8, p. 681-688, 2022. https://doi.org/10.1038/s41893-022-00904-w
» https://doi.org/10.1038/s41893-022-00904-w -
FAO. Global Forest Resources Assessment 2020. FAO, 2020. Available: https://openknowledge.fao.org/handle/20.500.14283/ca9825en Accessed on: jun. 11, 2025.
» https://openknowledge.fao.org/handle/20.500.14283/ca9825en -
GIRMA, R.; FÜRST, C.; MOGES, A. Land use land cover change modeling by integrating artificial neural network with cellular Automata-Markov chain model in Gidabo river basin, main Ethiopian rift. Environmental Challenges, v. 6, p. 100419, 2022. https://doi.org/10.1016/j.envc.2021.100419
» https://doi.org/10.1016/j.envc.2021.100419 -
HASSEN, E. E.; ASSEN, M. Land use/cover dynamics and its drivers in Gelda catchment, Lake Tana watershed, Ethiopia. Environmental Systems Research, v. 6, n. 1, p. 4, 2017.https://doi.org/10.1186/s40068-017-0081-x
» https://doi.org/10.1186/s40068-017-0081-x -
HIJMANS, R. J. terra: Spatial Data Analysis. p. 1.7-83. 2020. https://doi.org/10.32614/CRAN.package.terra
» https://doi.org/10.32614/CRAN.package.terra -
IBGE. Divisões Regionais do Brasil.1990. Available: https://www.ibge.gov.br/geociencias/cartas-e-mapas/redes-geograficas/15778-divisoes-regionais-do-brasil.html?=&t=downloads Accessed: feb. 26, 2025.
» https://www.ibge.gov.br/geociencias/cartas-e-mapas/redes-geograficas/15778-divisoes-regionais-do-brasil.html?=&t=downloads -
IBGE. Solos. 2006. Available: https://www.ibge.gov.br/geociencias/informacoes-ambientais/pedologia/15829-solos.html Accessed: feb. 26, 2025.
» https://www.ibge.gov.br/geociencias/informacoes-ambientais/pedologia/15829-solos.html -
IBGE. Downloads. 2023a. Available: https://www.ibge.gov.br/geociencias/downloads-geociencias.html?caminho=cartas_e_mapas/bases_cartograficas_continuas/bc100/acre /. Accessed on: feb. 26, 2025.
» https://www.ibge.gov.br/geociencias/downloads-geociencias.html?caminho=cartas_e_mapas/bases_cartograficas_continuas/bc100/acre -
IBGE. Cidades e Estados: Santa Catarina. Panorama. 2023b. Available: https://cidades.ibge.gov.br/brasil/sc/panorama Accessed on: jun. 6, 2025.
» https://cidades.ibge.gov.br/brasil/sc/panorama -
JALAYER, S.; SHARIFI, A.; ABBASI-MOGHADAM, D.; TARIQ, A.; QIN, S. Modeling and Predicting Land Use Land Cover Spatiotemporal Changes: A Case Study in Chalus Watershed, Iran. IEEE Journal of Selected Topics in Applied Earth Observations and Remote Sensing, v. 15, p. 5496-5513, 2022. https://doi.org/10.1109/JSTARS.2022.3189528
» https://doi.org/10.1109/JSTARS.2022.3189528 - KLEIN, R. M. Mapa fitogeográfico do estado de Santa Catarina. IItajaí: Herbário Barbosa Rodrigues, 24p. 1978. (Flora Ilustrada Catarinense).
-
KUHN, M.; WING, J.; WESTON, S.; WILLIAMS, A.; KEEFER, C.; ENGELHARDT, A.; COOPER, T.; MAYER, Z.; KENKEL, B.; R CORE T.; BENESTY, M.; LESCARBEAU, R.; ZIEM, A.; SCRUCCA, L.; TANG, Y.; CANDAN, C.; HUNT, T. Caret: Classification and Regression Training. Version 7.0-1. 2024. Available: https://cran.r-project.org/web/packages/caret/index.html Accessed on: may 16, 2025.
» https://cran.r-project.org/web/packages/caret/index.html -
LETA, M. K.; DEMISSIE, T. A.; TRÄNCKNER, J. Modeling and Prediction of Land Use Land Cover Change Dynamics Based on Land Change Modeler (LCM) in Nashe Watershed, Upper Blue Nile Basin, Ethiopia. Sustainability, v. 13, n. 7, p. 3740, 2021. https://doi.org/10.3390/su13073740
» https://doi.org/10.3390/su13073740 -
LIMA, M.; SILVA JUNIOR, C. A. da; RAUSCH, L.; GIBBS, H. K.; JOHANN, J. A. Demystifying sustainable soy in Brazil. Land Use Policy, v. 82, p. 349-352, 2019. https://doi.org/10.1016/j.landusepol.2018.12.016
» https://doi.org/10.1016/j.landusepol.2018.12.016 -
MAPBIOMAS PROJECT. Collection 9 of the Annual Land Cover and Land Use Maps of Brazil (1985-2023). MapBiomas Data, 2024. https://doi.org/10.58053/MapBiomas/XXUKA8
» https://doi.org/10.58053/MapBiomas/XXUKA8 -
MATAVELI, G.; CHAVES, M.; GUERRERO, J.; ESCOBAR-SILVA, E. V.; CONCEIÇÃO, K. Mining Is a Growing Threat within Indigenous Lands of the Brazilian Amazon. Remote Sensing, v. 14, no. 16, p. 4092, 2022. https://doi.org/10.3390/rs14164092
» https://doi.org/10.3390/rs14164092 -
MAZZA, C. A. da S.; MAZZA, M. C. M.; ALMEIDA, D.; SANTOS, J. E. dos; FUSHITA, A. T. Land Use and Environmental Zoning of Mixed Ombrophilous Forests for Sustainable Use (Irati National Forest, Brazil Southern Region). Brazilian Archives of Biology and Technology, v. 59, p. e16160058, 2016. https://doi.org/10.1590/1678-4324-2016160058
» https://doi.org/10.1590/1678-4324-2016160058 -
MONITORASC. Fitofisionomias: 3 classes (Klein 1978). 2021. Vector Data. Available: https://monitora.furb.br/layers/monitora_data:geonode:Klein_3classes Accessed on: sep. 30, 2025.
» https://monitora.furb.br/layers/monitora_data:geonode:Klein_3classes -
MUTALE, B.; QIANG, F. Modeling future land use and land cover under different scenarios using patch-generating land use simulation model. A case study of Ndola district. Frontiers in Environmental Science, v. 12, 2024. https://doi.org/10.3389/fenvs.2024.1362666
» https://doi.org/10.3389/fenvs.2024.1362666 - PONTIUS, R. G. Quantification Error Versus Location Error in Comparison of Categorical Maps. Photogrammetric Engineering & RemoteSensing, v. 66, n. 8, p. 1011-1016, 2000.
- PONTIUS, R. G. Statistical Methods to Partition Effects of Quantity and Location During Comparison of Categorical Maps at Multiple Resolutions. Photogrammetric Engineering & RemoteSensing , v. 68, n. 10, p. 1041-1049, 2002.
-
PONTIUS, R. G.; MILLONES, M. Death to Kappa: Birth of quantity disagreement and allocation disagreement for accuracy assessment. International Journal of Remote Sensing , v. 32, p. 4407-4429, 2011. https://doi.org/10.1080/01431161.2011.552923
» https://doi.org/10.1080/01431161.2011.552923 -
PONTIUS, R. G.; SUEDMEYER, B. Components of Agreement between Categorical Maps at Multiple Resolutions. In: LUNETTA, Ross; LYON, John (eds.). Remote Sensing and GIS Accuracy Assessment. Boca Raton FL: CRC Press, 2004. p. 233-251. https://doi.org/10.1201/9780203497586.ch17
» https://doi.org/10.1201/9780203497586.ch17 -
R CORE TEAM. R: A Language and Environment for Statistical Computing. Vienna, Austria: R Foundation for Statistical Computing, 2023. Available: https://www.R-project.org /. Accessed on: may 16, 2025
» https://www.R-project.org -
RIBEIRO, M. P.; MENEZES, G. P.; FIGUEIREDO, G. K. D. A.; de M., K.; VALENTE, R. A. Impacts of urban landscape pattern changes on land surface temperature in Southeast Brazil. Remote Sensing Applications: Society and Environment, v. 33, p. 101142, 2024. https://doi.org/10.1016/j.rsase.2024.101142
» https://doi.org/10.1016/j.rsase.2024.101142 -
ROSA, M. R.; BRANCALION, P. H. S.; CROUZEILLES, R.; TAMBOSI, L. R.; PIFFER, P. R.; LENTI, F. E. B.; HIROTA, M.; SANTIAMI, E.; METZGER, J. P. Hidden destruction of older forests threatens Brazil’s Atlantic Forest and challenges restoration programs. Science Advances, v. 7, n. 4, p. eabc4547, 2021. https://doi.org/10.1126/sciadv.abc4547
» https://doi.org/10.1126/sciadv.abc4547 -
SALAZAR, A.; BALDI, G.; HIROTA, M.; SYKTUS, J.; MCALPINE, C. Land use and land cover change impacts on the regional climate of non-Amazonian South America: A review. Global and Planetary Change, v. 128, p. 103-119, 2015. https://doi.org/10.1016/j.gloplacha.2015.02.009
» https://doi.org/10.1016/j.gloplacha.2015.02.009 -
SCARANO, F. Brazilian Atlantic forest: impact, vulnerability, and adaptation to climate change. Biodiversity and Conservation, v. 24, 2015. https://doi.org/10.1007/s10531-015-0972-y
» https://doi.org/10.1007/s10531-015-0972-y -
SCHLINDWEIN, S. L.; FEITOSA DE VASCONCELOS, A. C.; BONATTI, M.; SIEBER, S.; STRAPASSON, A.; LANA, M. Agricultural land use dynamics in the Brazilian part of La Plata Basin: From driving forces to societal responses. Land Use Policy , v. 107, p. 105519, 2021. https://doi.org/10.1016/j.landusepol.2021.105519
» https://doi.org/10.1016/j.landusepol.2021.105519 -
SEEG. Sistema de Estimativas de Emissões e Remoções de Gases de Efeito Estufa. 2025. Available: https://plataforma.seeg.eco.br /. Accessed on: jun. 13, 2025.
» https://plataforma.seeg.eco.br -
SONG, X.P.; HANSEN, M. C.; POTAPOV, P.; ADUSEI, B.; PICKERING, J.; ADAMI, M.; LIMA, A.; ZALLES, V.; STEHMAN, S. V.; DI BELLA, C. M.; CONDE, M. C.; COPATI, E. J.; FERNANDES, L. B.; HERNANDEZ-SERNA, A.; JANTZ, S. M.; PICKENS, A. H.; TURUBANOVA, S.; TYUKAVINA, A. Massive soybean expansion in South America since 2000 and implications for conservation. Nature Sustainability , v. 4, n. 9, p. 784-792, 2021. https://doi.org/10.1038/s41893-021-00729-z
» https://doi.org/10.1038/s41893-021-00729-z -
SOUZA, J. M. de; MORGADO, P.; COSTA, E. M. da; VIANNA, L.F. de N. Modeling of Land Use and Land Cover (LULC) Change Based on Artificial Neural Networks for the Chapecó River Ecological Corridor, Santa Catarina/Brazil. Sustainability , v. 14, n. 7, p. 4038, 2022. https://doi.org/10.3390/su14074038
» https://doi.org/10.3390/su14074038 -
SOUZA, R; RIBEIRO, J. The Impact of Brazil’s Agricultural Export Boom on Domestic Food Security. Law and Economy, v. 4, n. 1, p. 38-47, 2025. https://doi.org/10.56397/LE.2025.01.05
» https://doi.org/10.56397/LE.2025.01.05 -
TIAN, S.; WANG, S.; BAI, X.; LUO, G.; LI, Q.; YANG, Y.; HU, Z.; LI, C.; DENG, Y. Global patterns and changes of carbon emissions from land use during 1992-2015. Environmental Science and Ecotechnology, v. 7, p. 100108, 2021. https://doi.org/10.1016/j.ese.2021.100108
» https://doi.org/10.1016/j.ese.2021.100108 -
VANIN, G.T.; LACERDA, E. R.; MORI, G. M. Drivers of mangrove area change and suppression in Brazil from 2000 to 2020. Conservation Biology, p. e14426, 2024. https://doi.org/10.1111/cobi.14426
» https://doi.org/10.1111/cobi.14426 -
WINKLER, K.; FUCHS, R.; ROUNSEVELL, M.; HEROLD, M. Global land use changes are four times greater than previously estimated. Nature Communications, v. 12, n. 1, p. 2501, 2021. https://doi.org/10.1038/s41467-021-22702-2
» https://doi.org/10.1038/s41467-021-22702-2 -
ZHANG, Z.; LI, X.; LIU, X.; ZHAO, K. Dynamic simulation and projection of land use change using system dynamics model in the Chinese Tianshan mountainous region, central Asia. Ecological Modelling, v. 487, p. 110564, 2024. https://doi.org/10.1016/j.ecolmodel.2023.110564
» https://doi.org/10.1016/j.ecolmodel.2023.110564
-
ASSOCIATE EDITOR
Silvio Carlos Rodrigues https://orcid.org/0000-0002-5376-1773
Data citations
IBGE. Divisões Regionais do Brasil.1990. Available: https://www.ibge.gov.br/geociencias/cartas-e-mapas/redes-geograficas/15778-divisoes-regionais-do-brasil.html?=&t=downloads Accessed: feb. 26, 2025.
IBGE. Downloads. 2023a. Available: https://www.ibge.gov.br/geociencias/downloads-geociencias.html?caminho=cartas_e_mapas/bases_cartograficas_continuas/bc100/acre /. Accessed on: feb. 26, 2025.

 Source: The authors (2025).
 Source: The authors (2025).
 Source: The authors (2025).
 Source: The authors (2025).
 Source: The authors (2025).
 Source: The authors (2025).
 Source: The authors (2025).