
 Optimization of calcium phosphate biocement by utilizing soybean as an alternative enzyme urease in sandy soil improvement
Abstract
Calcium phosphate biocement with soybean as a urease alternative can be used for sand soil stabilization. Bone meal (BM) solution serves as a source of calcium and phosphate, whereas soybean acts as a urease catalyst that supports the precipitation of calcium phosphate (Ca3(PO4)2). This study aims to determine the optimal composition of a calcium phosphate biocement solution for sand soil improvement by evaluating direct shear strength parameters. The concentrations of soybean and BM increased the precipitation mineral mass by up to 0.67 g at a BM concentration of 0.4 mol/L and 50 g/L soybean, which became the optimal composition. In the direct shear test, the cohesion value increased from 0 to 16.13 kPa after 28 d of curing. However, there was a slight decrease in the internal friction angle from 27.18° under untreated soil conditions to 18.49° after 28 d of curing. In addition, the shear stress increased to a maximum of 34.16 kPa at a normal stress of 5.21 kPa after 28 d of curing. The mineral compositions formed were hydroxyapatite, calcite, and brushite. Hydroxyapatite is a calcium phosphate crystal group that dominates sand soil samples with hexagonal, needle-like, and amorphous phases.
Keywords:
Bio cementation; Biogeotechnology; Calcium phosphate; Sandy soil; Soil improvement; Soybean
1. Introduction
Indonesia has the second longest coastline in the world, with a total length of 81,000 km (Wattimena & Ayal, 2018). Indonesia's long coastline includes many coastal areas. Coastal areas are generally dominated by sandy soil with uniform gradation characteristics, relatively low density, and a low carrying capacity (Sholihah et al., 2019). Coastal areas often encounter various obstacles, such as the low bearing capacity of the soil and the high level of compressibility of the sandy soil layer, thus requiring efforts to improve (stabilize) the soil (Rujikiatkamjorn & Indraratna, 2015).
Soil improvement is performed to improve the nature or properties of the soil to achieve the bearing capacity required in construction work (Al-Bared et al., 2018). These can be performed mechanically, chemically, or vegetatively. The selection of soil improvement methods must be appropriately considered based on soil characteristics, required soil-bearing capacity, and cost estimates (Verma et al., 2021). Currently, mechanical improvements, including compaction and soil replacement, are the most widely used soil improvement methods (Wardani et al., 2018). However, mechanical methods are less appropriate when applied to sandy soils in coastal areas because the operation of heavy equipment is difficult and incurs high costs (Chaplin, 2022). Vegetative improvement by planting mangroves is easier to apply in coastal areas, but requires maintenance control to ensure that the plants remain alive (Faza & Kurniadi, 2016). Chemical improvement is another alternative to improving sandy soil by adding additives in the form of solids or solutions mixed into the soil (Darwis, 2017).
Additives that are often used for chemical soil improvement include limestone, fly ash (Walewangko et al., 2020), and chemical solutions such as magnesium and aluminum salts (Panguriseng, 2017). The addition of additives to the soil produces by-products that can pollute the soil; therefore, the selection of chemicals needs to be considered. Calcium-based additives, such as cement, gypsum, and lime, have proven their effectiveness in improving soil (Renjith et al., 2021), but have side effects that pollute the soil, such as causing changes in pH, polluting groundwater, and reducing the rate of degradation of organic matter in the soil (Wang et al., 2018). This has spurred the development of more environmentally friendly soil improvement techniques such as biocementation (Avramenko et al., 2023). The currently developed biocementation method is the mineral precipitation method, one of which is calcium carbonate mineral precipitation (CaCO3), also known as calcite precipitation.
The calcite precipitation method, which has been developed from microbially induced calcite precipitation (MICP) and enzyme-induced calcite precipitation (EICP) to the latest Soybean Crude Urease Calcite Precipitation (SCU-CP), has proven to be effective in increasing soil strength (Kavazanjian & Hamdan, 2015; Bibi et al., 2018; Putra et al., 2020). However, calcite dissolves easily under acidic conditions and produces carbon dioxide (CO2) gas; therefore, it is not suitable for soils with acidic pH (Jafar, 2021). Therefore, several other minerals including dolomite, hematite, and apatite have been developed as alternatives to calcite. Apatite is a mineral formed from calcium phosphate compounds (Ca3(PO4)2), which have better adaptation capabilities than calcite in terms of structural and physical-chemical properties (Combes et al., 2016). Based on the Mohs scale, apatite minerals have a value of five, whereas calcite minerals have a value of three. A higher Mohs scale indicates a higher level of hardness. Research conducted by Broz et al. (2006) proved that the microhardness of apatite minerals is higher than that of calcite minerals, with values of 5.43 GPa in apatite minerals and 1.49 GPa, respectively. The superior properties of apatite minerals compared to calcite have the potential to be further developed in the biocementation method in an effort to improve soil strength. Research conducted by Gowthaman et al. (2021) showed that calcium phosphate biocementation can be achieved by adding acid urease as a catalyst to hydrolyze urea. However, the large need for acid urease in field-scale applications makes it uneconomical; therefore, alternative materials are required as substitutes for acid urease. However, the use of soybeans as a substitute for the urease enzyme, which has been proven effective and economical in the SCU-CP method, has the potential to be developed in the calcium phosphate biocementation method.
Calcium phosphate compounds (CPC) are biocompatible materials that mostly consist of calcium (Ca) and phosphorus (P) and can harden (Avramenko et al., 2022). CPC is abundant in the bone and teeth tissues of vertebrates, including humans (Toshima et al., 2014). The solubility of calcium phosphate compounds in the CPC precipitation method is influenced by the pH (Tung, 1998). Microbial or enzymatic hydrolysis of urea can be performed to control the pH during the formation of calcium phosphate biocement (Ivanov et al., 2019). Calcium phosphate biocement is formed from the hardening reaction of calcium phosphate with a catalyst, such as urease, which forms apatite crystals and fills the pore space in the soil. This study tested the effectiveness of calcium phosphate biocement as a method for improving sandy soils. Calcium phosphate biocement is prepared from a mixture of cow bone meal (BM) powder with the addition of soybean solution as a catalyst. Cow bone meal was chosen because it is economical and has high calcium and phosphate contents (Makara et al., 2015). The effectiveness of the method was evaluated by reviewing the shear strength parameters of sandy soil tested using a direct shear test.
2. Materials and methods
2.1 Soil properties testing
The soil property testing consisted of gradation, specific gravity, and pore number tests. Soil gradation testing was performed to classify the distribution of soil grain size by referring to SNI 3423:2008 Soil Grain Size Analysis Test Methods (BSN, 2008b). Specific gravity testing was performed to determine the specific gravity values of the sandy soil samples. Soil-specific gravity testing was performed by referring to the Indonesian Standard (SNI) 1964:2008 using soil-specific gravity test methods (BSN, 2008a). Pore number testing aims to identify the pore volume of the sandy soil samples. Pore number testing was performed under maximum (emax) and minimum (emin) conditions. Maximum and minimum pore number testing was carried out by referring to ASTM D4253-2016 (ASTM, 2016a) concerning “Maximum Index Density and Unit Weight of Soils Using a Vibratory Table” and ASTM D4254-2016 (ASTM, 2016b) concerning “Minimum Index Density and Unit Weight of Soils and Calculation of Relative Density.” The data from the specific gravity and pore number tests were used to determine the weight of the sandy soil sample to be added to the mold for each test.
Physical property testing was conducted to classify and determine the characteristics of sandy soil samples. The physical parameters of the analyzed soil included specific gravity, grain size gradation, and pore number. The results of the physical parameter testing of sandy soil are presented in Table 1.
The specific gravity of the soil particles was 2.44, which is a low value for siliceous (quartz) sand. The number of pores was determined under two conditions: maximum (emax) and minimum (emin). The maximum and minimum pore numbers in the sandy soil sample were 0.58 and 0.49, respectively. The relative density of the soil sample was planned to be 50%; therefore, the actual pore number value (e) in the soil sample was 0.53. According to ASTM (2011), the actual pore number value is included in dense uniform sandy soil. The results of the gradation test showed uniformity coefficient (Cu) and gradation coefficient (Cc) values of 4.08 and 1.02, respectively. The soil gradation test also determined the distribution of soil grain sizes indicated by the D10, D30, and D60 values of 0.27, 0.54, and 1.09 mm, respectively. According to the Unified Soil Classification System (USCS), the soil sample belongs to the well-graded sand (SW) type (ASTM, 2011). The grain size distributions of the sandy soil samples are shown in Figure 1.
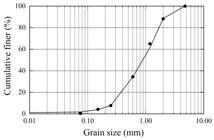
The results of the property test showed that the sand grains were dominated by particle sizes smaller than 1.09 mm, which was proven by the D60 value. The D60 value of 1.09 mm indicates that 60% of the total sand grains pass through a sieve with a size of 1.09 mm (Putra, 2019). The results of the soil property tests describe the characteristics of the soil, which are important considerations when selecting a soil improvement method. The selection of soil improvement methods based on soil characteristics is regulated in SNI 8460:2017 concerning Geotechnical Design Requirements (BSN, 2017). Based on the results of soil property tests, several soil improvement methods can be selected, including chemical grouting, jet grouting, and deep cement mixing (DCM). The chemical grouting method can be applied to sandy to silt soil in the grain size range of 0.02–1 mm, whereas the jet grouting and deep cement mixing methods have a wider application range, namely up to clay size with a grain size range of 0.0001–1 mm. Chemical grouting is the most suitable soil improvement method based on the distribution of sand sample grain sizes. One of the soil improvement methods using chemical grouting is biocement solution precipitation, which includes calcium-phosphate biocement.
2.2. Preparation of biocement solution
The calcium phosphate biocement solution was manufactured by developing the research methods developed by Putra et al. (2021) and Gowthaman et al. (2021). The calcium phosphate biocement solution was prepared by mixing three solutions: bone meal (BM), urea, and soybean solutions. The BM solution was prepared by dissolving BM powder that had passed through sieve no. 40 in distilled water (DW). The BM solution was stirred for 15 min using a magnetic stirrer to dissolve the BM powder homogeneously. The BM solution was filtered using sieve No. 400. The urea solution was prepared by dissolving urea in distilled water. The urea solution was stirred for 5 min using a magnetic stirrer and then stored in a glass bottle. The soybean solution was prepared by dissolving soybean powder in distilled water (DW). The soybean solution was stirred for 5 min using a magnetic stirrer and filtered using a No. 400. The three solutions were mixed in a beaker with a volume ratio of BM, urea, and soybean solutions of 1:1:2. The mixed solution was stirred using a magnetic stirrer for 5 min and then poured into a test tube for precipitation. The concentrations of BM powder in the BM solution, urea in the urea solution, and soybean powder in the soybean solution were varied, as listed in Table 2. The process scheme for preparing the calcium phosphate biocement solution is illustrated in Figure 2.

2.3 Precipitation test
The mixed solution prepared using the composition listed in Table 2 was then poured into a tube and left for 7 days of curing time to conduct the precipitation test. After seven days of curing, the solution sample was filtered using filter paper. The precipitate formed on the tube wall and filter paper is oven-dried for 3 days at a temperature of 60C until the tube and filter paper are dry. The tubes and filter papers were reweighed to determine the total mass of the precipitate formed. A schematic of the precipitation test procedure is presented in Figure 3.

2.4 Direct shear strength test
A biocement solution with an optimum composition, indicated by a high actual mass of precipitation minerals and calcium phosphate crystal count, was then used as a treatment solution for the sandy soil samples. The biocement solution and sandy soil samples were mixed using the pre-mixing method, poured into a direct shear test mold, and cured at room temperature for 7, 14, and 28 d. A direct shear test was conducted on untreated and treated samples aged 7, 14, and 28 d to evaluate the effectiveness of the calcium phosphate biocement method on the soil cohesion value, internal friction angle, and the observed trend. A direct shear test was conducted with reference to SNI 3420:2016, which concerns the direct shear strength test method for unconsolidated and undrained soils (BSN, 2016). The results of the direct shear strength test showed the relationship between the normal and shear stresses on the failure plane of each sample.
2.5 SEM and XRD testing
Scanning electron microscopy (SEM) was conducted to identify changes in the microstructural morphology of the treated soil grains due to the calcium phosphate biocementation process. The treated soil samples were inserted into a sample holder with a double adhesive and then coated with a gold coating under high vacuum conditions. The samples were analyzed at a magnification of 1500 × and voltage acceleration of 20 kV.
X-Ray Diffraction testing was performed to identify the characteristics and composition of the calcium phosphate crystals formed (brushite or apatite). XRD analysis also produced quantitative crystal area values to determine the degree of crystallinity of the formed crystal minerals. In XRD analysis, the sample will be shot with X-Ray rays which are then diffracted to the detection machine then the wavelength of X-Ray electromagnetic radiation (𝜆) with a diffraction angle (𝜃) will be produced. The X-ray beam diffracted from the sample was analyzed, and its peak intensity was calculated. Data processing on the XRD machine works by utilizing a diffraction angle range of 2𝜃 to observe all possible diffraction rays from mineral samples, both in crystal, powder, and amorphous forms (Bunaciu et al., 2015). The results of the XRD analysis are depicted in the form of a peak relationship graph of the identified mineral samples with a certain intensity at a certain diffraction angle of 2𝜃.
3. Analysis and results
3.1 Precipitated mineral mass
Precipitation tests were conducted using the test tube experiment method based on the experimental conditions of varying bone meal powder (BM) and soybean concentrations, as presented in Table 2. The actual mass of precipitated minerals accumulated from the sediment formed in the tube and on the filter paper. The mass of the mineral precipitate formed from the test results was used as a reference to determine the rate of mineral crystal formation during the precipitation tests. Precipitation tests were conducted on all samples at a curing time of 7 d (168 h). The results of the precipitation test on the biocement solution samples are shown in Figure 4.

The results of the actual mass of precipitated minerals in Figure 4 show a change in the mass of minerals in the biocement solution sample, both in the variation of BM and soybean concentrations, even though the urea concentration was constant at 1.0 mol/L. A BM concentration of 0.3 mol/L with a soybean concentration of 30 g/L formed mineral precipitation of 0.08 g. The increase in precipitation mineral mass continued with the addition of soybeans, with the largest value of precipitation mineral mass obtained at a soybean concentration of 50 g/L of 0.16 g. The increase in the precipitation mineral mass was not significant. An increase in mass also occurred with the addition of BM.
At a BM concentration of 0.4 mol/L and soybean concentration of 30 g/L, the mass of precipitated minerals was 0.19 g. At this BM concentration, the mass of the precipitated minerals continued to increase with increasing soybean concentrations. The increase was more significant than that observed at a BM concentration of 0.4 mol/L. The highest mass of precipitated minerals occurred at a soybean concentration of 50 g/L, reaching 0.67 g. This value was the maximum of all variations in the biocement solution samples.
At a BM concentration of 0.5 mol/L and a soybean concentration of 30 g/L, the mass of precipitated minerals was 0.33 g. At this BM concentration, the addition of soybean did not increase the mass of precipitation minerals. An increase in precipitation mineral mass only occurred when the soybean concentration was increased to 40 g/L, with a resulting precipitation mineral mass of 0.48 g. An increase in the soybean concentration to 50 g/L resulted in a decrease in the mass of precipitated minerals to 0.28 g.
The precipitation test results for all variations in BM and soybean concentrations showed a positive trend. When viewed based on the same BM concentration, the increase in soybean concentration resulted in an increase in the mineral mass of the precipitation in almost all samples. However, when viewed based on the same soybean concentration, the mass of precipitated minerals continued to increase with an increase in BM concentration in almost all samples. Overall, both increasing BM and soy concentrations resulted in an increase in the precipitation mineral mass. Only a BM concentration of 0.5 mol/L BM concentration decreased. This result is consistent with that reported by Ivanov et al. (2019), who stated that calcium phosphate precipitation is strongly influenced by the balance of the Ca/P ratio. Based on the results of the precipitation test, the biocement solution with the addition of BM 0.4 mol/L, soybean 50 g/L, and urea 1.0 mol/L was the optimal composition for forming mineral crystals, including calcium phosphate (Ca3(PO4)2) minerals.
3.2 Biocement solution stability
Solution stability is an important factor in determining the optimal mixing reaction time intervals. The stability of calcium phosphate biocement solutions can be measured using several parameters, such as solubility, ion reactivity, and pH. The solubility of calcium phosphate in liquid media is influenced by the ratio of Ca2+ to PO43- ions, which determines the saturation level of the solution and precipitation rate (Avramenko et al., 2024). In addition, the reactivity of ions in solution is highly dependent on the chemical conditions of the environment, including the concentration of interfering ions and reaction temperature (Gowthaman et al., 2019). Monitoring the pH during solution mixing is a commonly used method. Changes in pH can reflect the interaction of ions in the solution, including the rate of precipitation and the saturation level of the minerals formed (Ivanov et al., 2019). The results of pH monitoring during the mixing process of the calcium phosphate biocement solution are presented in Figure 5.

Based on the pH monitoring results during the solution mixing process presented in Figure 5, a total reaction time of 24 min was obtained. Under the initial conditions, the pH of the solution was 3.03. The pH of the solution increased with increasing reaction duration. From 0 to 6 min, there was a significant increase in pH from 3.03 to 4.62. This indicates an initial chemical reaction involving the release of hydroxide ions (OH −) and the binding of hydrogen ions (H+). In this initial reaction, the biocement components also dissolved, which affected the rapid increase in the pH of the solution. From 6 to 18 min, the increase in pH began to slow down, from 4.62 to 6.15. The decreasing rate of the pH change indicates the onset of a reaction approaching equilibrium, which is marked by the formation of crystalline solids, thus slowing the change in pH. In the final reaction, from 18 to 24 min, the pH of the solution stabilized at 6.15. This indicates that the solution has reached a stable condition or that equilibrium has occurred. Based on the overall reaction, the solution tended to be stable after 18 min of mixing, which indicated the optimal time for mixing the calcium phosphate biocement solution.
The optimal time for the mixing reaction was obtained from the intersection of the two straight lines with different gradients. The two straight lines can be identified by drawing a straight line from the parabolic trend that experiences changes in slope. Both are connected, and the intersection point of the two lines is obtained, which indicates the optimal time for the mixing reaction. The optimal mixing reaction indicated the formation of a stable calcium phosphate complex in the solution. Compared to other biocement solution mixing reactions, namely mixing the SCU-CP solution, the optimal time for mixing the calcium phosphate biocement solution was longer than that for mixing the SCU-CP solution, which only took approximately 10 min (Lofianda et al., 2021). This condition is because the calcium phosphate compound has a more complex structure than calcium carbonate; therefore, it takes longer to release and bind ions (Noviyanti et al., 2017). Based on the parabolic trend formed in the graph, the coefficient of determination (R2) value was 0.98. The R2 value indicates that approximately 98% of the variation in pH can be explained by the reaction time, whereas the rest can be caused by other factors, such as environmental conditions or inappropriate test methods. An R2 value approaching 1 indicates that the parabolic model obtained is good and representative for predicting pH changes with the reaction time.
3.3 Shear strength parameters
The increase in the shear strength parameters of the soil samples after being treated with the calcium phosphate biocement solution was evaluated using the direct shear test method. Shear strength parameters consist of cohesion (c) and internal friction angle (ϕ) obtained from direct shear testing. Soil samples with the solution were cured for 7, 14, and 28 days. Direct shear testing was performed on samples that had passed the curing time with normal stress variations of 1.74, 3.47, and 5.21 kPa. The results of the direct shear testing on all samples were then compared with those of the samples before being given the solution (untreated). The results of the direct shear tests are shown in Figure 6 and Figure 7.


The results of the direct shear test showed an increase in cohesion, internal friction angle, and shear stress as the curing time increased. Meanwhile, the samples that were not treated with the calcium phosphate biocement solution (untreated) had a cohesion value of 0 and an internal friction angle of 27.18°. From the perspective of the cohesion parameter, it was found that the addition of calcium phosphate biocement solution can increase the cohesion value of sand soil samples along with the curing time, namely 7, 14, and 28 days with cohesion values of 14.71 kPa, 15.19 kPa, and 16.13 kPa, respectively. From the perspective of the internal friction angle parameter, it was found that the addition of the calcium phosphate biocement solution decreased the internal friction angle of the sand samples from untreated conditions. The internal friction angle of all samples treated with the calcium phosphate biocement solution was smaller than that of the samples not treated with the solution, but the value increased with curing time. The internal friction angle values of the sandy soil samples cured for 7, 14, and 28 d were 14.08°, 16.31°, and 18.49°, respectively. The changes in the cohesion and internal friction angles altered the consistency of the soil. A cohesion value that is no longer zero indicates that the soil sample is no longer a cohesionless or sandy soil type but a cohesive soil type. The internal friction angle values obtained were within the range that included clay soil types (Sunggono, 1984). However, soil samples cannot be classified as cohesive or clay soils based only on the changes in the cohesion and internal friction angle values. Other parameters, such as plasticity index and permeability must also be considered. The cohesion parameters and internal friction angle obtained indicate that the biocement crystallization process significantly increased the cohesion value but did not significantly affect the internal friction angle (Zhang et al., 2023).
In addition, when reviewing the slope of the trendline of each sample, it was found that the trendline of the untreated sample had the sharpest slope and at some point intersected the trendline of all treated samples. This indicates that the increase in normal stress has a significant effect on the untreated sample, and the greater the normal stress applied, the greater the shear stress of the untreated soil. At some points, the shear stress value was the same as that of the treated sample. These results confirm that the soil improvement method using calcium phosphate from the research results has an effective performance limit. The limit value of the normal stress, which was the effective limit of the research results, was 5 kPa. If the applied normal stress was greater than 5 kPa, the untreated sample had the same shear stress value or even exceeded that of the treated sample. Therefore, in field-scale applications, it is necessary to analyze the load of the building to be constructed to determine the suitability of the soil improvement method.
Changes in the sandy soil sample owing to the addition of the calcium phosphate biocement solution can be more clearly observed in the shear stress value. As shown in Figure 7, the shear stress values obtained for all treated samples were higher than those of samples that were not given a solution (untreated) and continued to increase with curing time. In the untreated sample, the shear stress values obtained at normal stresses of 1.74, 3.47, and 5.21 kPa were 11.39, 17.08, and 25.62 kPa, respectively. In the treated sample with a curing time of 7 d, the shear stress values obtained at normal stresses of 1.74, 3.47, and 5.21 kPa were 19.93, 21.35, and 28.46 kPa, respectively. In the treated sample with a curing time of 14 d, the shear stress values obtained at normal stresses of 1.74, 3.47, and 5.21 kPa were 21.35, 22.77, and 31.31 kPa, respectively. In the treated sample with a curing time of 28 d, the shear stress values obtained at normal stresses of 1.74, 3.47, and 5.21 kPa were 22.77, 25.62, and 34.16 kPa, respectively. The results obtained showed an increase in shear stress over the curing time owing to the precipitation of calcium phosphate minerals, which were formed more and distributed more evenly, thus increasing the bearing capacity of the soil against shear loads (Sun et al., 2020).
3.4 Mineralogy and morphology of Ca3(PO4)2
The composition and mineral phase of the Ca3(PO4)2 precipitate were identified using X-Ray Diffraction (XRD) analysis. XRD analysis provides information on the mineral structure, phase, crystal orientation, and degree of crystallinity of the mineral samples (Bunaciu et al., 2015). In this study, XRD analysis was conducted to evaluate the composition and mineral phases of the precipitated minerals and treated soil samples aged for 28 d. The XRD analysis was conducted using Match! software, and the results are shown in Figure 8.
XRD analysis of the precipitated mineral sample showed that there were several minerals, including hydroxyapatite (Ca5(PO4)3OH), calcite (CaCO3), and brushite (CaHPO4.2(H2O)). The mineral composition was 54.2% hydroxyapatite, 26.4% brushite, and 19.4% calcite. Hydroxyapatite is the main mineral found in the calcium phosphate biocement solution, as indicated by its dominant composition and highest intensity (i.e., highest peak). Hydroxyapatite mineral was identified at diffraction angles (2θ ) 16.94˚; 25.77˚; 31.61˚; 32.06˚; 32.66˚; 39.35˚; 39.60˚; 39.90˚, 52.99˚; 65.02˚; 71.23˚; 87.38˚, with the highest peak at an angle of 31.61˚. Calcite minerals were identified at diffraction angles (2θ ) of 46.54 °and 63.76°, whereas brushite minerals were identified at diffraction angles (2θ ) of 33.89°, 44.61°, 49.30°, and 76.85°. Furthermore, the results of the XRD analysis of the treated soil samples showed the presence of the same three minerals as those found in the calcium phosphate biocement solution, but there was one additional mineral, namely quartz (SiO2), which is the main mineral that makes up soil and rocks (Viney et al., 2017). Each mineral was composed of 42.6% quartz, 35.3% hydroxyapatite, 19% calcite, and 3.1% brushite (Table Quartz was the main mineral found in the treated soil samples, as indicated by its dominant composition and highest intensity (highest peak). Quartz minerals are identified at diffraction angles (2θ) 26.64˚; 36.57˚; 40.30˚; 45.79˚; 50.13˚; 54.89˚; 20.85˚; 59.95˚; 67.72˚; 20.85˚; 68.30˚; 73.46˚; 75.65˚; 20.85˚; 79.88˚; 81.46˚; 83.82˚, with the highest peak at an angle of 26.64˚. Hydroxyapatite minerals were identified only at 39.48° and 64.02°.
The XRD pattern of the precipitated mineral sample was significantly different from the XRD graph shape of the treated soil. The XRD results of the precipitated mineral sample had much lower peak intensity values and wider peak areas (not sharp) than the XRD results of the treated soil. This shows that the mineral phase formed in the precipitated mineral sample has a low degree of crystallinity, such that the crystals formed are not perfect (Rujitanapanich et al., 2014), whereas the mineral phase formed in the treated soil has a higher degree of crystallinity, such that the crystals formed are more stable and perfect. Hydroxyapatite minerals precipitated in sandy soil samples were identified in the treated soil with a composition of 35.3%. This figure shows that hydroxyapatite minerals are dominant, but their presence cannot replace quartz as the main mineral in the sandy soil samples. In addition to hydroxyapatite, other minerals included in the apatite mineral group are fluorapatite and chlorapatite, which were identified in the XRD results but are not displayed. Hydroxyapatite, fluorapatite, and chlorapatite are apatite groups with very similar molecular configurations: Ca5(PO4)3OH or apatite (Ca-OH) for hydroxyapatite, Ca5(PO4)3F or apatite (Ca-F) for fluorapatite, and Ca5(PO4)3Cl or apatite (Ca-Cl) for chlorapatite (Pasero et al., 2010). Fluorapatite and chlorapatite are not shown in the XRD graph, either in the biocement solution or treated soil, because the materials used in this study did not contain fluorine (F) or Cl (chlorine). In addition, hydroxyapatite is the most stable calcium phosphate compound in the apatite group; therefore, it is the main focus of the precipitation of calcium phosphate minerals (Chow, 2009).
In addition to their composition and phase, the morphology of minerals precipitated in the sand soil sample was evaluated using scanning electron microscopy (SEM). SEM analysis was performed on the precipitated mineral sample and 28-day treated soil at a magnification of 15,000. The results of the SEM analysis are presented in Figure 9.

The SEM analysis of the precipitated mineral sample showed that several specimens formed a thread-like fibril pattern that became a connection between crystallized minerals. The shape of the crystal surface of the precipitate in the biocement solution was hollow and some were solid. The hollow crystal surface indicates the level of crystal fragility. This is consistent with the XRD results, which validate that the mineral crystals formed in the calcium phosphate biocement solution were imperfect. Similar results were reported by Agusriyadin et al. (2023), who reported that hydroxyapatite crystals have a porous/hollow surface. Furthermore, the SEM analysis of the treated soil samples revealed the dominance of sand particles with heterogeneous shapes and sizes. Calcium phosphate minerals that precipitated in the sand samples were observed to fill the cavities between sand particles with inhomogeneous shapes and sizes. The presence of these crystalline minerals increased the number of contact areas between sand particles, thus validating the increase in cohesion values in the shear strength parameters.
The morphological structures of the mineral crystals formed in the treated soil samples consisted of several forms. Large crystals in the form of trigonal trapezohedral (trapezoid) crystals were identified as quartz minerals. Small crystals in the form of rhombohedral (diamond), hexagonal, needle, round, plate, and amorphous crystals were identified as hydroxyapatite, calcite, and brushite minerals. The SEM results were compared with those of Elliott et al. (2002), who stated that the crystal structure of hydroxyapatite is hexagonal with lattice parameter values a=b=9.37 Å and c=6.88 Å. In addition to the hexagonal form, hydroxyapatite crystals were identified as needle-shaped and amorphous. It is difficult to identify the type of mineral in the amorphous form because the crystal structure is not yet perfect and all minerals can form it. However, needle-shaped crystals can also be identified as hydroxyapatite crystals (Avramenko et al., 2024). According to (Rossi et al., 2007), the amorphous form can transform and be identified as hydroxyapatite crystals when the sample is dried at a temperature of 37. The rhombohedral form was identified as calcite crystals (Baiq et al., 2020), whereas the amorphous and porous spherical forms were identified as brushite crystals (Gowthaman et al., 2021). The XRD and SEM results showed that the precipitation process of calcium phosphate biocement into sandy soil can produce hydroxyapatite minerals formed from the hydrolysis reaction of urea with the utilization of biocatalysts from soybean.
Overall, the results of the study show a positive impact on improving sandy soil and have the potential to be applied on a larger scale. However, there are several things that need to be considered and pose challenges in applying the results of this research, including the need to evaluate the distribution of mineral crystals formed in each layer to determine their distribution. Additionally, an evaluation of the research results in relation to environmental factors is required, particularly the temperature during the curing process to obtain more stable hydroxyapatite crystals with a high degree of crystallinity. Finally, experiments on other soil types are needed to compare the effectiveness of the results.
4. Conclusion
The conclusions based on the research results are written in point form as follows:
-
The concentrations of BM and soybeans significantly affected the formation of precipitated crystals in the calcium phosphate biocement solution. The higher the concentration of soybeans added, the more precipitated crystals were formed, so that the actual mass of precipitation minerals increased, except at a BM concentration of 0.5 mol/L. The optimal mixing of the solution was achieved in 18 min. The optimal mixing reaction produced stable ionic bonds, resulting in the formation of more precipitated crystals.
-
The mineral composition, namely hydroxyapatite, calcite, and brushite, was determined using XRD analysis. The percentage of hydroxyapatite minerals was the most dominant in the calcium phosphate biocement solution and became a secondary mineral in the treated soil samples after quartz; however, the phase formed had a degree of crystallinity that was not too high. The morphology of the hydroxyapatite crystals formed, based on the SEM analysis, was hexagonal, needle-like, and amorphous with a hollow surface. The presence of hydroxyapatite crystals as one of the calcium phosphate mineral groups proves the effectiveness of soybeans as a biocatalyst for the hydrolysis of urea in a calcium phosphate biocement solution.
-
The concentration was BM 0.4 mol/L and soybean (50 g/L) became the optimum composition capable of producing the highest crystalline mineral mass parameter. The shear strength parameters were then tested, which produced a cohesion value of 16.13 kPa, an internal friction angle of 18.49, and a shear stress of 34.16 kPa with a normal stress of 5.21 kPa at a curing time of 28 d.
-
The result of the research indicates that the utilization of soybean as an alternative enzyme urease in calcium phosphate-based bio cementation techniques has succeeded in increasing the shear strength of sandy soil. This method has great potential for larger applications; however, further research is still needed, such as the evaluation of mineral crystal distribution, environmental factors, durability testing, and experiments on other soil types.
List of symbols and abbreviations
c Cohesion (kPa)
e Actual pore number
emax Maximum pore number
emin Minimum pore number
kPa kilopascal
pH Potential of hydrogen
BM Bone meal
Ca Calcium
Ca2+ Calcium ion
Ca3(PO4)2 Calcium phosphate
CaCO3 Calcium carbonate
Cc Gradation coefficient
CPC Calcium phosphate compound
Cu Uniformity coefficient
D10 Effective grain diameter
D30 Grain diameter at 30% finer
D60 Grain diameter at 60% finer
DCM Deep cement mixing
DW Distilled water
EICP Enzyme induced calcium carbonate precipitation
GPa gigapascal
Gs Particle Specific Gravity
H+ Hydrogen ion
MICP Microbial induced calcite precipitation
OH- Hydroxide ion
P Phosphorus
PO43- Phosphate ion
R2 Coefficient of determination
SCU-CP Soybean crude urease calcite precipitation
SEM Scanning electron microscope
SW Well-graded sand
USCS Unified soil classification system
XRD X-Ray diffraction
θ Diffraction angle
𝜆 wavelength of X-Ray electromagnetic radiation
σ Normal stress (kPa)
τ Shear strength (kPa)
ϕ Internal friction angle
Acknowledgements
This research is funded by the Indonesian Endowment Fund for Education (LPDP) on behalf of the Indonesian Ministry of Higher Education, Science, and Technology and managed under the EQUITY Program (Contract No: 4297/B3/DT.03.08/2025 and No: 42011/IT3/HK.07.00-4/P/B/2025).
Declaration of use of generative artificial intelligence
Data availability
All data produced or examined in the current study are included in this article. In more detail, the required SEM and XRD data to reproduce these findings are available to download from: https://drive.google.com/drive/folders/1cpsfyjDuETzbLXOu9tn7lr00sce7fKJ8?usp=drive_link.
References
- Agusriyadin, Fahmiati, Faradissa, Armid, & Kadir, L. (2023). Studi sitoksisitas dan sifat mekanik nano hidroksiapatit dari cangkang kerang pokea (Batissa violacea var. celebensis, von Martens 1897). BioWallacea: Jurnal Penelitian Biologi, 10(2), 64-73. (in Indonesian).
-
Al-Bared, M.A.M., Marto, A., & Latifi, N. (2018). Utilization of recycled tiles and tyres in stabilization of soils and production of construction materials. KSCE Journal of Civil Engineering, 22(10), 3860-3874. https://doi.org/10.1007/s12205-018-1532-2
» https://doi.org/10.1007/s12205-018-1532-2 - ASTM D2487-11. (2011). Standard Practice for Classification of Soils for Engineering Purposes (Unified Soil Classification System) ASTM International, West Conshohocken, PA.
- ASTM D4253-16. (2016a). Standard Test Methods for Maximum Index Density and Unit Weight of Soils Using a Vibratory Table ASTM International, West Conshohocken, PA.
- ASTM D4254-16. (2016b). Standard Test Methods for Minimum Index Density and Unit Weight of Soils and Calculation of Relative Density ASTM International, West Conshohocken, PA.
-
Avramenko, M., Nakashima, K., & Kawasaki, S. (2022). State of the art review on engineering uses of calcium phosphate compounds: an eco-friendly approach for soil improvement. Materials (Basel), 15(19), 6878. PMid:36234219. https://doi.org/10.3390/ma15196878
» https://doi.org/10.3390/ma15196878 -
Avramenko, M., Nakashima, K., Takano, C., & Kawasaki, S. (2023). Soil improvement using calcium phosphate compounds as a novel sustainable method: A review. GEOMATE Journal, 24(101), 68-75. https://doi.org/10.21660/2023.101.g12142
» https://doi.org/10.21660/2023.101.g12142 -
Avramenko, M., Nakashima, K., Takano, C., & Kawasaki, S. (2024). Ecofriendly solidification of sand using microbially induced calcium phosphate precipitation. Scientific Reports, 14(1), 12412. PMid:38816387. https://doi.org/10.1038/s41598-024-63016-9
» https://doi.org/10.1038/s41598-024-63016-9 - Baiq, H.S., Yasuhara, H., Kinoshita, N., Putra, H., & Johan, E. (2020). Examination of calcite precipitation using plantderived urease enzyme for soil improvement. GEOMATE Journal, 19(72), 231-237.
-
Bibi, S., Oualha, M., Ashfaq, M.Y., Suleiman, M.T., & Zouari, N. (2018). Isolation, differentiation and biodiversity of ureolytic bacteria of Qatari soil and their potential in microbially induced calcite precipitation (MICP) for soil stabilization. RSC Advances, 8(11), 5854-5863. PMid:35539599. https://doi.org/10.1039/C7RA12758H
» https://doi.org/10.1039/C7RA12758H -
Broz, M.E., Cook, R.F., & Whitney, D.L. (2006). Microhardness, toughness, and modulus of Mohs scale minerals. The American Mineralogist, 91(1), 135-142. https://doi.org/10.2138/am.2006.1844
» https://doi.org/10.2138/am.2006.1844 - BSN SNI 1964:2008. (2008a). Cara Uji Berat Jenis Tanah Badan Standardisasi Nasional (in Indonesian).
- BSN SNI 3423:2008. (2008b). Cara Uji Analisis Ukuran Butir Tanah Badan Standardisasi Nasional (in Indonesian).
- BSN SNI 3420:2016. (2016). Metode uji kuat geser langsung tanah tidak terkonsolidasi dan tidak terdrainase Badan Standardisasi Nasional (in Indonesian).
- BSN SNI 8460:2017. (2017). Persyaratan Perancangan Geoteknik Badan Standardisasi Nasional (in Indonesian).
-
Bunaciu, A.A., Udriştioiu, E.G., & Aboul-Enein, H.Y. (2015). X-ray diffraction: instrumentation and applications. Critical Reviews in Analytical Chemistry, 45(4), 289-299. PMid:25831472. https://doi.org/10.1080/10408347.2014.949616
» https://doi.org/10.1080/10408347.2014.949616 -
Chaplin, E.J. (2022). Analisa biaya operasional alat berat pada pekerjaan timbunan. Jurnal Ilmiah Teknik Unida, 3(1), 42-48. https://doi.org/10.55616/jitu.v3i1.212
» https://doi.org/10.55616/jitu.v3i1.212 -
Chow, L.C. (2009). Next generation calcium phosphate-based biomaterials. Dental Materials Journal, 28(1), 1-10. PMid:19280963. https://doi.org/10.4012/dmj.28.1
» https://doi.org/10.4012/dmj.28.1 -
Combes, C., Cazalbou, S., & Rey, C. (2016). Apatite biominerals. Minerals (Basel), 6(2), 1-25. https://doi.org/10.3390/min6020034
» https://doi.org/10.3390/min6020034 - Darwis, H. (2017). Dasar-Dasar Teknik Perbaikan Tanah Pustaka AQ. (in Indonesian).
- Elliott, J.C., Wilson, R.M., & Dowker, S.E.P. (2002). Apatite structures. In H. T. Huang (Ed.), Advances in x-ray analysis (Vol. 45, pp. 172-181). International Centre for Diffraction Data.
- Faza, L.H., & Kurniadi, Y.N. (2016). Desain bangunan pelindung pantai sebagai penanggulangan abrasi di kawasan Pantai Ujung Jabung Provinsi Jambi. RekaRacana: Jurnal Teknil Sipil, 2(2), 47.
-
Gowthaman, S., Iki, T., Nakashima, K., Ebina, K., & Kawasaki, S. (2019). Feasibility study for slope soil stabilization by microbial induced carbonate precipitation (MICP) using indigenous bacteria isolated from cold subarctic region. SN Applied Sciences, 1, 1480. https://doi.org/10.1007/s42452-019-1508-y
» https://doi.org/10.1007/s42452-019-1508-y -
Gowthaman, S., Yamamoto, M., Nakashima, K., Ivanov, V., & Kawasaki, S. (2021). Calcium phosphate biocement using bone meal and acid urease: an eco-friendly approach for soil improvement. Journal of Cleaner Production, 319, 128782. https://doi.org/10.1016/j.jclepro.2021.128782
» https://doi.org/10.1016/j.jclepro.2021.128782 -
Ivanov, V., Stabnikov, V., & Kawasaki, S. (2019). Ecofriendly calcium phosphate and calcium bicarbonate biogrouts. Journal of Cleaner Production, 218, 328-334. https://doi.org/10.1016/j.jclepro.2019.01.315
» https://doi.org/10.1016/j.jclepro.2019.01.315 - Jafar, N. (2021). Analisis pengaruh waktu pengadukan terhadap penetralan asam menggunakan batugamping dengan metode ABCC. Journal of Geometry, 9(1), 65-72. (in Indonesian).
-
Kavazanjian, E., & Hamdan, N. (2015). Enzyme induced carbonate precipitation (EICP) columns for ground improvement. In Proceedings of the International Foundations Congress and Equipment Expo 2015 (pp. 2252-2261). San Antonio, Texas. https://doi.org/10.1061/9780784479087.209
» https://doi.org/10.1061/9780784479087.209 -
Lofianda, L., Putra, H., Erizal, S., & Yasuhara, H. (2021). Potentially of soybean as bio-catalyst in calcite precipitation methods for improving the strength of sandy soil. Civil Engineering and Architecture, 9(7), 2317-2325. https://doi.org/10.13189/cea.2021.090719
» https://doi.org/10.13189/cea.2021.090719 -
Makara, A., Kowalski, Z., & Saeid, A. (2015). Treatment of wastewater from production of meat-bone meal. Open Chemistry, 13(1), 000010151520150145. https://doi.org/10.1515/chem-2015-0145
» https://doi.org/10.1515/chem-2015-0145 -
Noviyanti, A.R., Haryono, H., Pandu, R., & Eddy, D.R. (2017). Cangkang telur ayam sebagai sumber kalsium dalam pembuatan hidroksiapatit untuk aplikasi graft tulang. Chimica et Natura Acta, 5(3), 107-111. https://doi.org/10.24198/cna.v5.n3.16057
» https://doi.org/10.24198/cna.v5.n3.16057 - Panguriseng, D. (2017). Dasar-Dasar Teknik Perbaikan Tanah Pustaka AQ (in Indonesian).
-
Pasero, M., Kampf, A.R., Ferraris, C., Pekov, I.V., Rakovan, J., & White, T.J. (2010). Nomenclature of the apatite supergroup minerals. European Journal of Mineralogy, 22(2), 163-179. https://doi.org/10.1127/0935-1221/2010/0022-2022
» https://doi.org/10.1127/0935-1221/2010/0022-2022 - Putra, H. (2019). Mekanika Tanah: Parameter dan Prosedur Pengujian Gre Publishing (in Indonesian).
- Putra, H., Erizal, Sutoyo, Simatupang, M., & Yanto, D. H. Y. (2021). Improvement of organic soil shear strength through calcite precipitation method using soybeans as bio-catalyst. Crystals, 11(9), 1044. https://doi.org/10.3390/cryst11091044.
-
Putra, H., Yasuhara, H., Erizal, Sutoyo, & Fauzan, M. (2020). Review of enzyme-induced calcite precipitation as a ground-improvement technique. Infrastructures, 5, 66. https://doi.org/10.3390/infrastructures5080066
» https://doi.org/10.3390/infrastructures5080066 -
Renjith, R., Robert, D., Setunge, S., Costa, S., & Mohajerani, A. (2021). Optimization of fly ash based soil stabilization using secondary admixtures for sustainable road construction. Journal of Cleaner Production, 294, 126264. https://doi.org/10.1016/j.jclepro.2021.126264
» https://doi.org/10.1016/j.jclepro.2021.126264 -
Rossi, A.M., Prado da Silva, M.H., Ramirez, A.J., Biggemann, D., Caraballo, M.M., Mascarenhas, Y.P., Eon, J.G., & Moure, G.T. (2007). Structural properties of hydroxyapatite with particle size less than 10 nanometers. Key Engineering Materials, 330, 255-258. https://doi.org/10.4028/www.scientific.net/KEM.330-332.255
» https://doi.org/10.4028/www.scientific.net/KEM.330-332.255 -
Rujikiatkamjorn, C., & Indraratna, B. (2015). Analytical solution for radial consolidation considering soil structure characteristics. Canadian Geotechnical Journal, 52(7), 947-960. https://doi.org/10.1139/cgj-2014-0277
» https://doi.org/10.1139/cgj-2014-0277 -
Rujitanapanich, S., Kumpapan, P., & Wanjanoi, P. (2014). Synthesis of hydroxyapatite from oyster shell via precipitation. Energy Procedia, 56, 112-117. https://doi.org/10.1016/j.egypro.2014.07.138
» https://doi.org/10.1016/j.egypro.2014.07.138 -
Sholihah, S. M., Muchtaranda, I. H., & Sulistyowati, T. (2019). Pengaruh variasi kedalaman muka air terhadap keruntuhan pondasi pada tanah pasir pantai dengan perkuatan anyaman bambu. Spektrum Sipil, 6(2), 97-105 (in Indonesian). https://doi.org/10.29303/spektrum.v6i1.147
» https://doi.org/10.29303/spektrum.v6i1.147 -
Sun, X., Miao, L., & Wu, L. (2020). Applicability and theoretical calculation of enzymatic calcium carbonate precipitation for sand improvement. Geomicrobiology Journal, 37(4), 389-399. https://doi.org/10.1080/01490451.2019.1710625
» https://doi.org/10.1080/01490451.2019.1710625 - Sunggono, K.H. (1984). Buku Teknik Sipil Jakarta: Nova (in Indonesian).
-
Toshima, T., Hamai, R., Tafu, M., Takemura, Y., Fujita, S., Chohji, T., Tanda, S., Li, S., & Qin, G.W. (2014). Morphology control of brushite prepared by aqueous solution synthesis. Journal of Asian Ceramic Societies, 2(1), 52-56. https://doi.org/10.1016/j.jascer.2014.01.004
» https://doi.org/10.1016/j.jascer.2014.01.004 -
Tung, M.S. (1998). Calcium phosphates: structure, composition, solubility, and stability. In Z. Amjad (Ed.), Calcium Phosphates in Biological and Industrial Systems (pp. 1-19). Boston: Springer. https://doi.org/10.1007/978-1-4615-5517-9_1
» https://doi.org/10.1007/978-1-4615-5517-9_1 -
Verma, H., Ray, A., Rai, R., Gupta, T., & Mehta, N. (2021). Ground improvement using chemical methods: A review. Heliyon, 7(7), e07678. PMid:34401562. https://doi.org/10.1016/j.heliyon.2021.e07678
» https://doi.org/10.1016/j.heliyon.2021.e07678 -
Viney, M., Mustoe, G.E., Dillhoff, T.A., & Link, P.K. (2017). The Bruneau Woodpile: a miocene phosphatized fossil wood locality in Southwestern Idaho, USA. Geosciences, 7(3), 82. https://doi.org/10.3390/geosciences7030082
» https://doi.org/10.3390/geosciences7030082 - Walewangko, B.Y., Sompie, O.B.A., & Sumampouw, J.E.R. (2020). Pengaruh penambahan fly ash dan tras pada tanah lempung terhadap nilai CBR. Jurnal Sipil Statik, 8(1), 71-76. [in Indonesian]
- Wang, S., Baaj, H., Zupko, S., & Smith, T. (2018). Field and lab assessment for cement-stabilized subgrade in Chatham, Ontario. In Proceedings of the The 2018 Conference of the Transportation Association of Canada (pp. 1-18). Saskatoon, SK, Canada.
-
Wardani, S.P.R., Muhrozi, M., Setiaji, A.R.A., & Riwu, D.R. (2018). Stabilisasi tanah ekspansive dengan menggunakan tanah putih untuk tanah dasar di daerah Godong Kabupaten Grobogan Jawa Tengah. Media Komunikasi Teknik Sipil, 24(1), 1-8. https://doi.org/10.14710/mkts.v24i1.16275
» https://doi.org/10.14710/mkts.v24i1.16275 -
Wattimena, J.D., & Ayal, M.R. (2018). Analisis perubahan garis pantai Desa Rutong Kota Ambon. Jurnal Teknik Sipil, 14(2), 115-136. https://doi.org/10.28932/jts.v14i2.1796
» https://doi.org/10.28932/jts.v14i2.1796 -
Zhang, Y., Hu, X., Wang, Y., & Jiang, N. (2023). A critical review of biomineralization in environmental geotechnics: applications, trends, and perspectives. Biogeotechnics, 1(1), 100003. https://doi.org/10.1016/j.bgtech.2023.100003
» https://doi.org/10.1016/j.bgtech.2023.100003
#
Corresponding author. E-mail address: heriansyahptr@apps.ipb.ac.idDeclaration of interest
Editor:


