Abstract
Introduction
Although bipolar disorder (BD) is traditionally included among mood disorders, some authors believe that changes in energy and motor activity, rather than mood changes, represent the true cardinal symptoms in mania and depression. The aim of the current study was to identify which cluster of the Hamilton Depression Rating Scale (HAM-D) better distinguishes between mania, depression and euthymia.
Method
A group of 106 patients with BD were followed for 13 years and repeatedly assessed with the HAM-D as well as with other clinical scales. To perform a comparison, HAM-D items were classified according to clinical criteria into three clusters: energy/activity symptoms, mood symptoms, and other symptoms. Item response theory (IRT) analyses were performed to provide a test information curve for those three clusters. We measured the prevalence of one cluster of symptoms over the other two throughout the latent trait.
Results
Considering HAM-D items individually, the IRT analysis revealed that there was a mixture of mood and energy/activity symptoms among the most discriminative items, both in depression and in euthymia. However, in mania, only energy/activity symptoms – i.e., general somatic symptoms and retardation – were among the most informative items. Considering the classification of items, both in depression as in mania, the energy/activity cluster was more informative than the mood cluster according to the IRT analysis.
Conclusion
Our data reinforce the view of hyperactivity and motor retardation as cardinal changes of mania and depression, respectively.
Bipolar disorder; Hamilton Depression Rating Scale; mood change; hyperactivity; factor analysis; item response theory
Resumo
Introdução
Embora o transtorno bipolar (TB) seja tradicionalmente incluído entre os transtornos do humor, alguns autores acreditam que as alterações na energia e na atividade motora, em vez das alterações no humor, representam os verdadeiros sintomas cardinais na mania e na depressão. O objetivo do presente estudo foi identificar qual grupo da Escala de Depressão de Hamilton (HAM-D) distingue melhor entre mania, depressão e eutimia.
Método
Um grupo de 106 pacientes com TB foram acompanhados por 13 anos e avaliados repetidamente com a HAM-D e com outras escalas clínicas. Para realizar uma comparação, os itens da HAM-D foram classificados de acordo com critérios clínicos em três grupos: sintomas de energia/atividade, sintomas de humor e outros sintomas. Foram realizadas análises da teoria da resposta ao item (TRI) para fornecer uma curva de informações de teste para esses três grupos. Medimos a prevalência de um grupo de sintomas em comparação aos outros dois através do traço latente.
Resultados
Considerando os itens da HAM-D individualmente, a análise da TRI revelou que havia uma mistura de sintomas de humor e de energia/atividade entre os itens mais discriminativos, tanto na depressão quanto na eutimia. No entanto, na mania, apenas os sintomas de energia/atividade – ou seja, sintomas somáticos gerais e retardo – estavam entre os itens mais informativos. Considerando a classificação dos itens, tanto na depressão quanto na mania, o grupo energia/atividade foi mais informativo que o grupo humor, de acordo com a análise da TRI.
Conclusão
Nossos dados reforçam a visão da hiperatividade e do retardo motor como as alterações cardinais de mania e depressão, respectivamente.
Transtorno bipolar; Escala de Depressão de Hamilton; alterações de humor; hiperatividade; análise fatorial; teoria da resposta ao item
Introduction
Although traditionally included among mood disorders, bipolar disorder (BD) is especially characterized by changes in energy and motor activity. Actigraphy studies have revealed that mania11. Minassian A, Henry BL, Geyer MA, Paulus MP, Young JW, Perry W. The quantitative assessment of motor activity in mania and schizophrenia. J Affect Disord. 2010;120:200-6.
2. Perry W, Minassian A, Henry B, Kincaid M, Young JW, Geyer MA. Quantifying over-activity in bipolar and schizophrenia patients in a human open field paradigm. Psychiatry Res. 2010;178:84-91.-33. Perry W, McIlwain M, Kloezeman K, Henry BL, Minassian A. Diagnosis and characterization of mania: Quantifying increased energy and activity in the human behavioral pattern monitor. Psychiatry Res. 2016;240:278-83. and depression44. Burton C, McKinstry B, Szentagotai TA, Serrano-Blanco A, Pagliari C, Wolters M. Activity monitoring in patients with depression: a systematic review. J Affect Disord. 2013;145:21-8.,55. Cantisani A, Stegmayer K, Bracht T, Federspiel A, Wiest R, Horn H, et al. Distinct resting-state perfusion patterns underlie psychomotor retardation in unipolar vs. bipolar depression. Acta Psychiatr Scand. 2016;134:329-38. are associated respectively with increased and decreased motor activity. Moreover, several factor analysis studies of manic symptoms led to the conclusion that hyperactivity was the core feature of mania.66. Akiskal HS, Hantouche EG, Bourgeois ML, Azorin JM, Sechter D, Allilaire JF, et al. Toward a refined phenomenology of mania: combining clinician-assessment and self-report in the French EPIMAN study. J Affect Disord. 2001;67:89-96.
7. Akiskal HS, Azorin JM, Hantouche EG. Proposed multidimensional structure of mania: beyond the euphoric-dysphoric dichotomy. J Affect Disord. 2003;73:7-18.-88. Bauer MS, Crits-Christoph P, Ball WA, Dewees E, McAllister T, Alahi P, Cacciola J, Whybrow PC. Independent assessment of manic and depressive symptoms by self-rating. Scale characteristics and implications for the study of mania. Arch Gen Psychiatry. 1991;48:807-12.
Comparing to the Diagnostic and Statistical Manual of Mental Disorders, 4th edition, Text Revision (DSM-IV-TR),99. American Psychiatric Association. Diagnostic and Statistical Manual of Mental Disorders, Fourth Edition, Text Revision (DSM-IV-TR). Arlington: American Psychiatric Publishing; 2000. the DSM-51010. American Psychiatric Association. Diagnostic and Statistical Manual of Mental Disorders, Fifth Edition (DSM-5). Arlington: American Psychiatric Publishing; 2013. brought an important change regarding the diagnostic criteria for manic episodes. In DSM-IV-TR, overactivity was included among the items for the diagnosis of mania, but this change could be absent. Now, in addition to elevated mood or irritability, increased energy or activity is mandatory. In contrast, motor or energy disturbance is not a cardinal symptom in neither version of the psychiatric classification manual for the diagnosis of major depressive episodes.
Item 2 of the Young Mania Rating Scale (YMRS)1111. Young RC, Biggs JT, Ziegler VE, Meyer DA. A rating scale for mania: reliability, validity and sensitivity. Br J Psychiatry. 1978;133:429-35. – the most used scale for manic symptoms – assesses increased motor activity/energy. However, in the Hamilton Depression Rating Scale (HAM-D)1212. Hamilton MA. A rating scale for depression. J Neurol Neurosurg Psychiatry. 1960;23:56-62. – the gold standard scale for depressive symptoms – energy and activity are not associated with a single item. In HAM-D, three items are linked to activity (8 - retardation, 9 - agitation, and 7 - work and activities),1313. Razavi N, Horn H, Koschorke P, Hugli S, Hofle O, Muller T, et al. Measuring motor activity in major depression: the association between the Hamilton Depression Rating Scale and actigraphy. Psychiatry Res. 2011;190:212-6. and at least one item is linked to energy (13 - general somatic symptoms).
Our objective was to identify which item cluster of the HAM-D is most informative about the occurrence and severity of BD clinical states. We intended to compare items related to mood symptoms to items related to energy/activity, in order to establish which item cluster is the most relevant one for the assessment of mania, depression, and euthymia.
Methods
Subjects
The sample was selected from an outpatient research unit at Instituto de Psiquiatria, Universidade Federal do Rio de Janeiro (IPUB-UFRJ), in Rio de Janeiro, Brazil. Patients had a diagnosis of BD type 1 or 2 according DSM-IV-TR criteria. They had presented at least one manic episode, one depressive episode and one euthymic phase during the follow-up period, from November 2002 to November 2015 (inclusion criteria). Not all the patients participated in the study at the same time, and they were not necessarily assessed during the entire period of 13 years. The only exclusion criterion was refusal to participate in the study. All patients were 18 years old or older and signed an informed consent form. The local ethics committee approved the project.
Assessment
Patients were administered the Structured Clinical Interview for DSM-IV (SCID)1414. Del-Ben CM, Vilela JAA, Crippa JAS, Hallak JEC, Labate CM, Zuardi AW. Confiabilidade da “Entrevista Clínica Estruturada para o DSM-IV - Versão Clínica” traduzida para o português. Rev Bras Psiquiatr. 2001;23:156-9. for the evaluation of the psychiatric diagnosis. Each patient was repeatedly assessed with the YMRS,1111. Young RC, Biggs JT, Ziegler VE, Meyer DA. A rating scale for mania: reliability, validity and sensitivity. Br J Psychiatry. 1978;133:429-35. the HAM-D,1212. Hamilton MA. A rating scale for depression. J Neurol Neurosurg Psychiatry. 1960;23:56-62. and the Clinical Global Impressions Scale for use in bipolar illness (CGI-BP).1515. Spearing MK, Post RM, Leverich GS, Brandt D, Nolen W. Modification of the Clinical Global Impressions (CGI) Scale for use in bipolar illness (BP): the CGI-BP. Psychiatry Res. 1997;73:159-71. Only three evaluations were considered for data analysis: the one regarding the most severe manic episode, the one regarding the most severe depressive episode, and the one regarding the least symptomatic period of euthymia. We start from the premise that the most serious episodes, i.e., the ones with the highest scores, would be the most representative of mania and depression. This premise followed a criterion of convenience. The three evaluations could have been performed any time during the 13-year follow-up period. DSM-IV-TR criteria were applied for the diagnosis of manic and depressive episodes and euthymia. CGI-BP scores were used as the criterion of severity. In cases of draw, YMRS and HAM-D total scores were considered, i.e., if two manic episodes had the same CGI-BP score, the episode with the highest YMRS score was chosen. Similarly, if two depressive episodes had the same CGI-BP score, the episode with the highest HAM-D score was chosen.
To perform a comparison between energy/activity and mood symptoms assessed by the HAM-D, the items of the scale were classified into three clusters, according to personal clinical criteria defined by the first author: mood, energy/activity and other symptoms. The mood symptom cluster included changes related not only to sadness but also to anxiety: depressed mood, feelings of guilt, suicide, psychic anxiety, somatic anxiety, and hypochondriasis. Hypochondriasis was included in this symptom cluster because it is especially related to worry and anxiety. Work and activities, retardation, agitation, general somatic symptoms, and genital symptoms were included in the energy/activity symptom cluster. General somatic symptoms and genital symptoms were considered energy/activity symptoms because “loss of energy and fatigability” and “loss of libido” are rated in these items, respectively. Finally, the remaining items were classified as “other symptoms,” namely, insomnia (three items), gastro-intestinal somatic symptoms, loss of weight and insight.
Statistical analyses
In descriptive statistics, the stage of disease in each patient was considered as reference: mania, euthymia, and depression. Mean age and standard deviation (SD), and total scores of the scales were calculated for each stage. Item response theory (IRT) analyses were conducted to understand the levels of discrimination and information of symptoms in relation to levels of severity in each stage. For that, depressive, euthymic, and manic stages were equated together through the one-step method1616. Smith RM, Kramer GA. A comparison of two methods of test equating in the Rasch model. Educ Psychol Meas. 1992;52:835-46. as a single calibrated database. Multi-group confirmatory factor analysis (MGCFA)1717. Fisher R. Testing measurement invariance across groups: applications in cross-cultural research. Int J Psychol Res. 2011;3:111-21. was performed to ensure the use of the same factorial structure across the different disease stages, as well as to allow equating. The unidimensional structure of the HAM-D was tested, because IRT analyses pointed to one dimension among items.
Incremental fit index (Tucker-Lewis index [TLI]), parsimony index (Parsimony goodness of fit index [PGFI]), null-hypothesis test chi-square (χ22. Perry W, Minassian A, Henry B, Kincaid M, Young JW, Geyer MA. Quantifying over-activity in bipolar and schizophrenia patients in a human open field paradigm. Psychiatry Res. 2010;178:84-91.) and its degree of freedom and significance, residual error index (root mean square of the residuals [RMSR]), and information criterion (Bayesian information criterion [BIC]) were adopted as reference to test levels of invariance between stages. Both TLI and PGFI were expected to present values <0.90, whereas RMSR, <0.10, as recommended by Kenny1818. Kenny DA. Measuring model fit [Internet]. 2005 Nov 24 [cited 2019 Mar 27]. http://davidakenny.net/cm/fit.htm
http://davidakenny.net/cm/fit.htm...
; the model with the lowest BIC and lowest level of significance was considered the closest to the empirical data collected. Once the latent structure was guaranteed across clusters, the three clinical dimensions of symptomatology established based on our criteria (energy/activity symptoms, mood symptoms, and other symptoms) were analyzed.
IRT is a set of statistical models that assume logistic distribution of samples through a latent trait. In psychiatric research, IRT models are quite useful because they help researchers understand symptom profiles (item error and information/sample distribution) throughout levels of severity (latent trait) of a specific psychopathology.1919. Reise SP, Rodriguez A. Item response theory and the measurement of psychiatric constructs: some empirical and conceptual issues and challenges. Psychol Med. 2016;46:2025-39. In this study, the generalized partial credit model (GPCM),2020. Muraki E. A generalized partial credit model: application of an EM algorithm. Appl Psychol Meas. 1992;16:159-76. a two-parameter model for polytomous responses with different numbers of categories was adopted to analyze items and test discrimination, difficulty, and information.
GPCM discrimination index (a) reveals how much separation an item or cluster of items is able to establish between individuals supposed to show different results. For instance, suicidal ideation is extremely discriminating in depression. Thus, it markedly distinguishes patients with lower levels of depression from patients with higher levels of depression, whereas depressed mood is a common occurrence in depression as a whole. Therefore, depressed mood does not discriminate as much as suicidal ideation. Actually, depressed mood occurs in similar levels among all depressive patients.
The difficulty index (b) refers to the level of severity in a pathology: patients with acute symptoms of mania tend to show higher levels of theta, whereas patients with lower levels of mania tend to show lower levels of theta. The difficulty index reveals how much error is contained in a specific symptom or set of symptoms across all levels of severity. For example, a symptom may reveal a lot about the severity of mania when the manic state is moderate (θ≈0.1), but it may reveal little in a less severe state (θ≈-1.0). This means that whenever patients in mania have moderate symptomatology (θ≈0.1), a specific symptom prevails over all the other symptoms. In contrast, when patients in mania have mild symptoms, tending to euthymia (θ≈-1.0), the symptom is less informative than the other symptoms or may even be absent.
Discrimination (a), severity (b) and information were calculated for each item of the HAM-D for the three disease stages. Based on the clinical classification of symptoms of the above-mentioned scale, the information was summed to generate three information curves – energy/activity, mood and other symptoms – for the three stages. A total of 15 levels of theta (ranging from θ=-2.8 to θ=+2.8) were adopted and information regarding each level of theta was calculated. At last, three information curves were drawn in a Cartesian graph to depict information across dimensions and stages. The last analysis was performed as proposed by Cheniaux et al.2121. Cheniaux E, Filgueiras A, Silva RA, Silveira LA, Nunes AL, Landeira-Fernandez J. Increased energy/activity, not mood changes, is the core feature of mania. J Affect Disord. 2014;152-154:256-61.: the chi-square test was used to compare distribution and prevalence of a cluster of symptoms throughout the latent trait. One chi-square test was conducted for each episode (depression, euthymia and mania), comparing the three sets of symptoms: mood, energy/activity and other symptoms. A significant chi-square indicated biased distribution, i.e., that one cluster of symptoms is prevalent when compared with the other two, whereas a non-significant chi-square indicated no prevalence of a specific set. All analyses were conducted using R software with the following packages: LTM, mIRT and psych.
Results
Among the 243 patients attending the BD outpatient clinic, 106 were selected, because they had experienced at least one manic episode, one depressive episode and one euthymic period over the 13 years covered by the study. They were followed on average for 5.5 years (SD=3.1). Among the 106 participants, 74 were women (69.8%). In their last evaluation, the mean age (X) of the participants was 52.5 years (SD=11.7). Regarding the mean age upon the most severe depressive episode, statistics showed X=45.9 (SD=12.0); the mean age upon the most severe manic episode was X=45.8 (SD=12.4); and the mean age upon the least symptomatic period (euthymia) was X=44.4 (SD=12.1).
A total of 102 patients were classified as type 1, and four as type 2 BD. Mean age at the first episode of the disease was 24.2 years (SD=9.8). Total duration of the disease was, on average, 24.1 years (SD=12.6). Fifty-seven patients (53.8%) had been hospitalized at least once. Considering the 106 patients in the sample, the mean number of hospitalizations was 2.5 (SD=4.0). Thirty-four patients (32.1%) had attempted suicide at least once. Considering the 106 patients, the mean number of suicide attempts was 0.8 (SD=1.5).
HAM-D total scores for depressive episode were X=16.6 (SD=6.5), for euthymia X=3.7 (SD=3.1) and for manic episodes X=6.9 (SD=4.6). ANOVA for HAM-D total scores showed statistical differences between states (F2,307=197.85; p<0.01; Cohen’s f=0.74; λ=166.31; power=0.99) and post-hoc Bonferroni test showed significant differences (p<0.05) between depressive episodes and other states. Nevertheless, no statistical discrepancy was found between manic episodes and euthymia.
The invariance test conducted through MGCFA showed that metric invariance was the best solution to explain the covariance matrix of the one-factor structure in HAM-D, i.e., HAM-D was reliable to assess depression through different episodes. Table 1 reveals fit and error indexes found for the unidimensional model as well as invariance levels.
Multi-group confirmatory factor analysis of symptoms in the Hamilton Depression Rating Scale (HAM-D) for the unidimensional model
The GPCM could be performed because the unidimensional solution was acceptable, also showing good invariance across clusters. Table 2 depicts GPCM estimates discrimination (a) and difficulty (θ) for each one of the 18 items of HAM-D.
Results show that, in depressive states, the most discriminative item was HAM-D 7 (work and activities) for more severe forms of depression; in intermediate levels of depression, HAM-D 3 (suicide) was the best discriminator; and the best discriminator for lower levels of depression was HAM-D 9 (agitation). In euthymic states, no item clearly informed about lower levels of symptoms; in intermediate levels, HAM-D 7 (work and activities) discriminated more accurately patients with the most and least severe symptoms; and item HAM-D 2 (feelings of guilt) was the most discriminative item relatively to the most severe symptoms. In manic states, considering lower levels of symptoms, no item was informative; in intermediate levels of severity, the best item to discriminate patients was HAM-D 13 (somatic symptoms: general); finally, in more intense mania, HAM-D 8 (retardation: psychomotor) was the most informative item.
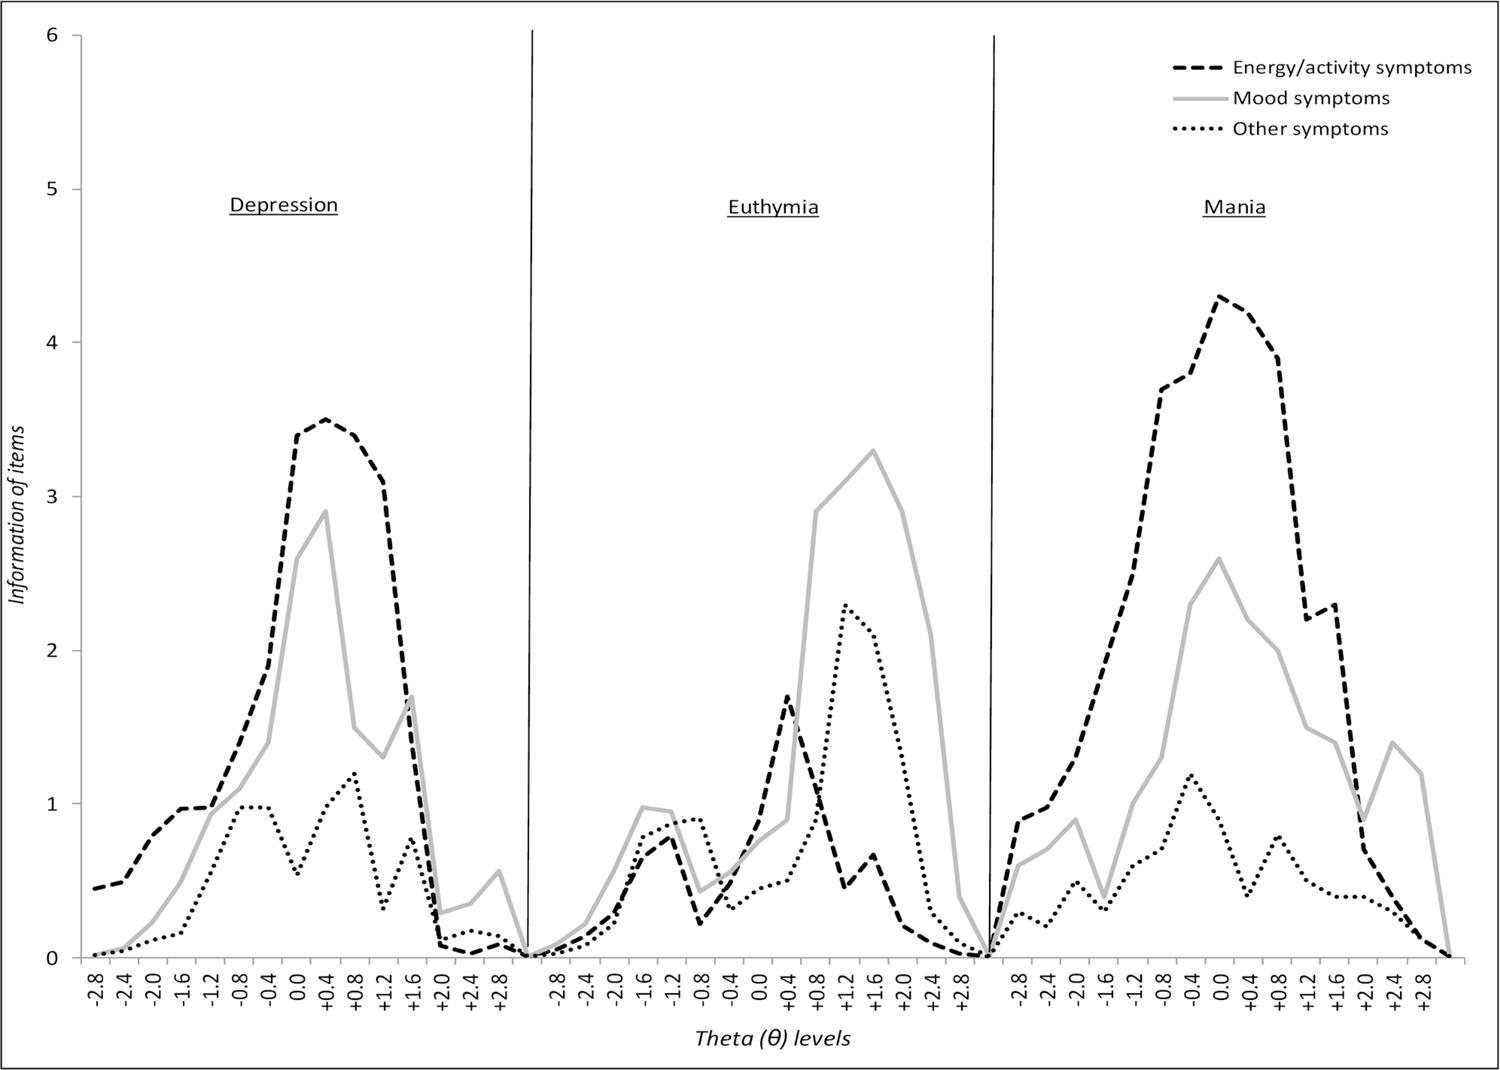
Figure 1 depicts summed information function curves for the three suggested clinical classification criteria: mood, energy/activity, and other symptoms. Curves were drawn together and put side-by-side according to clusters: depressed, euthymic and manic states. The higher the curve, the higher its level of information. High levels of information mean better discrimination across all levels of symptom severity, whereas lower levels of information mean poorer discrimination of symptoms.
Test information curves derived from the sum of item information functions of the three group symptoms: mood, energy/activity, and other symptoms. Theta and information were calculated separately for each clinical state: depression, mania, and euthymia. Afterwards, they were plotted together in the graph.
According to the test information functions, energy/activity symptoms are more essential during both depressed and manic states when compared to mood and other symptoms. This means that the curves with the highest peaks provide more information regarding one specific point in the latent trait, whereas the curves with the longest lengths and peaks above the other curves inform most regarding the severity of one stage. However, during euthymic states, the curves depicting energy/activity symptoms seem to fade, and mood symptoms become most informative. In less severe depressive states, mood symptoms inform more than energy/activity symptoms. This means that when a patient has less severe depression cycling to or from euthymia, he/she tends to have more mood symptoms than energy/activity symptoms or other. During euthymic states, those mood symptoms are prevalent across the whole level of severity. In higher levels of manic episodes, mood symptoms also appear to be the most discriminative cluster of symptoms.
The chi-square test revealed prevalence of energy symptoms in both depression and mania episodes (χ2=3.29, p<0.05, and χ2=4.20, p<0.05, respectively). During euthymic episodes, patients showed prevalence of mood symptoms (χ2=3.73; p<0.05). Among the 15 thetas measured in depressive episodes, 11 (73.3%) showed higher information for energy symptoms and 4 (27.7%) for mood symptoms. In euthymia, 13 of 15 (86.7%) theta positions showed prevalence of mood symptoms, 1 of 15 (6.7%) had prevalence of energy/activity symptoms, and in 1 of 15 (6.7%), other symptoms prevailed. Manic episodes presented 12 of 15 (80%) theta positions with higher information of energy/activity symptoms, whereas mood symptoms prevailed among 3 of 15 (21%) theta levels.
Discussion
In our study, 106 patients with BD were assessed with HAM-D in three different clinical states, i.e., mania, depression, and euthymia. Each patient was therefore their own control. We intended to investigate which category of symptoms – mood symptoms or energy/activity symptoms – provides most information about the occurrence and severity of BD clinical states. For that, we performed IRT analysis of the results of HAM-D application. The items of this scale were hence classified into three clusters, according to their clinical characteristics.
Considering HAM-D items individually, the IRT analysis revealed that there was a mixture of mood and energy/activity symptoms among the most discriminative items in both depression and euthymia. However, in mania, only energy/activity symptoms – i.e., general somatic symptoms and retardation – were among the most informative items.
Considering the classification of items, in both depression and mania, the energy/activity cluster was more informative than the mood cluster according to the IRT analysis.
In a previous study,2121. Cheniaux E, Filgueiras A, Silva RA, Silveira LA, Nunes AL, Landeira-Fernandez J. Increased energy/activity, not mood changes, is the core feature of mania. J Affect Disord. 2014;152-154:256-61. we had already found that energy/activity symptoms are more relevant than mood symptoms in BD. A sample of 118 hospitalized patients in mania were assessed with a six-item mania subscale of Schedule for Affective Disorders and Schizophrenia-Changed version (SADS-C).2222. Spitzer RL, Endicott J. Schedule for Affective Disorders and Schizophrenia: change version. New York: New York Psychiatric Institute; 1978. In a confirmatory factor analysis, increased energy was the item with the highest factor loadings. Moreover, an IRT analysis showed that symptoms related to energy were more informative about mania severity than those related to mood.
According to several factor analysis studies, hyperactivity is the core symptom of mania. For example, Bauer et al.88. Bauer MS, Crits-Christoph P, Ball WA, Dewees E, McAllister T, Alahi P, Cacciola J, Whybrow PC. Independent assessment of manic and depressive symptoms by self-rating. Scale characteristics and implications for the study of mania. Arch Gen Psychiatry. 1991;48:807-12. used the YMRS to assess a group of patients composed of individuals with BD, individuals with unipolar depression, and normal controls. Activation was the most important factor, overcoming the factors that represented mood changes. Akiskal et al.,66. Akiskal HS, Hantouche EG, Bourgeois ML, Azorin JM, Sechter D, Allilaire JF, et al. Toward a refined phenomenology of mania: combining clinician-assessment and self-report in the French EPIMAN study. J Affect Disord. 2001;67:89-96. using Beigel-Murphy Manic State Rating Scale (MSRS)2323. Beigel A, Murphy DL, Bunney WE. The Manic-State Rating Scale: scale construction, reliability and validity. Arch Gen Psychiatry. 1971;25:256-62. in a group of 104 inpatients in mania, also found the highest factor loadings for activation.
Actigraphy studies have revealed increased motor activity in mania. These studies were performed in a novel exploratory paradigm and used an ambulatory monitoring device. According to records, patients in mania presented higher activity levels in comparison with normal controls and patients with schizophrenia.11. Minassian A, Henry BL, Geyer MA, Paulus MP, Young JW, Perry W. The quantitative assessment of motor activity in mania and schizophrenia. J Affect Disord. 2010;120:200-6.
2. Perry W, Minassian A, Henry B, Kincaid M, Young JW, Geyer MA. Quantifying over-activity in bipolar and schizophrenia patients in a human open field paradigm. Psychiatry Res. 2010;178:84-91.-33. Perry W, McIlwain M, Kloezeman K, Henry BL, Minassian A. Diagnosis and characterization of mania: Quantifying increased energy and activity in the human behavioral pattern monitor. Psychiatry Res. 2016;240:278-83. Conversely, some actigraphy studies revealed decreased motor activity in depression,44. Burton C, McKinstry B, Szentagotai TA, Serrano-Blanco A, Pagliari C, Wolters M. Activity monitoring in patients with depression: a systematic review. J Affect Disord. 2013;145:21-8.,55. Cantisani A, Stegmayer K, Bracht T, Federspiel A, Wiest R, Horn H, et al. Distinct resting-state perfusion patterns underlie psychomotor retardation in unipolar vs. bipolar depression. Acta Psychiatr Scand. 2016;134:329-38. returning to normal when patients respond positively to antidepressant medication.2424. Raoux N, Benoit O, Dantchev N, Denise P, Franc B, Allilaire JF, et al. Circadian pattern of motor activity in major depressed patients undergoing antidepressant therapy: relationship between actigraphic measures and clinical course. Psychiatry Res. 1994;52:85-98.,2525. Volkers AC, Tulen JH, van den Broek WW, Bruijn JA, Passchier J, Pepplinkhuizen L. 24-hour motor activity after treatment with imipramine or fluvoxamine in major depressive disorder. Eur Neuropsychopharmacol. 2002;12:273-8. These data are coherent with several authors’ view of motor retardation as the cardinal feature of depression.2626. Akiskal HS, McKinney Jr WT. Overview of recent research in depression. Integration of ten conceptual models into a comprehensive clinical frame. Arch Gen Psychiatry. 1975;32:285-305.,2727. Dantchev N, Widlocher DJ. The measurement of retardation in depression. J Clin Psychiatry. 1998;59 Suppl 14:19-25. In bipolar and unipolar depressive patients, a positive correlation was found between motor activity and resting-state cerebral blood flow.55. Cantisani A, Stegmayer K, Bracht T, Federspiel A, Wiest R, Horn H, et al. Distinct resting-state perfusion patterns underlie psychomotor retardation in unipolar vs. bipolar depression. Acta Psychiatr Scand. 2016;134:329-38. Finally, in two studies involving non-clinical samples,2828. Brand S, Gerber M, Pühse U, Holsboer-Trachsler E. ‘Bright side’ and ‘dark side ‘hypomania are associated with differences in psychological functioning, sleep and physical activity in a non-clinical sample of young adults. J Affect Disord. 2011;131:68-78.-2929. Jahangard L, Rahmani A, Haghighi M, Ahmadpanah M, Sadeghi Bahmani D, Soltanian AR, et al. “Always look on the bright side of life!” - Higher hypomania scores are associated with higher mental toughness, increased physical activity, and lower symptoms of depression and lower sleep complaints. Front Psychol. 2017;8:2130. the use of self-report questionnaires assessing hypomania and other clinical aspects revealed an association between higher hypomania scores and increased physical activity.
In the description of mania and depression, Kraepelin3030. Kraepelin E. Ein Kurzes Lehrbuch der Psychiatrie. 4 Aufl. Leipzig: Barth; 1891. referred to changes in mood, thinking, and activity, without highlighting any of these elements specifically. However, modern psychiatric classifications have categorized both BD and major depressive disorder as mood disorders, ignoring the two other components of the kraepelinian triad. The studies that revealed the relevance of energy/activity disturbances in mania led to a highly significant modification of the diagnostic criteria for manic episodes in DSM-5.1010. American Psychiatric Association. Diagnostic and Statistical Manual of Mental Disorders, Fifth Edition (DSM-5). Arlington: American Psychiatric Publishing; 2013. However, because similar results of studies on depression did not influence the diagnostic criteria for major depressive episode, an asymmetry between the two syndromes of BD was created in the classification.
Results similar to the ones obtained in the present study concerning bipolar depression would not necessarily be found had the sample comprised patients with unipolar depression. It is possible that the decrease in energy observed in depressive episodes could help distinguish BD from depressive disorder, but this still needs to be adequately investigated.
A limitation of our study was the utilization of HAM-D in the assessment not only of depressive episodes, but also of manic episodes and euthymic states. However, this scale has been considered useful in the evaluation of patients in mania or mixed state, with prognostic value.3131. Gonzalez-Pinto A, Mosquera F, Reed C, Novick D, Barbeito S, Vega P, et al. Validity and reliability of the Hamilton Depression Rating Scale (5 items) for manic and mixed bipolar disorders. J Nerv Ment Dis. 2009;197:682-6. Conversely, the psychometric and conceptual qualities of the HAM-D have been disputed, even when applied in studies on depression.3232. Bagby RM, Ryder AG, Schuller DR, Marshall, MB. The Hamilton Depression Rating Scale: has the gold standard become a lead weight? Am J Psychiatry. 2004;161:2163-77. In this sense, a new study with similar sample and methodology, but using the YMRS,1111. Young RC, Biggs JT, Ziegler VE, Meyer DA. A rating scale for mania: reliability, validity and sensitivity. Br J Psychiatry. 1978;133:429-35. could complement our results, corroborating or not our conclusions.
Other limitations would be the long period needed to gather a sample with significant size, the exclusion of patients who did not present the three clinical states and the fact that assessment was limited to the most severe manic and depressive episodes and to the least symptomatic period of euthymia of each patient. Finally, the classification of HAM-D items was made according to clinical criteria conceived by the authors, and could therefore be subjected to criticism.
Conclusion
Our data reinforce the view of hyperactivity and motor retardation as cardinal changes of mania and depression, respectively.
References
-
1Minassian A, Henry BL, Geyer MA, Paulus MP, Young JW, Perry W. The quantitative assessment of motor activity in mania and schizophrenia. J Affect Disord. 2010;120:200-6.
-
2Perry W, Minassian A, Henry B, Kincaid M, Young JW, Geyer MA. Quantifying over-activity in bipolar and schizophrenia patients in a human open field paradigm. Psychiatry Res. 2010;178:84-91.
-
3Perry W, McIlwain M, Kloezeman K, Henry BL, Minassian A. Diagnosis and characterization of mania: Quantifying increased energy and activity in the human behavioral pattern monitor. Psychiatry Res. 2016;240:278-83.
-
4Burton C, McKinstry B, Szentagotai TA, Serrano-Blanco A, Pagliari C, Wolters M. Activity monitoring in patients with depression: a systematic review. J Affect Disord. 2013;145:21-8.
-
5Cantisani A, Stegmayer K, Bracht T, Federspiel A, Wiest R, Horn H, et al. Distinct resting-state perfusion patterns underlie psychomotor retardation in unipolar vs. bipolar depression. Acta Psychiatr Scand. 2016;134:329-38.
-
6Akiskal HS, Hantouche EG, Bourgeois ML, Azorin JM, Sechter D, Allilaire JF, et al. Toward a refined phenomenology of mania: combining clinician-assessment and self-report in the French EPIMAN study. J Affect Disord. 2001;67:89-96.
-
7Akiskal HS, Azorin JM, Hantouche EG. Proposed multidimensional structure of mania: beyond the euphoric-dysphoric dichotomy. J Affect Disord. 2003;73:7-18.
-
8Bauer MS, Crits-Christoph P, Ball WA, Dewees E, McAllister T, Alahi P, Cacciola J, Whybrow PC. Independent assessment of manic and depressive symptoms by self-rating. Scale characteristics and implications for the study of mania. Arch Gen Psychiatry. 1991;48:807-12.
-
9American Psychiatric Association. Diagnostic and Statistical Manual of Mental Disorders, Fourth Edition, Text Revision (DSM-IV-TR). Arlington: American Psychiatric Publishing; 2000.
-
10American Psychiatric Association. Diagnostic and Statistical Manual of Mental Disorders, Fifth Edition (DSM-5). Arlington: American Psychiatric Publishing; 2013.
-
11Young RC, Biggs JT, Ziegler VE, Meyer DA. A rating scale for mania: reliability, validity and sensitivity. Br J Psychiatry. 1978;133:429-35.
-
12Hamilton MA. A rating scale for depression. J Neurol Neurosurg Psychiatry. 1960;23:56-62.
-
13Razavi N, Horn H, Koschorke P, Hugli S, Hofle O, Muller T, et al. Measuring motor activity in major depression: the association between the Hamilton Depression Rating Scale and actigraphy. Psychiatry Res. 2011;190:212-6.
-
14Del-Ben CM, Vilela JAA, Crippa JAS, Hallak JEC, Labate CM, Zuardi AW. Confiabilidade da “Entrevista Clínica Estruturada para o DSM-IV - Versão Clínica” traduzida para o português. Rev Bras Psiquiatr. 2001;23:156-9.
-
15Spearing MK, Post RM, Leverich GS, Brandt D, Nolen W. Modification of the Clinical Global Impressions (CGI) Scale for use in bipolar illness (BP): the CGI-BP. Psychiatry Res. 1997;73:159-71.
-
16Smith RM, Kramer GA. A comparison of two methods of test equating in the Rasch model. Educ Psychol Meas. 1992;52:835-46.
-
17Fisher R. Testing measurement invariance across groups: applications in cross-cultural research. Int J Psychol Res. 2011;3:111-21.
-
18Kenny DA. Measuring model fit [Internet]. 2005 Nov 24 [cited 2019 Mar 27]. http://davidakenny.net/cm/fit.htm
» http://davidakenny.net/cm/fit.htm -
19Reise SP, Rodriguez A. Item response theory and the measurement of psychiatric constructs: some empirical and conceptual issues and challenges. Psychol Med. 2016;46:2025-39.
-
20Muraki E. A generalized partial credit model: application of an EM algorithm. Appl Psychol Meas. 1992;16:159-76.
-
21Cheniaux E, Filgueiras A, Silva RA, Silveira LA, Nunes AL, Landeira-Fernandez J. Increased energy/activity, not mood changes, is the core feature of mania. J Affect Disord. 2014;152-154:256-61.
-
22Spitzer RL, Endicott J. Schedule for Affective Disorders and Schizophrenia: change version. New York: New York Psychiatric Institute; 1978.
-
23Beigel A, Murphy DL, Bunney WE. The Manic-State Rating Scale: scale construction, reliability and validity. Arch Gen Psychiatry. 1971;25:256-62.
-
24Raoux N, Benoit O, Dantchev N, Denise P, Franc B, Allilaire JF, et al. Circadian pattern of motor activity in major depressed patients undergoing antidepressant therapy: relationship between actigraphic measures and clinical course. Psychiatry Res. 1994;52:85-98.
-
25Volkers AC, Tulen JH, van den Broek WW, Bruijn JA, Passchier J, Pepplinkhuizen L. 24-hour motor activity after treatment with imipramine or fluvoxamine in major depressive disorder. Eur Neuropsychopharmacol. 2002;12:273-8.
-
26Akiskal HS, McKinney Jr WT. Overview of recent research in depression. Integration of ten conceptual models into a comprehensive clinical frame. Arch Gen Psychiatry. 1975;32:285-305.
-
27Dantchev N, Widlocher DJ. The measurement of retardation in depression. J Clin Psychiatry. 1998;59 Suppl 14:19-25.
-
28Brand S, Gerber M, Pühse U, Holsboer-Trachsler E. ‘Bright side’ and ‘dark side ‘hypomania are associated with differences in psychological functioning, sleep and physical activity in a non-clinical sample of young adults. J Affect Disord. 2011;131:68-78.
-
29Jahangard L, Rahmani A, Haghighi M, Ahmadpanah M, Sadeghi Bahmani D, Soltanian AR, et al. “Always look on the bright side of life!” - Higher hypomania scores are associated with higher mental toughness, increased physical activity, and lower symptoms of depression and lower sleep complaints. Front Psychol. 2017;8:2130.
-
30Kraepelin E. Ein Kurzes Lehrbuch der Psychiatrie. 4 Aufl. Leipzig: Barth; 1891.
-
31Gonzalez-Pinto A, Mosquera F, Reed C, Novick D, Barbeito S, Vega P, et al. Validity and reliability of the Hamilton Depression Rating Scale (5 items) for manic and mixed bipolar disorders. J Nerv Ment Dis. 2009;197:682-6.
-
32Bagby RM, Ryder AG, Schuller DR, Marshall, MB. The Hamilton Depression Rating Scale: has the gold standard become a lead weight? Am J Psychiatry. 2004;161:2163-77.
Publication Dates
-
Publication in this collection
20 Jan 2020 -
Date of issue
Oct-Dec 2019
History
-
Received
21 Feb 2018 -
Accepted
22 Apr 2019