
 Digital phenotyping of Butia capitata fruits for genetic improvement: a case study
ABSTRACT
The analysis of genetic variability in germplasm banks is essential for the success of breeding programs. However, such analyses traditionally require time, labor, and high financial resources. With the growing accessibility of equipment and decreasing costs of image acquisition and processing, image phenotyping emerges as a promising tool for carrying out fast, precise, and highly accurate assessments. This study aimed to assess the efficiency of digital image-based phenotyping in characterizing the genetic diversity of Butia capitata genotypes contributing to breeding and conservation strategies. Digital image analysis was applied to assess fruits from 59 genotypes, estimating the following parameters: area, perimeter, average, minimum and maximum radius, largest diameter, eccentricity, and colorimetric indices (L, a*, and b*) – L* represents luminosity, and a* and b* indicate chromaticity. The regression analysis between measurements obtained with a digital caliper and those generated by image processing resulted in a high coefficient of determination (r2 = 0.861), confirming the methodology’s practicality and accuracy. The significant genetic diversity observed among genotypes highlights their potential for targeted selection in breeding programs. Genotypes GN55, GN3, GN25, GN1, GN10, GN59, GN43, GN18, and GN13 stood out for producing larger fruits.
Key words
genetic diversity; Butia capitata (Mart.) Becc.; image analysis
INTRODUCTION
The Brazilian cerrado is home to a vast diversity of endemic fruit species. Among them, Butia capitata (Mart.) Becc., belonging to the palm family (Arecaceae) (Lorenzi 2010), stands out. The fruit of this species is popularly known as coquinho-azedo, butiá, or sour butiá and holds great importance in regional cuisine (Weichert et al. 2023). The fruits are used for fresh consumption, in juices, sweets, jams, ice creams, and sweetened beverages. In addition, their leaves are used for crafting, covering rustic dwellings, making brooms, among other uses (Ventura et al. 2022).
In the regions where B. capitata occurs, excessive extractivism, combined with deforestation, has accelerated the erosion of genetic material, directly contributing to the classification of the species as vulnerable to extinction. This condition is recognized in the Ministry of the Environment Ordinance No. 148, which updates the Official List of Threatened Species of Brazilian Flora (Brasil 2022).
In general, there is a lack of information on the genotypes and phenotypes of species in the genus Butia. Through bibliometric analysis, Cidón et al. (2023) found that most of the available studies focus on investigating the physicochemical properties and nutritional aspects of the species. In addition, the authors emphasize the need for rapid and continuous research to more deeply characterize the available phenotypic variation, since the literature indicates that many populations are composed mainly of senescent individuals, with no occurrence of natural regeneration. This in turn may result in irreversible damage, making it urgent to adopt measures for the conservation of genetic resources.
Different methodologies have been used for phenotyping individuals, which can be evaluated through morphological and biochemical characterization, molecular markers, remote sensing, among other technologies. They can play a fundamental role in the assessment of genetic divergence, allowing the distinction between genotypes (Zhang et al. 2024). In fruit-bearing plants, morphometric analyses can provide valuable information about the species and become an important element in distinguishing different genetic materials, whether among individuals or populations of the same species (Larrañaga and Hormaza 2016).
This study aimed to assess the efficiency of digital image-based phenotyping in characterizing the genetic diversity of B. capitata genotypes contributing to breeding and conservation strategies
MATERIAL AND METHODS
Study area and germplasm collection
Fifty-nine individuals from a germplasm collection created in 2014 in Montes Claros, Minas Gerais, Brazil (latitude 16°40’S, longitude 43°50’W, and altitude 650 m), were compiled, originating from fruits collected in Bonito de Minas, Mirabela, and Montes Claros, municipalities located in the northern part of Minas Gerais state (Table 1). According to Köppen-Geiger’s climate classification, the region has an Aw climate, characterized as tropical savanna with a dry season in winter, average annual temperature of 21°C and average precipitation of 969 mm (Martins et al. 2018). Management practices included irrigation (4 mm every two days), monthly manual weeding, and organic fertilization with 20 L of cattle manure per plant.
Butia capitata (Mart.) Becc. genotypes collected in different locations of Minas Gerais (Bonito de Minas, Mirabela and Montes Claros), Brazil, and established in the germplasm bank in Montes Claros, MG, Brazil*.
Fruit collection and measurements
Twenty fruits per genotype were collected from January to February 2022. The sample size (20 fruits per genotype) was chosen to ensure a balance between statistical representativeness and practical feasibility for phenotypic assessments. In the laboratory, the fruits were counted and weighed on a semi-analytical electronic balance with a precision of 0,001 g. The fruit length (FL) was measured (longitudinal measurement of the fruit) using a digital caliper, with measurements in mm.
After the manual evaluation, the fruits from each plant were identified and photographed. To ensure quality and standardization, a portable and foldable light box with a light emitting diode (LED) ring was used to capture images measuring 80 × 80 × 80 cm (Fig. 1).

Diagram of the digital capture and processing of images of Butia capitata fruits from northern Minas Gerais, Brazil. (a) Structure assembled to obtain images containing the portable and foldable light box with a light emitting diode ring. (b) Image obtained by capturing using the color system camera was the C922 Pro Stream Webcam. (c) Fruit identification process. (d) Segmentation. (e) Image at the end of processing.
Image capture and analysis
The bottom surface was covered with blue paper, and a coin was used as a reference at one end. The fruits were placed in the center of the camera’s field of view, which was fixed at a height of 80 cm to avoid variations between images. The equipment used to capture images in the RGB color system was the C922 Pro Stream Webcam, Full HD, and the images were saved in JPEG format.
The colored (RGB) images were converted into binary images. For binarization, Otsu’s optimal thresholding method was used. Then, data on area, perimeter, average radius, minimum radius, maximum radius, largest diameter, eccentricity, and the L, a*, and b* system were extracted.
Color attributes were extracted using the EBImage and colorscience packages in the RGB system, and the data were converted into L* a* b* and LCh, in which the L* values correspond to brightness or lightness, ranging from 100 (white) to zero (black). The a* and b* coordinates indicate the hue and direction of color: -a* corresponds to the green direction and +a* to the red direction; -b* indicates the blue direction and +b* the yellow direction. From these values, the color hue (angle hº) was calculated, expressed in degrees by Eq. 1:
Statistical analysis
The data were subjected to descriptive statistics. Coefficients of variation (CV%; standard deviation / mean × 100) were calculated as a variation index. The correlations between characteristics were determined using Pearson’s correlation coefficient. The relationships between genotypes were investigated through principal component analysis (PCA). To better understand the variation patterns among the genotypes, a distance matrix generated from morphological data was used. Cluster analysis was applied to standardized data for hierarchical associations using the unweighted pair group method with arithmetic mean (UPGMA) method and Euclidean distance as a dissimilarity measure. UPGMA was chosen for its efficiency in hierarchical clustering, which allows the evaluation of quantitative and qualitative variables, both separately and together, and is widely used to analyze genetic diversity in palm trees (Galate et al. 2014, Magalhães et al. 2015, Nassau et al. 2020). The Euclidean distance provided a direct measure of dissimilarity for morphological traits. All analyses were performed using RStudio Version: 1.1.1335.
RESULTS AND DISCUSSION
In several crops, fruit color is one of the main attributes for commercialization, being influenced by the presence of compounds such as carotenoids, anthocyanins, chlorophylls, and betalains (Chitarra and Chitarra 2005). For B. capitata, the presence of sources of vitamin C, provitamin A, and bioactive compounds such as carotenoids and total phenolics is observed (Barbosa et al. 2021). High variation was observed for color-related characteristics in B. capitata fruits. Hue and saturation presented high coefficients of variation, 79.68 and 21.42, respectively (Table 2). This result indicates a wide diversity of color tones and intensities in the fruits, which may be related to different stages of ripening or significant genetic variations among individuals.
Descriptive statistics of the physical characteristics of fruits of different genotypes of Butia capitata (Mart.) Becc. from northern Minas Gerais, Brazil, evaluated from images.
It is worth noticing that, for any product, consumers are primarily attracted by appearance (Moser et al. 2011). In the case of fruits, color functions as an indicator of quality and vigor. In breeding programs, fruit color and flavor are often considered important phenotypic traits (Mori and Cipriani 2023). Selecting cultivars with interesting colors and personalized flavors is essential to meet market demands and increase product competitiveness.
Another characteristic that showed significant variation was eccentricity. This attribute refers to differences in fruit shape, as eccentricity approaching zero indicates a more perfectly round fruit. The eccentricity ranged from 0.76 to 0.25, with a coefficient of variation of 22.78%, confirming what was established by Mistura et al. (2015), who proposed at least four shapes as descriptors for the Butia genus.
For the other characteristics, a relative uniformity of the observed values was observed. In characteristics such as projection area and perimeter, for example, the observed values may indicate that the individuals analyzed may be consistent in their dimensional measurements, which is positive for visual quality standards, since more regular shapes and dimensions may be preferred by the consumer market.
Pearson’s correlation is used to measure the association between two variables, using two key concepts: association and linearity. The Pearson’s correlation coefficient can range from -1 to 1. These values determine the positive or negative direction of the relationship between the variables analyzed (Garson 2009).
According to Fig. 2, the images obtained from B. capitata fruits show very strong correlation indices between the biometric parameters of area, perimeter, and average radius of the accessions presented, and a moderate to very weak correlation for the other evaluated characteristics. Moura et al. (2010) observed positive and significant correlations between fruit diameter, fruit mass, pulp mass, and pyrene mass, suggesting that larger fruits in size and mass tend to have heavier pulp and pyrene. Generally, positive correlations between two traits indicate that improving one characteristic would lead to an improvement in the second one (Yucel et al. 2009).

Pearson’s correlation coefficient between 10 characteristics of fruits of different genotypes of Butia capitata (Mart.) Becc. from northern Minas Gerais, Brazil.
The PCA used to establish relationships between the accessions showed that 69.9% of the observed variations were explained by the first two components (Table 3). By applying PCA, many characteristics can be interpreted in the form of components, and each includes many correlated traits, making the analysis easier.
Correlation between the evaluated characteristics and the principal components of 10 characteristics of fruits of different genotypes of Butia capitata (Mart.) Becc. from northern Minas Gerais, Brazil.
In this study, the first component (PC1) was mainly correlated with average radius, area, maximum radius, minimum radius, perimeter, and the largest diameter, which explained 54.1% of the total variation. In PC2, which represented 15.82% of the total variation, the strongly correlated characteristics were eccentricity and brightness. Hue (a) and saturation (b) were strongly and negatively correlated with PC3 (13.5%).
The arrows attributed to each descriptor show the representativeness of the descriptors in the two components. The longer the arrow, the more representative the descriptors are, contributing more to the diversity of the evaluated accessions. The angle between the descriptors indicates their correlations–the smaller the angle, the stronger the correlation.
A scatter plot was created based on PC1 and PC2 to illustrate the relationship between the genotypes in terms of morphological similarities (Fig. 3). Moving from negative to positive PC1 values, the genotypes show gradual increases in the evaluated traits, except for eccentricity, which is negatively correlated with PC1. Therefore, the further to the right a genotype is on the graph, the higher the values for area, perimeter, radii, and axes.

Two-dimensional scatter diagram for CP1 and CP2 (69.99% of the total variance) based on computational analysis of images from data of Butia capitata (Mart.) Becc. fruits from northern Minas Gerais, Brazil.
The negative correlation between traits and PC2 indicates that the higher the PC2 value, the lower the values for eccentricity and hue. Thus, genotypes in the upper part of the graph show progressively lower values for these two characteristics.
It can be deduced that genotype GN14, whose parent is from the municipality of Bonito de Minas, has fruits with a more rounded shape, and together with GN38, originating from a parent from Montes Claros, they are the smallest among the 59 genotypes evaluated.
Relationships revealed by the PCA method may correspond to a genetic link between loci controlling traits or a pleiotropic effect (Iezzoni and Pritts 1991). The breeding objectives will guide the selection of individuals based on the characteristics of interest.
The dendrogram revealed four groups (Fig. 4). The first group (I) included 24 individuals, the second group (II) had 25, the third group (III) nine, and the fourth group had only one individual. Grouping based on multiple characteristics can be a reliable method for determining the similarities and distances between accessions, providing valuable insights for evaluations in breeding programs (White et al. 2012).

Unweighted pair group method with arithmetic mean (UPGMA) cluster analysis using Euclidean distances, based on Butia capitata (Mart.) Becc. germplasm from northern Minas Gerais, Brazil.
Groups I, II, and III included individuals from all three locations where the fruits originated: Mirabela, Bonito de Minas, and Montes Claros. The high diversity and similarity observed among plants from different municipalities, both between and within the groups, can be attributed to the specific characteristics of B. capitata. The domestication process of the species is still in its early stages, and its propagation occurs exclusively through seeds, suggesting significant variability in phenotypic traits (Broschat 1998, Martins et al., 2012).
Additionally, the dispersal of fruits by animals may promote the appearance of seeds in different locations, potentially resulting in populations that share similar alleles. This dynamic may be also supported by human-driven extractivism (Souza et al. 2023). Another factor may be related to its reproductive system. The species is monoecious and exhibits protandrous dichogamy, mechanisms that promote gene flow between different individuals (MercadanteSimões et al. 2006).
The genetic variability observed is also evidenced by the formation of Group IV, composed exclusively of the genotype GN38. This genotype stood out for exhibiting the smallest dimensions for most of the traits evaluated, as well as fruits with a more rounded morphology compared to the other materials analyzed.
Each group formed indicates that the sub-samples associated with it share similar characteristics, while also showing differences compared to other groups, highlighting the dissimilarity between them. It is important to note that even within the same group, variations can exist since, although the genotypes are similar, some of their traits are unique. The results presented demonstrate that the clustering method based on the Euclidean distance matrix is effective in classifying the sub-samples.
Several authors, using similarity and dissimilarity measures to determine the genetic divergence of plants, have reaffirmed the effectiveness of dendrograms in differentiating groups of individuals (Kloster et al. 2011). In studying Butia eriospatha, Rossato et al. (2007) found similarity between individuals from different populations.
Significant morphological diversity was observed in the B. capitata genotypes from the northern region of Minas Gerais. High levels of dissimilarity indicate considerable variability in fruit production within the germplasm. Morphological diversity is crucial for genetic improvement programs, as it broadens selection options and enhances cultivar improvements. Exploring the potential within the B. capitata germplasm will not only contribute to the preservation of the species but also enable the development of improved cultivars with agronomic applications.
In the context of a plant breeding program, analyzing genetic diversity is essential as it provides breeders with a clear understanding of the genetic variation within populations (Madeira et al. 2024). This information allows the identification of highly contrasting parents, facilitating more efficient selection. With this, crossbreeding can be strategically planned, maximizing genetic gains and optimizing the development of cultivars (Farias Neto et al. 2013).
Regarding the colorimetric analysis, using the LCh system and determining the hue angle, it was observed that the average coloration was located within the first quadrant, showing colors between red and yellow. Similar results were found by Nunes et al. (2010), who evaluated the skin color of Butia odorata fruits using a colorimeter. In the Lab system, genotype GN54 showed negative a* values, indicating a green direction, which may be related to fruit maturation. The other fruits showed color in the yellow direction.
Image-based phenotyping has emerged as a promising tool to support genetic improvement programs, excelling in its ability to perform precise, high-throughput, and non-destructive analyses. Recent studies highlight its applicability across various agricultural crops. For instance, the use of machine learning to discriminate olive cultivars (Olea europaea L. subsp. europaea var. europaea) demonstrated high accuracy by integrating advanced algorithms with phenotypic data from fruits, leaves, and endocarps, providing valuable information for breeding programs (Blazakis et al. 2024).
Similarly, phenotyping tomato fruits (Solanum lycopersicum) to estimate fresh weight proved to be efficient in optimizing the genotypic selection process, reducing manual effort and increasing data reliability (Farid et al. 2024). Furthermore, technological advancements have driven the development of computational tools to assist phenomics studies. A notable example is ShinyFruit, an R-based software designed for the analysis of phenotypic traits such as size, shape, and fruit color. This software demonstrated a strong correlation between automated measurements and manual methods, proving its effectiveness in distinguishing different genetic materials of blackberries (Chizk et al. 2023).
These research findings underscore the importance of digital image phenotyping as a versatile and indispensable tool in modern science, facilitating the modernization and enhancement of agricultural production on a global scale.
Strategies need to be developed in future research to expand the application of phenotyping, considering a wide diversity of species and environmental conditions. It is essential to investigate how different biotic and abiotic factors affect the phenotypic characteristics captured by images. Furthermore, morphological characteristics, such as irregular shapes in different species, may require adjustments to image segmentation and analysis algorithms. This highlights the need to develop more robust and adaptable models to ensure accuracy and applicability in diverse scenarios.
CONCLUSION
Fruit phenotyping based on digital images of B. capitata (Mart.) Becc. is an informative and efficient technique for genetic improvement programs.
Computational image analysis has proven to be an effective tool for studying diversity and rapidly measuring morphometric parameters.
Genetic variability among accessions indicates potential for improvement, with emphasis on GN55, GN3, GN25, GN1, GN10, GN59, GN43, GN18 and GN13, which produce larger fruits.
ACKNOWLEDGMENTS
Not applicable.
DATA AVAILABILITY STATEMENT
The data that support the findings of this study are available on request from the corresponding author.
-
How to cite:
Souza, P. N. S., Silva, C. M., Jesus, J. V. M., Abreu, M. C. R., Ribeiro, C. H. M., Azevedo, A. M., Lopes, P. S. N., Santos, H. O. and Taniguchi, M. (2025). Digital phenotyping of Butia capitata fruits for genetic improvement: a case study. Bragantia, 84, e20240241. https://doi.org/10.1590/1678-4499.20240241
-
FUNDING
Fundação de Amparo à Pesquisa do Estado de Minas GeraisGrant Nos.: APQ-04398-23 / APQ-04056-22Coordenação de Aperfeicoamento de Pessoal de Nível SuperiorFinance code 001Conselho Nacional de Desenvolvimento Científico e TecnológicoGrant No: 307682/2025-0
REFERENCES
-
Barbosa, M. C. A., Rosa, Q. S., Cardoso, L. M., Gomides, A. F. F., Barbosa, L. C. A., Sant’anna, H. M. P., Pinheiro, S. S., Peluzio, M. C. G., Teixeira, R. D. B. L. and Valente, M. A. S. (2021). Composition proximate, bioactive compounds and antioxidant capacity of Butia capitata Food Science Technology, 41, 763-768. https://doi.org/10.1590/fst.26720
» https://doi.org/10.1590/fst.26720 -
Blazakis, K. N., Stupichev, D., Kosma, M., El Chami, M. A. H., Apodiakou, A., Kostelenos, G. and Kalaitzis, P. (2024). Discrimination of 14 olive cultivars using morphological analysis and machine learning algorithms. Frontiers in Plant Science, 15, 1441737. https://doi.org/10.3389/fpls.2024.1441737
» https://doi.org/10.3389/fpls.2024.1441737 - Brasil (2022). Ministério do Meio Ambiente. Portaria MMA nº 148, de 7 de junho de 2022. Atualiza a Lista Oficial de Espécies da Flora Brasileira Ameaçadas de Extinção. Diário Oficial da União, seção 1, 112-114.
-
Broschat, T. K. (1998). Endocarp removal enhances Butia capitata (Mart.) Becc. (pindo palm) seed germination. HortTechnology, 8, 586-587. https://doi.org/10.21273/HORTTECH.8.4.586
» https://doi.org/10.21273/HORTTECH.8.4.586 - Chitarra, M. I. F. and Chitarra, A. B. (2005). Pós-colheita de frutas e hortaliças: fisiologia e manuseio. 2. ed. Lavras: Universidade Federal de Lavras.
-
Chizk, T. M., Lee, J. A., Clark, J. R. and Worthington, M. L. (2023). ShinyFruit: interactive fruit phenotyping software and its application in blackberry. Frontiers in Plant Science, 14, 1182819. https://doi.org/10.3389/fpls.2023.1182819
» https://doi.org/10.3389/fpls.2023.1182819 -
Cidón, C. F., Zolet, A. C. T., Bajay, M. M., Zucchi, M. M. and Konzen, E. R. (2023). Phenotypic and molecular basis for genetic variation in jelly palms (Butia sp.): where are we now and where are we headed to? Genetics and Molecular Biology, 46, e20230145. https://doi.org/10.1590/1678-4685-GMB-2023-0145
» https://doi.org/10.1590/1678-4685-GMB-2023-0145 -
Farias Neto, J. T., Clement, C. R. and Resende, M. D. V. (2013). Estimativas de parâmetros genéticos e ganho de seleção para produção de frutos em progênies de polinização aberta de pupunheira no estado do Pará, Brasil. Bragantia, 72, 122-126. https://doi.org/10.1590/S0006-87052013000200002
» https://doi.org/10.1590/S0006-87052013000200002 -
Farid, M., Anshori, M. F., Rossi, R., Haring, F., Mantja, K., Dirpan, A., Larekeng, S. T., Mustafa, M., Adnan, A., Tahara, S. A. M., Amier, N., Amal, M. A. I. and Sakinah, A. I. (2024). Combining image-based phenotyping and multivariate analysis to estimate fruit fresh weight in segregation lines of lowland tomatoes. Agronomy, 14, 338. https://doi.org/10.3390/agronomy14020338
» https://doi.org/10.3390/agronomy14020338 -
Galate, R. S., Costa, M. M. G., Gaia, J. M. D. and Costa M. S. S. (2014). Distância fenotípica entre matrizes de açaizeiro (Euterpe oleracea Mart.) procedentes do nordeste do Pará. Semina: Ciências Agrárias, 35, 1667-1682. https://doi.org/10.5433/1679-0359.2014v35n4p1667
» https://doi.org/10.5433/1679-0359.2014v35n4p1667 -
Garson, G. D. Statnotes: Topics in Multivariate Analysis. 2009. Available at: https://www.scirp.org/reference/referencespapers?referenceid=1199249 Accessed on: Mar. 5, 2024.
» https://www.scirp.org/reference/referencespapers?referenceid=1199249 -
Iezzoni, A. F. and Pritts, M. P. (1991). Applications of principal component analysis to horticultural research. HortScience, 26, 334-338. https://doi.org/10.21273/HORTSCI.26.4.334
» https://doi.org/10.21273/HORTSCI.26.4.334 -
Kloster, G. S., Barelli, M. A. A., Silva, C. R., Neves, L. G., Paiva Sobrinho, S. and Luz, P. B. (2011). Análise da divergência genética através de caracteres morfológicos em cultivares de feijoeiro. Revista Brasileira de Ciências Agrárias, 6, 452-459. https://doi.org/10.5039/agraria.v6i3a1140
» https://doi.org/10.5039/agraria.v6i3a1140 -
Larrañaga, N. and Hormaza, J. I. (2016). Advances in genetic diversity analysis in fruit tree crops. In U. Lüttge, F. Cánovas and R. Matyssek (Eds.) Progress in Botany 77 (p. 245-264). Cham: Springer. https://doi.org/10.1007/978-3-319-25688-7_8
» https://doi.org/10.1007/978-3-319-25688-7_8 - Lorenzi, H. (2010). Flora brasileira: Arecaceae (palmeiras). Nova Odessa: Instituto Plantarum.
-
Madeira, D. D. C., Motoike, S. Y., Simiqueli, G. F., Kuki, K. N., Goulart, S. M., Rigolon, T. C. B., Nogueira, P. T. S., Castro, A. S. and Couto, E. G. O. (2024). Phenotypic characterization and genetic diversity of macaúba (Acrocomia aculeata) accessions based on oil atributes and fruit biometrics. Genetic Resources and Crop Evolution, 71, 3433-3451. https://doi.org/10.1007/s10722-024-01856-0
» https://doi.org/10.1007/s10722-024-01856-0 -
Magalhães, H. M., Pinheiro, L. R., Silveira, F. A., Menezes, M., Santos, J. B., Resende, L. V. and Pasqual, M. (2015). Genetic diversity of endangered populations of Butia capitata: Implications for conservation. African Journal of Biotechnology, 14, 888-900. https://doi.org/10.5897/AJB2014.14261
» https://doi.org/10.5897/AJB2014.14261 -
Martins, F. B., Gabriela, G., Santos, D. F. and Reboita, M. S. (2018). Classificação climática de Köppen e de Thornthwaite para Minas Gerais: cenário atual e projeções futuras. Revista Brasileira de Climatologia, 1, 129-156. https://doi.org/10.5380/abclima.v1i0.60896
» https://doi.org/10.5380/abclima.v1i0.60896 -
Martins, R. C., Filgueiras, T. S. and Albuquerque, U. P. (2012). Ethnobotany of Mauritia flexuosa (Arecaceae) in a Maroon Community in Central Brazil. Economic Botany, 66, 91-98. https://doi.org/10.1007/s12231-011-9182-z
» https://doi.org/10.1007/s12231-011-9182-z - MercadanteSimões, M. O., Fonseca, R. S., Ribeiro, L. M. and Nunes, Y. R. F. (2006). Biologia reprodutiva de Butia capitata (Mart.) Beccari (Arecaceae) em uma área de cerrado no norte de Minas Gerais. Revista Unimontes Científica, 8, 143-150.
-
Mistura, C. C., Barbieri, R. L., Castro, M. C., Padulosi, S. and Alercia, A. (2015). Descriptors for Butia [Butia odorata (Barb. Rodr.) Noblick]. Bioversity International, 51. https://doi.org/10.13140/RG.2.1.1181.5768
» https://doi.org/10.13140/RG.2.1.1181.5768 -
Mori, G. and Cipriani, G. (2023). Market-Assisted selection in breeding for fruit trait improvement: A review. International Journal of Molecular Sciences, 24, 8984. https://doi.org/10.3390/ijms24108984
» https://doi.org/10.3390/ijms24108984 -
Moser, R., Raffaelli, R. and Thilmany-McFadden, D. (2011). Consumer preferences for fruit and vegetables with credence-based attributes: a review. International Food and Agribusiness Management Review, 14, 121-142. https://doi.org/10.22004/ag.econ.103990
» https://doi.org/10.22004/ag.econ.103990 -
Moura, R. C., Lopes, P. S. N., Brandão Junior, D. S., Gomes, J. G. and Perreira, M. B. (2010). Fruit and seed biometry of Butia capitata (Mart.) Beccari (Arecaceae) in the natural vegetation of the North of Minas Gerais, Brazil. Biota Neotropica, 10, 415-419. https://doi.org/10.1590/S1676-06032010000200040
» https://doi.org/10.1590/S1676-06032010000200040 -
Nassau, B. R. R. M., Mata, L. R., de Carvalho M. M., Azevedo, V. C. R., Cavallari, M. M., Brandão, M. M. and Pimenta, M. A. S. (2020). Genetic structure and diversity of attalea vitrivir populations in Brazilian Cerrado. Journal of Agricultural Science, 12, 177-188. https://doi.org/10.5539/jas.v12n2p177
» https://doi.org/10.5539/jas.v12n2p177 -
Nunes, A. M., Fachinello, J. C., Radman, E. B., Bianchi, V. J. and Schwartz, E. (2010). Caracteres morfológicos e físico-químicos de butiazeiros (Butia capitata) na região de Pelotas, Brasil. Revista Interciência, 35, 500-505. Retrieved from https://www.interciencia.net/wp-content/uploads/2018/01/500-1%C2%BA-c-FACHINELLO-6.pdf
» https://www.interciencia.net/wp-content/uploads/2018/01/500-1%C2%BA-c-FACHINELLO-6.pdf - Rossato, M., Barbieri, R. L., Schäfer, A. and Zacaria, J. (2007). Caracterização molecular de populações de palmeiras do gênero butiá do Rio Grande do Sul através de marcadores ISSR. Magistra, 19, 311-318.
-
Souza, P. N. S., Andrade, F. H. P., Azevedo, A. M., Nietsche, S., Ribeiro, L. M. and Lopes, P. S. N. (2023). Morphoagronomic diversity in Butia capitata progenies (Arecaceae). Euphytica, 219, 81. https://doi.org/10.1007/s10681-023-03203-3
» https://doi.org/10.1007/s10681-023-03203-3 -
Ventura, L. J. M., Perreira, G. S. L., Santos, H. C. M., Lima, J. L., Mercadante-Simões, M. O., Lopes, P. S. N. and Ribeiro, L. M. (2022). Cytological aspects of Butia capitata (Arecaceae) fruit maturation and senescence. Scientia Horticulturae, 297, 110938. https://doi.org/10.1016/j.scienta.2022.110938
» https://doi.org/10.1016/j.scienta.2022.110938 - Weichert, R. F., Rodrigues, D. B., Costa, L. T. and Melo, J. O. F. (2023). Árvores do cerrado: importância econômica e social na educação ambiental. Guarujá: Editora Científica Digital.
-
White, J. W., Sanchez, P. A., Gore, M. A., Bronson, K. F., Coffelt, T. A., Conley, M. M., Feldmann, K. A., French, A. N., Heun, J. T., Hunsaker, D. J., Jenks, M. A., Kimball, B. A., Roth, R. L., Strand, R. J., Thorp, K. R. and Wang, G. (2012). Field-based phenomics for plant genetics research. Field Crops Research, 133, 101-112. https://doi.org/10.1016/j.fcr.2012.04.003
» https://doi.org/10.1016/j.fcr.2012.04.003 -
Yucel, C., Baloch, F. S. and Özkan, H. (2009). Genetic analysis of some physical properties of bread wheat grain (Triticum aestivum L. em Thell). Turkish Journal of Agriculture and Forestry, 33, 525-535. https://doi.org/10.3906/tar-0901-8
» https://doi.org/10.3906/tar-0901-8 -
Zhang, J., He, Y., Liu, J., Fan, J., Shang, J. and Yan, X. (2024). Integrating spectral data and phylogeographic patterns to study plant genetic variation: a review. Grass Research, 4, e011. https://doi.org/10.48130/grares-0024-0009
» https://doi.org/10.48130/grares-0024-0009
Edited by
-
Section Editor:
Alberto Cargnelutti Filho https://orcid.org/0000-0002-8608-9960


 ***< 0.001, **< 0.01, *< 0.05; ARE: projection area; PER: perimeter; RAMED: mean radius; RAMIN: minimum radius; RAMAX: maximum radius; MAAX: major axis; ECC: eccentricity; L: luminosity; a: hue; b: saturation.
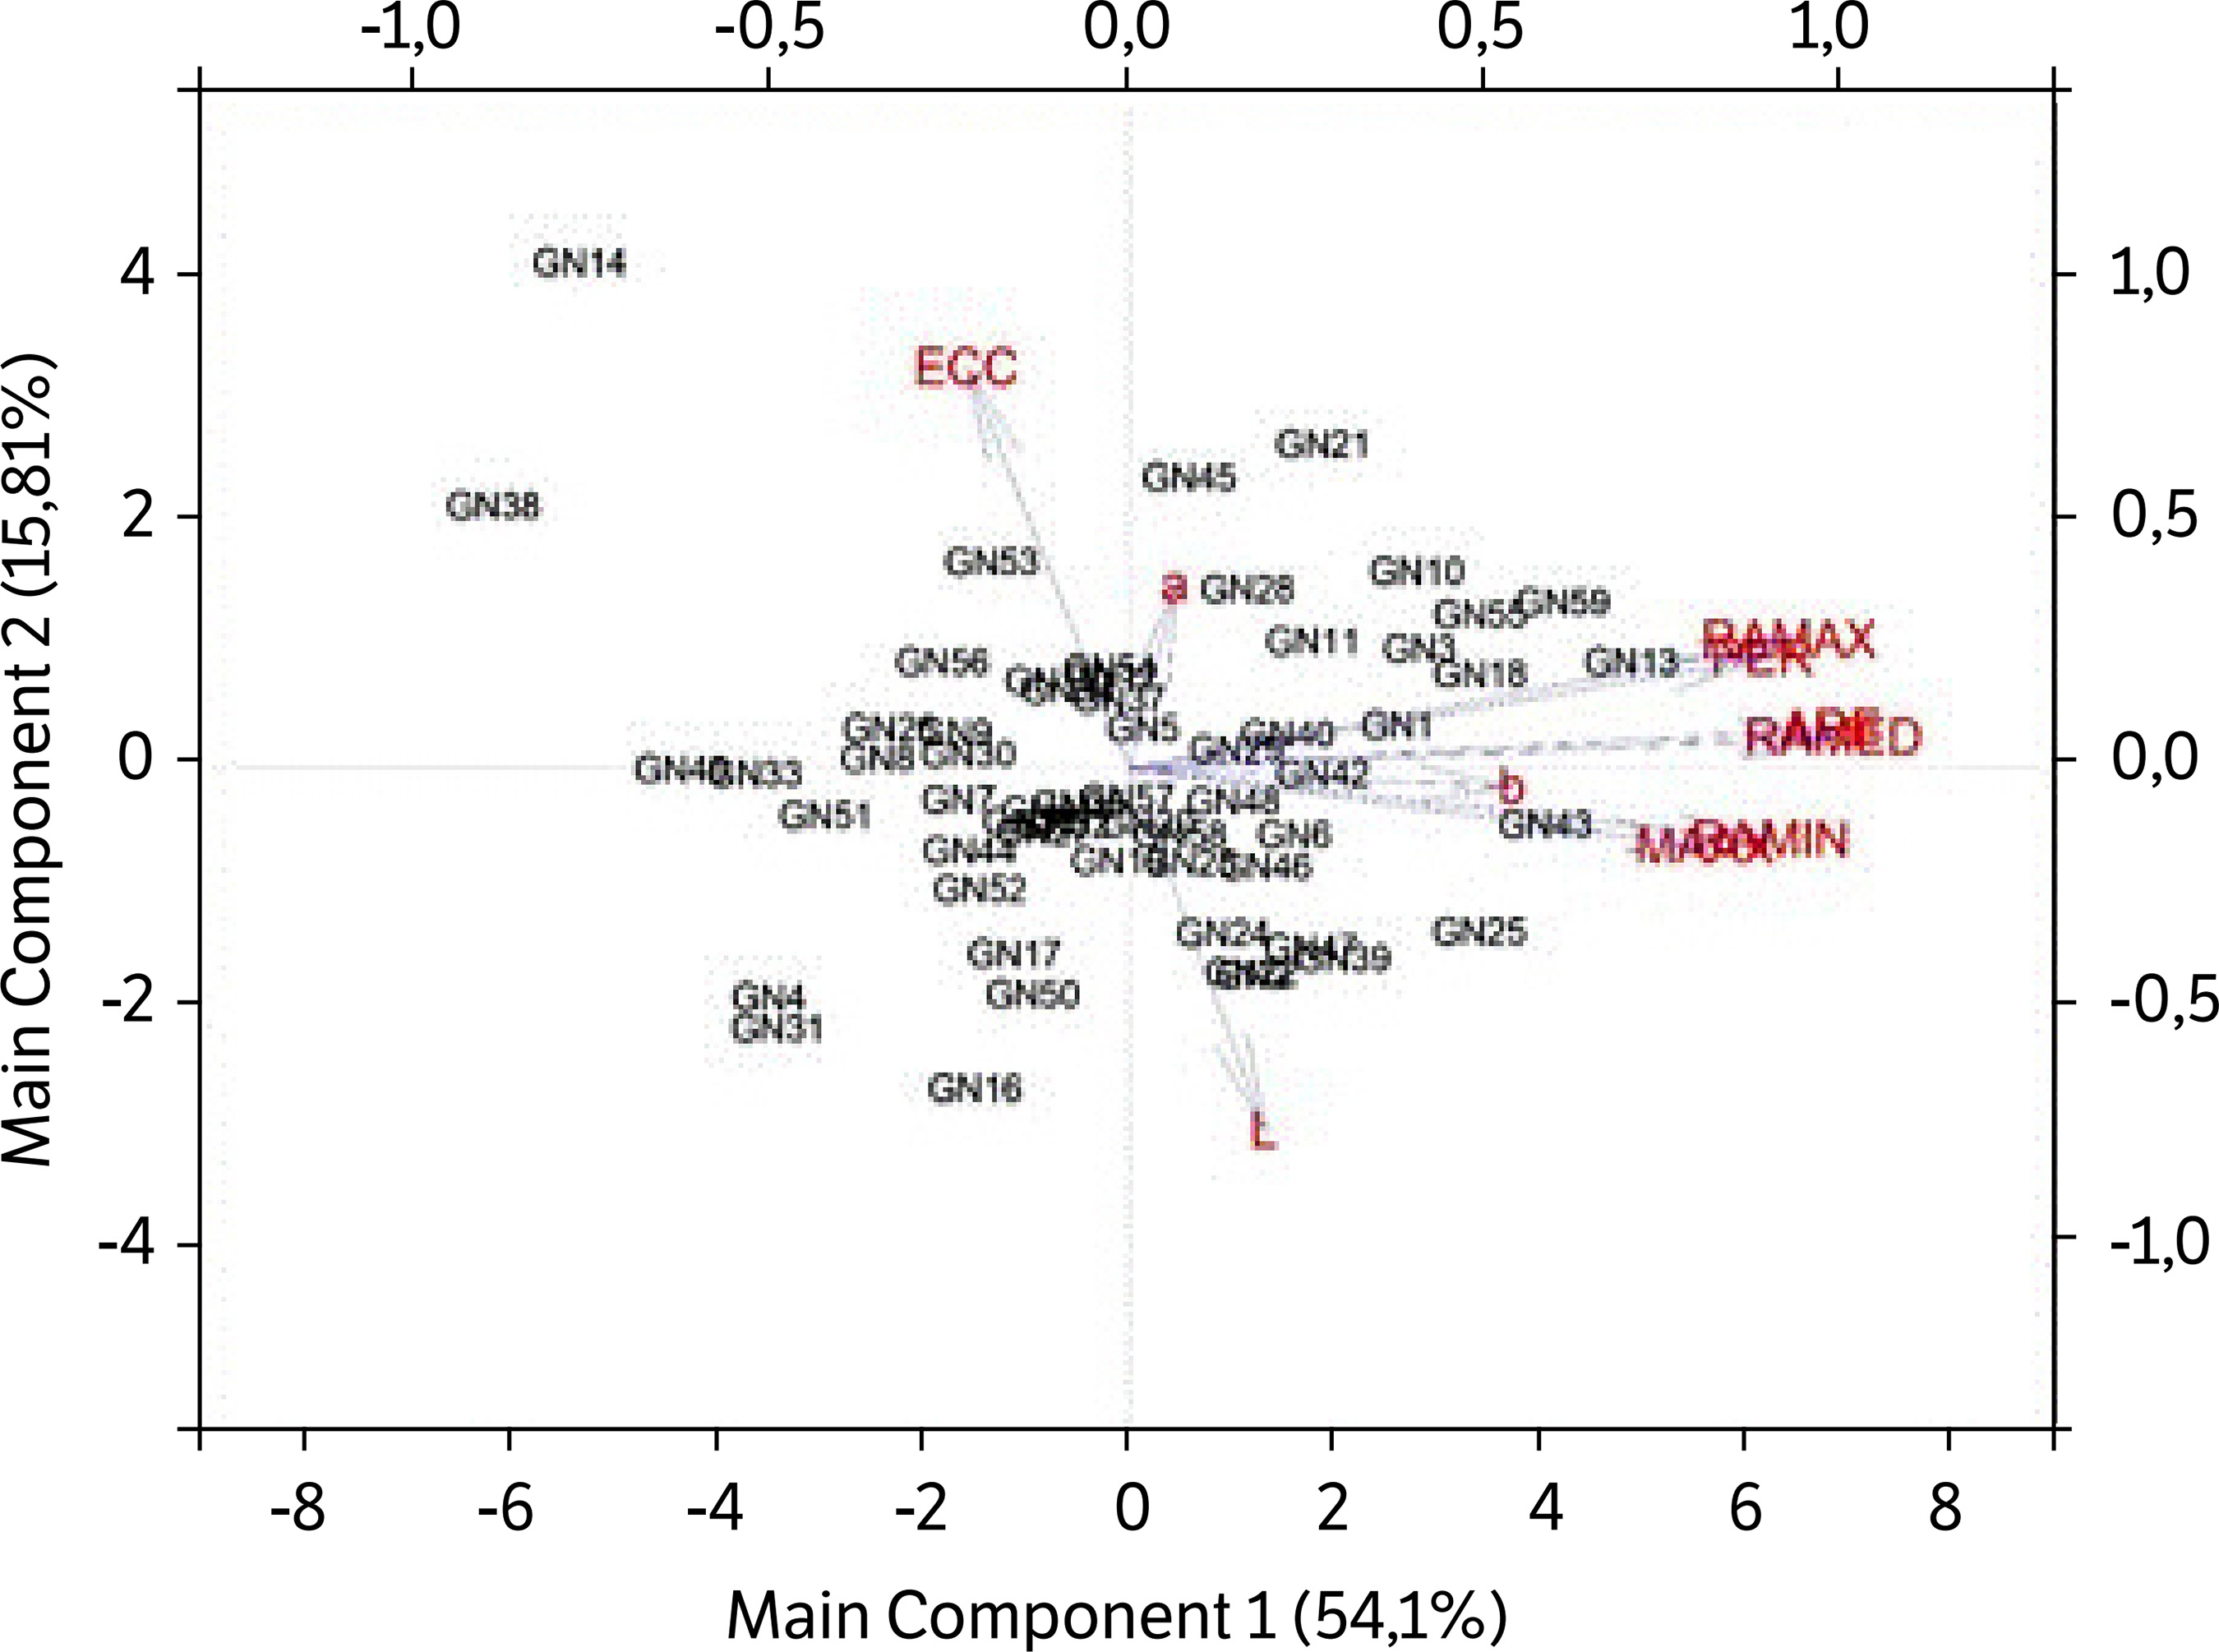 ARE: projection area; PER: perimeter; RAMED: mean radius; RAMIN: minimum radius; RAMAX: maximum radius; MAAX: major axis; ECC: eccentricity; L: luminosity; a: hue; b: saturation.
 ARE: projection area; PER: perimeter; RAMED: mean radius; RAMIN: minimum radius; RAMAX: maximum radius; MAAX: major axis; ECC: eccentricity; L: luminosity; a: hue; b: saturation.