 APPLICATION OF FEATURE EXTRACTION IN PIG BEHAVIOR IDENTIFICATION AND CLASSIFICATION
ABSTRACT
The aim of this study was to improve the accuracy of pig behavior identification and classification using a feature extraction method. Pig activity was measured with a triaxial accelerometer, capturing acceleration data in the X, Y, and Z directions. Statistical features, including the mean, median, maximum, minimum, first quartile, and third quartile for each axis, were extracted to form a 21-dimensional dataset. ReliefF and random forest algorithms were used to analyze and rank the significance of each feature for behavior identification and classification. Features with minimal impact were removed, reducing the dataset from 21 to 9 dimensions. The results showed that when using the ReliefF-reduced dataset, the major mean accuracy for identifying and classifying behaviors of Pigs A, B, and C was 80.9%, 81.7%, and 82.0%, respectively. Similarly, when using the random forest-reduced dataset, the major mean accuracy was 86.4%, 85.3%, and 87.2%, respectively. Thus, the random forest algorithm demonstrated superior performance in feature extraction and dimensionality reduction for classifying pig behavior in this study.
triaxial accelerometer; feature extraction; dimensionality reduction; behavior identification and classification; artificial neural network
INTRODUCTION
The breeding industry has undergone rapid development in recent years, leading to a shift from small-scale, free-range, and manpower-based breeding methods to intelligent, intensive, and precise breeding modes (He et al., 2016). Behavior is one of the most commonly used and sensitive indicators of livestock’s physical, physiological, and health status, as well as their reactions to environmental changes. Acquiring reliable information on animal behavior is crucial for decision-making on livestock farms and improving animal welfare (Larsen et al., 2019). However, identifying and monitoring livestock behavior in traditional breeding industries is challenging. This task is especially difficult on large-scale farms. While existing technologies can monitor and manage the livestock breeding environment to a certain extent, research on monitoring individual growth, health status, and physiological indicators of livestock is lacking. Additionally, determining abnormal livestock behavior primarily relies on the intuition and experience of breeders. This approach is time-consuming and inefficient, and it may fail to account for the behavior of each individual animal in a timely manner. Human factors often lead to livestock disease and even death (Tran & Duong, 2023).
Traditionally, identifying and monitoring livestock behavior mainly relied on manual tracking and one-to-one monitoring of individual animals. However, this method is inadequate for the needs of modern large-scale farms. Simple manual monitoring cannot meet the actual demands of these farms, where efficiency and the ability to monitor numerous animals simultaneously are crucial (Jin & Wang, 2021).
Lying, standing, walking, and exploring are the most important daily behaviors of pigs. In-depth data mining and accurate analysis of these behaviors can provide valuable data support and objective indicators for feed selection, early warning of disease, environmental regulation, and management decisions on pig farms (Barwick et al., 2018; Larsen et al., 2019). Accurate classification and identification of pig behaviors using machine learning algorithms are crucial for ensuring healthy pig growth, improving welfare, and enhancing the economic benefits of pig farms.
This study had three aims: to determine the effectiveness of using a triaxial accelerometer for the identification and classification of pig behavior, to assess the value of feature extraction and dimensionality reduction in training an artificial neural network (ANN), and to compare the utility of the ReliefF algorithm with that of the random forest algorithm for the identification and classification of pig behavior.
MATERIAL AND METHODS
Data source
The experiment was carried out on a pig farm (Figure 1) in Hohhot, Inner Mongolia, China (40°40'26"N, 111°21'46"E). Hohhot has a typical Mongolian Plateau continental climate, characterized by distinct seasonal changes, large annual temperature differences, and significant daily temperature variations. The pig farm is a modern, small-scale teaching and practical facility covering an area of 547 m2. The building structure consists of internal and external suites, with a total of six pig houses used for raising fattening pigs, nursing piglets, and sows for farrowing. Each pig house is equipped with automatic drinking and feeding equipment. In this experiment, data collection was carried out in one of the fattening houses. The internal dimensions of the experimental pig house were 9.2 m (length) × 9.0 m (width) × 3.6 m (height). It featured a semi-slatted floor, and the pig pen was enclosed by cement walls and metal railings.

The experiment was conducted between 10 March and 17 April, 2019. Considering that pigs’ daily activities mainly occur during the day, with occasional foraging at night but primarily focused on sleeping and lying down, data collection was scheduled from 7:00 to 19:00 each day. Research has shown that piglets sleep 60% to 70% of the night, boars 70%, and sows 80% to 85% (Pu et al., 2015). In this experiment, three pigs at different fattening stages were monitored: Pigs A, B, and C with initial weights of 35.8, 62.3, and 92.4 kg, respectively.
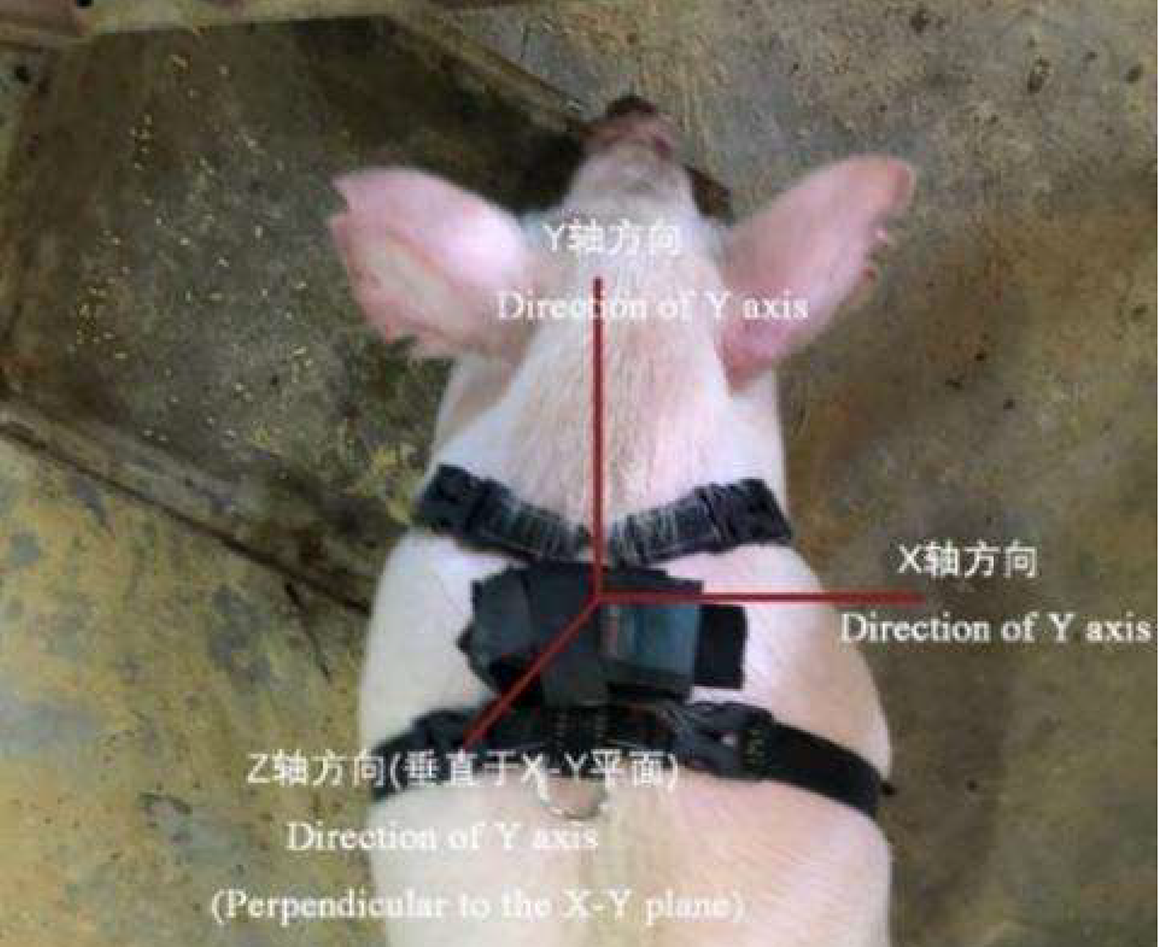
During the experiment, a scheduled and quantified feeding regimen was implemented along with free access to drinking water. The pigs were fed twice a day at 08:30 and 17:00, with the three pigs living in the same pig house environment. The pigs’ activities were measured using a triaxial accelerometer with a sampling frequency of 20 Hz (SW-J4601V; China). This device was powered by 5V lithium-ion batteries and controlled by a CC2530F256 controller and ADXL325 chip. The triaxial accelerometer was placed in a waterproof box and tied to the pigs’ backs. This positioning was chosen because initial tests showed that it had the least impact on the pigs’ natural behavior and minimized the risk of the box falling off compared with placement on the neck or leg. The installation direction of the triaxial accelerometer is shown in Figure 2.

Direction of the back-mounted triaxial accelerometer. The X-axis pointed from the left to right side of the pig’s body, the Y-axis pointed from the tail to head of the pig, and the Z-axis was perpendicular to the XY plane.
The pig behavior information acquisition system used in this study consisted of both hardware and software components. The hardware system included an accelerometer module, control module, data storage module, and power supply module. This setup was placed on the pigs’ backs to achieve real-time collection of behavior data. The collected data were then wirelessly transmitted to a host computer using Zigbee technology for real-time display and storage. The computer interface used for this process is shown in Figure 3.

This study focused on four behaviors frequently performed by pigs: lying, standing, walking, and exploring. These four behaviors reflect the daily life and health status of pigs, providing useful information regarding abnormal behavior, early disease diagnosis, and environmental control on pig farms. Table 1 presents the definitions and characteristics of these four behaviors. To ensure accuracy in data labeling, a camera was mounted on the upper part of the pig house to record the entire data collection process. The camera was synchronized with the computer time before data collection began to ensure the accuracy of adding data labels in the later period. To minimize stress caused by human contact, data collection commenced after the pigs had worn the accelerometer for 3 days.
Data pre-processing
Data processing was conducted using both R (The R Core Team, 2022) and MATLAB (1984). Modelling and statistical analysis were performed in R. Missing values were removed from the time series of accelerometer data. The data were then standardized to the range of [−1, 1] to meet the application requirements of subsequent machine learning algorithms.
Pig behavior feature extraction
Feature extraction involves creating a new dataset by adding feature parameters to the original data. This process aims to extract the parameter set that best reflects the essential differences between categories from the obtained behavioral information, and then use this subset to construct an improved identification and classification model (Jia et al., 2022). In this study, the mean, median, minimum, maximum, first quartile, and third quartile values were extracted from the acceleration data in the X, Y, and Z directions of the collected pig behavior signals. This resulted in a new dataset containing 21 features, enhancing the effectiveness of behavior identification and classification.
The mean is the average of the number of samples in the corresponding window and is used to reflect the central trend or central position of the data distribution. The median is the middle value in a data sequence, representing a sample, population, or probability distribution. The maximum peak Xmax is the largest number in a dataset, while the minimum peak Xmin is the smallest, describing the degree of data dispersion. The first quartile (1stQu) is the value at the 25th percentile of all values in a dataset when placed in descending order. The third quartile (3rdQu) is the value at the 75th percentile of all values in the dataset when placed in descending order. These serve as important statistical characteristics representing the central trend in descriptive statistics.
Feature importance evaluation and feature extraction
In machine learning problems, high-dimensional features can lead to prolonged classification processes (Abdulhammed et al., 2019). The initial feature extraction often results in a high-dimensional dataset, which usually contains numerous features with little or redundant correlation to the classification task. This not only increases the computational complexity of the algorithm but can also cause a “dimensional disaster,” adversely affecting the identification and classification outcomes. To improve the identification and classification effect, it is helpful to analyze the importance of different features, remove noise features with little correlation to the classification, reduce the dimensions of the dataset, retain key distinguishing features, and reduce the complexity of the machine learning models.
The ReliefF algorithm is highly efficient and adaptable to different data types, including discrete and continuous data. It excels in handling multi-class problems by selecting the nearest neighbor samples from each category, thereby achieving more effective feature exaction (Aggarwal et al., 2023; Wang et al., 2016). The random forest model is widely used as a predictive function and has proven useful in various applications. The random forest algorithm evaluates the importance of all features by measuring the contribution of each feature in the dataset to the model. The average contribution of each feature is then determined (Janitza et al., 2013; Zhang et al., 2016). In this study, we employed both the ReliefF and random forest algorithms to evaluate the importance of features in the pig behavior data.
Feature importance assessment based on ReliefF
ReliefF is an extension of the Relief algorithm, addressing its limitation of only handling binary classification problems (Jiang et al., 2015). For multi-classification problems, the ReliefF algorithm operates by randomly selecting a sample R from the training set, then finding the k nearest neighbor samples from the same class as R and another k neighbor from a different class. The algorithm then updates the corresponding feature weights based on those neighbors. Weighted ReliefF feature selection is achieved by assigning different weights to each feature, measuring their impact on the identification and classification results. Features with a greater impact are assigned larger weights, while those with a lesser impact are assigned smaller weights.
If X = (x1,x2,...,xn) is the original N dimensional feature vector, M features are selected in turn according to their weight sizes to form a new feature vector, where M<N. This process is the feature selection process of ReliefF. The operation flow of the ReliefF weighted feature selection algorithm in the present study was as follows.
First, the initial value of the eigenweight vector W was set to zero. Each sample in the training set was randomly iterated over 10 times (i=1:m), where m was less than or equal to the number of samples in the set. An arbitrary sample Ti was then selected from the training set. The k nearest neighbor samples Hj were found in the same class as the sample, and the k nearest neighbor samples Mj were found in different classes. The weight of each feature (A=1:m) in the feature vector was updated using [eq. (1)]
If a particular dimension of feature A was beneficial for classification, it was made closer to similar samples, and the distance diff (A,Ti,Hj) from different kinds of samples was maximized. Consequently, the obtained weight W(A) gradually increased. P(c) refers to the proportion of Class c samples in the total sample size, as shown in [eq. (2)]:
After the above steps, the final output of the ReliefF algorithm was the feature weight vector w after superposition. The Euclidean distance between the two samples, denoted as diff (Feature Instance1,Instance), was used to measure the degree of difference between them. The expression for this distance is shown in [eq (3)]:
Where I1,I2 represent two samples and value (A1,I1) is the value of the Ath feature of I1. Parameter m is the number of samples randomly selected (i.e., the number of iterations), with the maximum equal to the total number of samples in the dataset. Parameter k is the number of nearest neighbor samples selected, with the upper limit set by the number of samples of each class. To remove features that have little impact on the classification result and to reduce the complexity of the dataset, each obtained feature and its corresponding correlation weight were arranged in descending order. The new dataset was then composed of features whose weights were higher than the set threshold.
The ReliefF weighted feature selection algorithm was used to randomly sample the datasets of three experimental pigs in this study (sampling times = 100, number of adjacent samples = 5), and 21 features were evaluated. Using the dataset of Pig A as an example, the feature evaluation results are shown in Figure 4.

As shown in Figure 4, 21 features in the Pig A dataset (X, Y, Z, X.Min, X.1stQu., X.Median, X.Mean, X.3rdQu., X.Max, Y.Min, Y.1stQu., Y.Median, Y.Mean, Y.3rdQu., Y.Max, Z.Min, Z.1stQu., Z.Median, Z.Mean, Z.3rdQu., and Z.Max) were assigned serial numbers 1 to 21 from left to right, and the classification ability and contribution of each feature were ranked. The results are shown in Table 2. Order 1 indicates the sequence before feature selection, and Order 2 indicates the sequence after feature selection.
Figure 4 and Table 2 demonstrate that Feature 14 had the largest weight and was significantly higher than the others, indicating that this feature had a stronger correlation with the behavioral categories of pigs in this study and was more conducive to classification. To achieve feature dimension reduction and simplify the calculation of the number of hidden layer nodes in subsequent backpropagation (BP) neural networks, the top nine features were selected to form a new dataset according to their ranking order. The sequence of features obtained after the ReliefF algorithm was applied to the datasets of Pigs A, B, and C is shown in Table 3.
Feature importance assessment based on random forest model
There are two ways to evaluate the importance of features in a random forest model. The first method involves replacing the corresponding features with a list of random numbers and calculating the deviation between the error rates of the out-of-bag datasets before and after replacement. The second method uses the Gini coefficient as the evaluation index. A review of relevant literature showed that the first substitution method has better non-bias performance than the second Gini coefficient method (Lee et al., 2019). Therefore, we used the substitution method to evaluate the importance of each feature in the present study. Importance assessment plays a crucial role in selecting random forest classification features. It can save computational costs, help establish the best identification and classification model, and improve the sensitivity of the classifier.
The importance ranking of random forest features was implemented by loading the “randomForest” and “Importance” packages in R (Genuer et al., 2015). Assuming that the initial sample size was N, the bootstrap self-sampling method was used to randomly select k samples equal to the initial sample size, and the corresponding k classification trees were constructed. Samples not selected in the self-sampling process were included in the out-of-bag data, which was used as a test set for feature importance assessment.
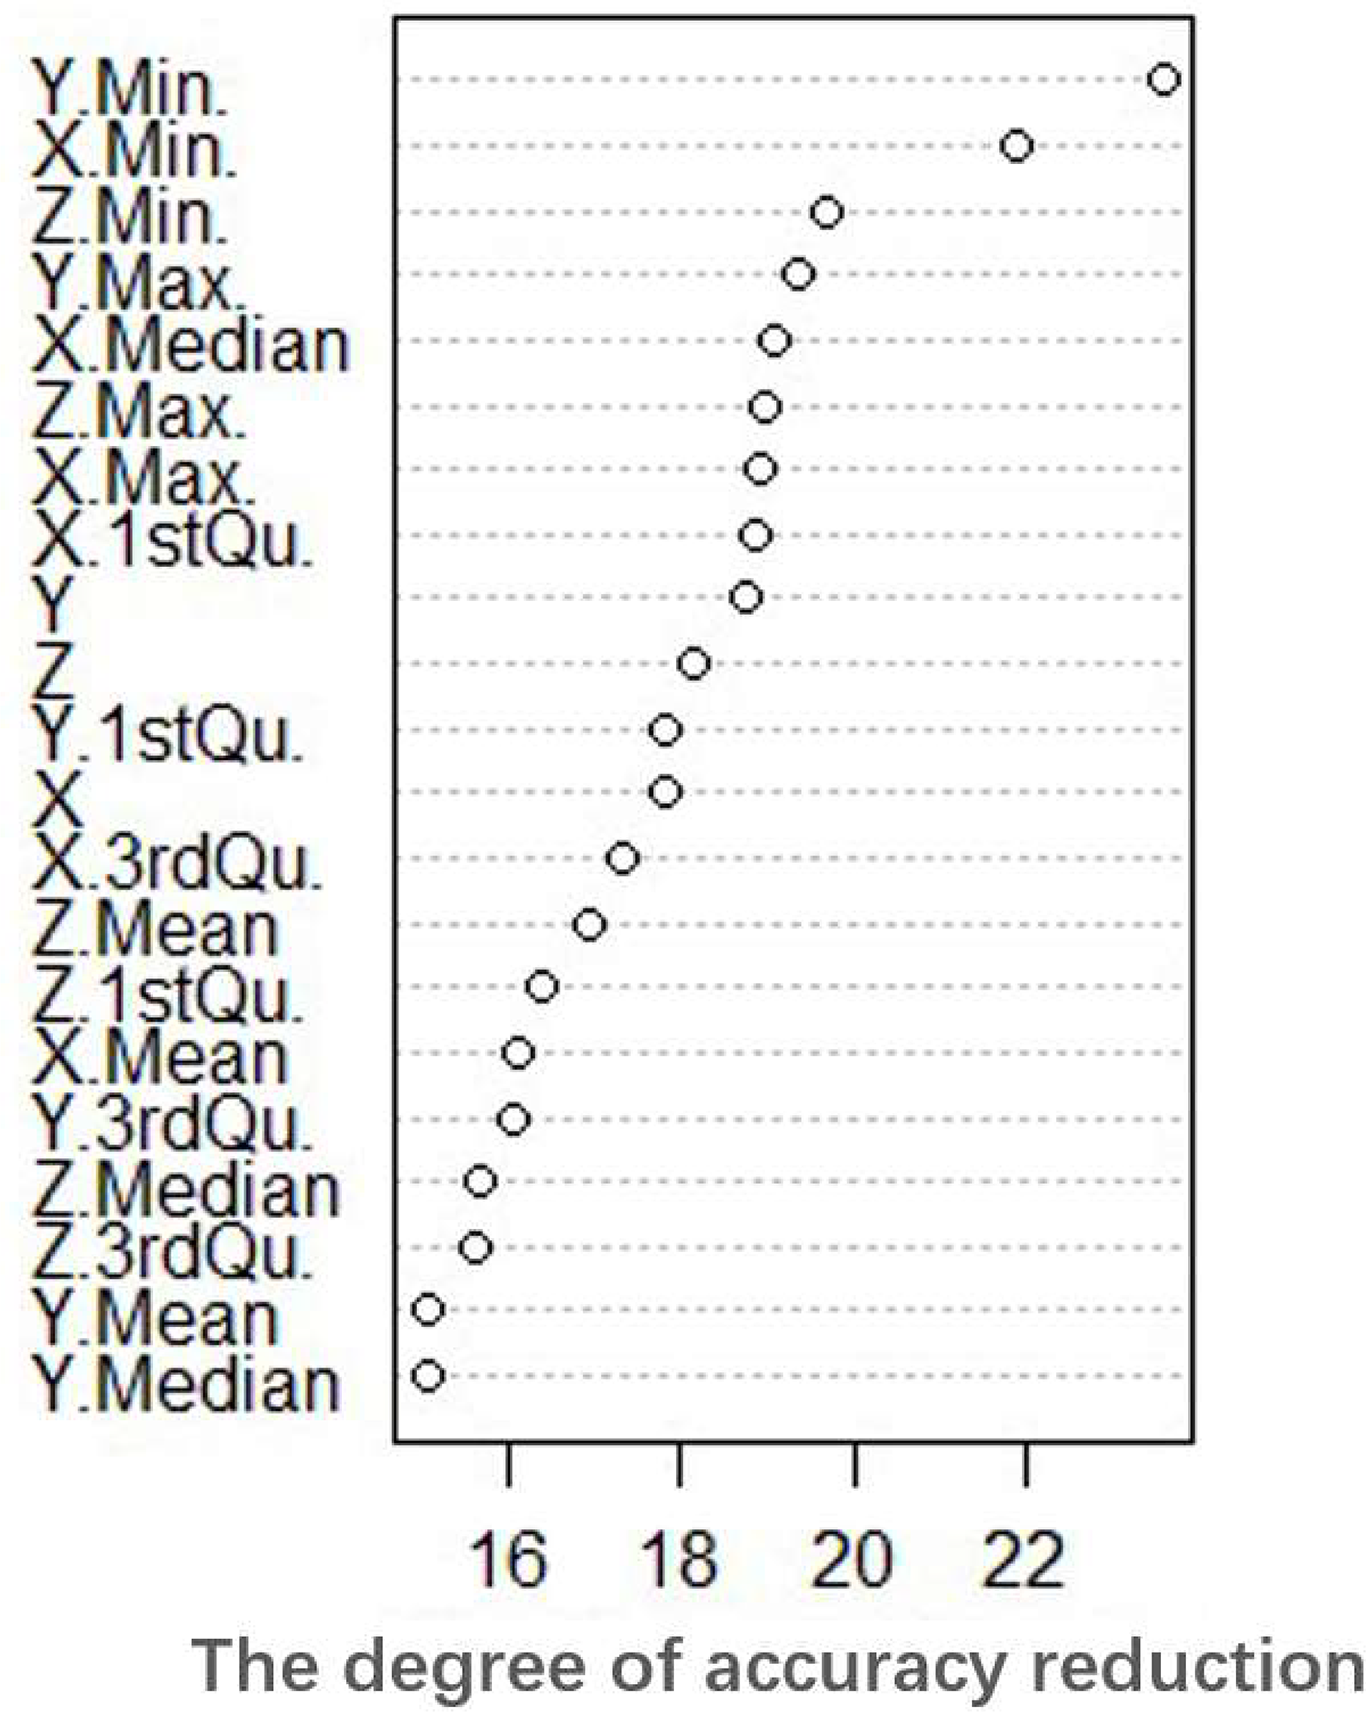
The ranking of feature importance obtained during the identification and classification of the behavioral data of pigs (taking Pig A as an example) using the random forest algorithm is shown in Figure 5. The horizontal axis represents the mean decrease accuracy, and the vertical axis lists the names of all features used in this study.

Each feature in Figure 5 is ordered from top to bottom based on its contribution to the random forest classification, from most to least impactful. In this study, features with minimal contribution to the identification and classification of pig behavior were eliminated based on their importance ranking. The top 9 features that contributed the most to the classification among the 21 features were selected to form a new dataset. These nine features were Y.Min, X.Min, Z.Min, Y.Max, X.Median, Z.Max, X.Max, X.1stQu, and Y. This reduction in dimensionality helped save computation costs and effectively improve the identification and classification performance.
The feature importance ranking obtained after application of the random forest algorithm to the datasets of pig A, B, and C is shown in Table 4.
. Feature importance ranking before and after feature evaluation using random forest algorithm for different datasets
So far, two datasets containing 9 feature values were obtained based on ReliefF weighted feature selection algorithm and random forest feature importance ranking. This study will compare and analyze the effectiveness and advantages of the two feature dimensionality reduction methods through machine learning algorithm, and select a feature extraction method that is more suitable for this study.
Pig behavior identification and classification based on BP neural network
A BP neural network is a multi-layer feedforward neural network trained using a BP algorithm (Zhang et al., 2021). Compared with other algorithms, a fully connected feedforward neural network, which operates as a general function approximator, offers strong learning ability and adaptability, low computing cost, and high efficiency (Hou et al., 2018).
Feedforward neural network architecture
The feedforward neural network used in this study consisted of an input layer, two hidden layers, and an output layer. Two nine-dimensional datasets, each containing nine feature values obtained by the ReliefF weighted feature selection algorithm and the random forest algorithm, were used as input layers in turn. Two hidden layers were chosen because this structure can approximate almost all types of nonlinear mappings (Meng & Li, 2020). The number of neurons in the hidden layer is very important. If the number is too small, it is difficult to describe complex nonlinear relationships. Conversely, too many neurons can easily cause overfitting of the model and weaken its generalization ability (Bennison et al., 2017). Finally, the four nodes in the output layer corresponded to the four pig behaviors studied: lying, standing, walking, and exploring.
We optimized the number of nodes in the two hidden layers as follows. For the first hidden layer, we tried using 2/3, 1, and 4/3 times the number of nodes in the input layer. Similarly, for the second hidden layer, we tried using 2/3, 1, and 4/3 times the number of nodes in the first hidden layer (Larsen et al., 2019). The best architecture of the ANN was chosen based on the highest accuracy, as shown in Table 5.
Considering that the activation function also plays a very important role in neural networks, the rectified linear unit (ReLU) and Softmax functions were used in this study. ReLU was used as the activation function in the hidden layers, while Softmax was used as the activation function in the output layer. The output layer had four nodes corresponding to the four pig behavior categories. The Softmax function adjusted the values of the four outputs so that they were all between 0 and 1 and always summed to 1. Thus, each of the four output values could be interpreted as the probability of the respective behavior. The final prediction for a given observation was the behavior class with the highest probability value.
Model training and model performance evaluation
Model performance evaluation methods are essential in machine learning classification to guide classification algorithms and assess classification results. Accuracy is one of the most commonly used criteria for evaluating machine learning algorithms and model performance. It represents the proportion of correctly classified samples among all samples. Generally, the higher the accuracy, the better the identification and classification performance of the model. In this study, accuracy was calculated using [eq. (4)]:
Where:
TP indicates true positives, the number of positive classes correctly identified as positive;
TN indicates true negatives, the number of negative classes correctly identified as negative;
FP indicates false positives, the number of negative classes incorrectly identified as positive, and
FN indicates false negatives, the number of positive classes incorrectly identified as negative.
In this study, the main performance metric was the major mean accuracy. For each behavior class, the per-class accuracy was calculated as the proportion of observed instances of that class that were correctly predicted. The major mean accuracy was then calculated as the simple mean of the four per-class accuracies.
RESULTS AND DISCUSSION
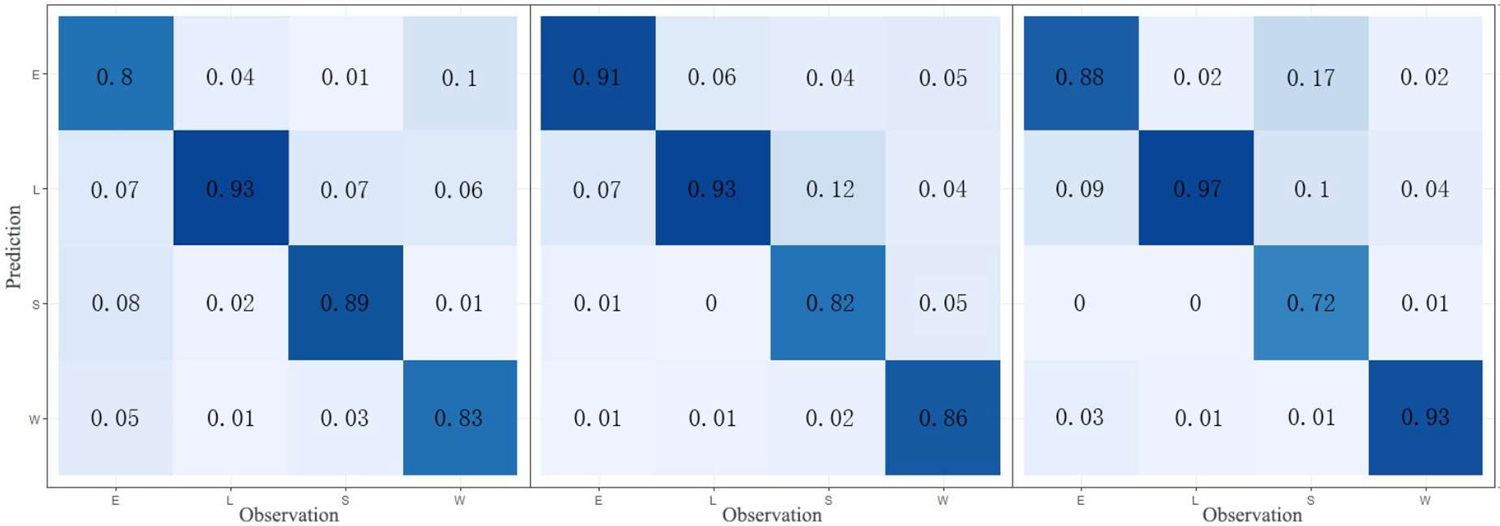
Based on the BP neural network, the identification and classification effects of the dataset obtained by ReliefF weighted feature selection and random forest feature importance ranking were compared. The results are shown in Table 6 and Figures 6 to 8.

Results of pigs’ behavior classification based on ReliefF algorithm. The results of Pigs A, B, and C are shown from left to right. L, lying; S, standing; W, walking; E, exploring.

Results of pigs’ behavior classification without feature selection. The results of Pigs A, B, and C are shown from left to right. L, lying; S, standing; W, walking; E, exploring.

Results of pigs’ behavior classification based on random forest algorithm. The results of Pigs A, B, and C are shown from left to right. L, lying; S, standing; W, walking; E, exploring.
As shown in Table 6 and Figures 6 to 8, the major mean accuracies for Pigs A to C significantly improved after feature extraction using the random forest and ReliefF algorithms compared with the identification and classification results without feature extraction. However, the overall accuracies were higher with the random forest algorithm than with the ReliefF algorithm. The major mean accuracy for Pigs A, B, and C increased by 5.5%, 3.6%, and 5.2%, respectively, with the random forest algorithm. Compared with no feature extraction, the major mean accuracy for Pigs A, B, and C increased by 8.0%, 8.1%, and 10.1%, respectively. Moreover, Figures 6 to 8 show that although different pigs had different behavior patterns, lying behavior was still the easiest to identify, with the major mean accuracy for lying behavior reaching 94.2% for all Pigs A to C. Exploring behavior was the second easiest to identify, with a major mean accuracy of 93.2%. Standing and walking performed relatively poorly, with major mean accuracies of 80.8% and 87.3%, respectively. This aligns with the findings of Abell et al. (2017), who showed that an accelerometer mounted on the withers of cattle could correctly classify lying behavior with precision, sensitivity, and an F1 score of 95%, 98%, and 96%, respectively, and standing behavior with precision, sensitivity, and an F1 score of 89%, 86%, and 88%, respectively. One reason for the lower predictive accuracies in the present study might be that the three behaviors included similar movements. For example, grazing without moving was often misclassified as standing and vice versa.
For each experimental pig in this study, lying, standing, and walking were easily confused with exploring, while exploring was often misidentified as standing and walking. These errors may have been related to the motion amplitude of the pigs’ range of motion. When the pig was standing but its head was slightly sniffing or rubbing against the railing or wall, the sensor fixed on the pig’s back made it easy to confuse exploring and standing behaviors.
When the pig’s body remained stationary but its head movement was more intense, exploring was easily misidentified as walking behavior and vice versa. Additionally, lying was often misidentified as standing because both behaviors were static in nature and had similar patterns. Walking behavior in pigs consists of semi-regular, repeated step movements at regular intervals. When walking, standing, and exploring behaviors occurred repeatedly, the triaxial accelerometer generated acceleration data even when the pig was lying or standing because of the accelerometer’s volume, weight, and fixed position on the pig’s back (which was not a completely horizontal plane). This was due to the pig’s breathing and body shaking movements, which increased the possibility of misclassifying the pig’s behavior. Augustine & Derner (2013) reported similar results. They conducted a behavior classification study of cows using a decision tree algorithm and found that four actions (feeding, walking, standing, and others) could not be classified with accuracy because of the existence of similar movements within the behaviors. For example, the action of lowering the head while walking was misclassified as grazing, and grazing while stopping was misclassified as resting. To address this issue, future researchers should consider incorporating the transition states between different types of behaviors into the analysis. Enriching the datasets with more data types may also help improve the learning performance of classifiers. Notably, a limitation of the present study was the lack of data collection for pig behavior at night. More comprehensive data will be collected in a subsequent study to enrich the research content and results.
CONCLUSIONS
The pig behavior information collection system based on a triaxial accelerometer designed in this study can be effectively used for real-time automatic acquisition followed by wireless transmission and storage of pig behavior data. Such data are useful for behavior identification and classification, pig health monitoring, and early disease identification. During our data analysis, outliers were removed and standardized pretreatment was performed. The characteristics of the pigs’ lying, standing, walking, and exploring behaviors were obviously different and easy to distinguish. Considering that the high dimensionality of the pig behavior dataset could lead to dimensional disaster, this study adopted a random forest algorithm and ReliefF algorithm to rank the importance of features in the pig behavior data. This process allowed the selection of the top nine features that had the greatest impact on the identification and classification results for model training and verification. The results showed that the dataset based on feature extraction using the random forest algorithm had a better effect on pig behavior classification, with the major mean accuracy for lying, standing, walking, and exploring in Pigs A, B, and C reaching 86.4%, 85.3%, and 87.2%, respectively. Compared with the results obtained without feature extraction, the major mean accuracy increased by 8.0%, 8.1%, and 10.1%, respectively, better meeting the needs of this study. These results can provide technical support for further improving the welfare level of pig farms and enhancing management decision-making.
REFERENCES
- Abdulhammed R, Musafer H, Alessa A, Faezipour M, Abuzneid A (2019) Features dimensionality reduction approaches for machine learning based network intrusion detection. Electronics 8(322):1-27.
- Abell K M, Theurer M E, Larson R L, White B J, Hardin D K, Randle R F (2017) Predicting bull behavior events in a multiple-sire pasture with video analysis, accelerometers, and classification algorithms. Computers and Electronics in Agriculture 136 (15):221-227.
- Aggarwal N, Shukla U, Saxena G J, Rawat M, Bafila A S, Singh S, Pundir A (2023) Mean based relief: An improved feature selection method based on ReliefF. Applied Intelligence 53: 23004-23028.
- Augustine D J, Derner J D (2013) Assessing herbivore foraging behavior with GPS collars in a semiarid grassland. Sensors 13 (3):3711-3723.
- Barwick J, Lamb D W, Dobos R, Schneider D, Welch M, Trotter M (2018) Predicting lameness in sheep activity using tri-axial acceleration signals. Animals 8:1-16.
- Bennison A, Bearhop S, Bodey TW, Votier SC, Grecian WJ, Wakefield ED, Hamer KC, Jessopp M (2017) Search and foraging behaviors from movement data: a comparison of methods. Ecology and Evolution 11:1-13.
- Genuer R, Poggi J M, Tuleau-Malot C (2015) VSURF: An R package for variable selection using random forests. The R Journal 7(2):19-33.
- He D J, Liu D, Zhao K X (2016) Review of Perceiving Animal Information and Behavior in Precision Livestock Farming. Transactions of the Chinese Society for Agricultural Machinery 47: 231-244.
- Hou YT, Cai XH, Wu ZQ, Dong ZG (2018) Research and implementation of cattle behavior character recognition method-based on support vector machine. Journal of Agricultural Mechanization Research 8:36-41.
- Janitza S, Strobl C, Boulesteix A (2013) An AUC-based permutation variable importance measure for random forests. BMC Bioinform 14(119):1-11.
- Jia W K, Sun M L, Lian J, Hou S J (2022) Feature dimensionality reduction: a review. Complex & Intelligent Systems 8:2663-2693.
- Jiang W L, Wang Y R, Wang Z W, Zhu Y (2015) Fault feature dimension reduction method based on ReliefF algorithm and correlation calculation and its application. Hydraulics & Pneumatics 12(4):18-24.
- Jin M, Wang C G (2021) Effect of wavelet de-noising on the classification of pig behavior. Engenharia Agricola 41(3):286-296.
- Larsen MLV, Bertelsen M, Pedersen LJ (2019) Pen fouling in finisher pigs: Changes in the lying pattern and pen temperature prior to fouling. Frontiers in Veterinary Science 6:1-6.
- Lee S B, Lee S M, Lee K Y (2019) A Gini coefficient based evaluation on the reliability of travel time forecasting. Journal of King Saud University - Engineering Sciences 31:314-319.
-
MATLAB (1984) Matrix&Laboratory. MathWorks. https://www.mathworks.com/products/matlab.html
» https://www.mathworks.com/products/matlab.html - Meng ZL, Li TL (2020) Review and prospect of machine learning technology. Application of IC 37:56-57.
- Pu H Z, Chen L, Zhang L J, Zhang F M, Zhang L, Guo Z Y, Wang J Y (2015) Effects of hot and humid environment on feeding behavior in growing-finishing pigs with ad libitum feeding. Chinese Journal of Animal Nutrition 27(5):1370-1376
-
R Core Team (2022) R: A language and environment for statistical computing. Vienna, R Foundation for Statistical Computing. Available: https://www.r-project.org/
» https://www.r-project.org/ - Tran DD, Duong NT (2023) Pig Health Abnormality Detection Based on Behavior Patterns in Activity Periods using Deep Learning. International Journal of Advanced Computer Science and Applications 14(5):603-610.
- Wang Z, Zhang Y, Chen Z C, Yang H, Sun Y X, Kang J M, Yang Y, Liang X J (2016) Application of ReliefF algorithm to selecting feature sets. IEEE International Geoscience and Remote Sensing Symposium (IGARSS) 755-758.
- Zhang C, Guo Y, Li M (2021) Review of development and application of artificial neural network models. Computer Engineering and Application 57:57-69.
- Zhang X F, Hou Y, Li K (2016) Research on importance scoring of random forest variables based on AUC statistic. China Health Statistics 33(3):537-542.
-
FUNDING:
This research was funded by the General project of natural science research in colleges and universities in Jiangsu Province [Grant No. 23KJD230001], the High-end training program for leading teachers in vocational colleges in Jiangsu Province [Grant No. 2023TDFX001] and the Changzhou Natural Science Foundation Project [Grant No.CJ20220015].
Edited by
-
Area Editor:
Héliton Pandorfi