 STRAW AND DIFFERENT SEEDER SPEEDS
ABSTRACT
In the satisfactory development of soybeans an ally is quality seeding and soil preparation. The aim was to evaluate the quality of soybean seeding under different speeds and cover crops. The experiment was conducted in a commercial soybean crop, using a high-performance pneumatic seeder. The design experimental was randomized blocks, in 2x2 strip arrangement and nine repetitions. The factors consisted of two seeding speeds (7.0 km h-1 and 8.5 km h-1) and two cover crops (Urochloa brizantha cv. Marandu and Urochloa ruziziensis). The operational quality was analyzed by statistical quality control, statistical process control and boxplot. It was found that U. ruziziensis provided more uniformity of coverage and soil humidity than U. brizantha cv. Marandu, but with lower straw produced. It is recommended speeds of 7.0 and 8.5 km h-1 for no-till soybean in U. ruziziensis straw, and 7.0 km h-1 in U. brizantha cv. Marandu straw.
Glycine max (L.) Merrill; boxplot; control charts; cover crop; seeding speed
INTRODUCTION
Soybean (Glycine max (L.) Merrill) is one of the most important crops worldwide because of its adaptability to different conditions and its contribution to income, jobs, and food production (Chen et al., 2019). One of the main factors influencing the development and productivity of this crop is sowing quality, which can be affected when sowing is conducted using no-till systems in an incorrect manner (Copetti, 2015).
The no-till system has been widely adopted for soybean cultivation in Brazil, as it generally leads to higher yields, related to increased organic matter and reduced soil erosion losses (Chaveiro et al., 2022). Crop residues on the soil surface help maintain temperature, reduce water evaporation, and promote soybean germination and growth (Cortez et al., 2019).
The no-till system efficiency is associated with the combined action of several factors, such as the quantity and quality of straw produced by cover crops (Andrade et al., 2018) and the sowing process quality of the main crop (Silva et al., 2020). In this context, increases in sowing speed and straw input are closely related (Lenhardt et al., 2022). Exceeding or decreasing the recommended sowing speeds can increase operational variability, leading to a higher percentage of double and missing plant spacings beyond acceptable levels, which compromises the soybean yield (Petrovic et al., 2024). This usually occurs by focusing only on factors related to closing the sowing window, which are generally linked to climatic conditions and field size, which are determinants in a crop plantability. Therefore, it is crucial to establish a spatial arrangement that ensures an adequate plant stand and allows for high productivity (Ariza-Sentís et al., 2024). The objective of this study was to evaluate the quality of soybeans sown at different sowing speeds in a no-till system with Urochloa sp. straw.
MATERIAL AND METHODS
Location of the Experimental Area
This study was conducted between January and June 2021 in a soybean commercial field located in the municipality of Buriti, Maranhão, Brazil, in the eastern Maranhão mesoregion (Figure 1). The soil in the experimental area is classified as LATOSSOLO AMARELO Distrocoeso (Dantas et al., 2014). The climate is hot, humid, and megathermic, with moderate water deficiency in winter, leading to unstable climatic conditions during the sowing period, and annual rainfall ranging from 1600–2000 mm (Passos et al., 2016).

The experiment was arranged in a 2 × 2 factorial strip design with nine replications. The first factor consisted of two tractor-sowing speeds (7 km h–1 and 8.5 km h–1), whereas the second factor included two Urochloa sp. straw; specifically, Urochloa brizantha cv. Marandu (denoted as C1), and Urochloa ruziziensis (denoted as C2) in two distinct areas.
During the experiment, both areas were characterized by their respective soil cover prior to sowing. This characterization included measuring straw volume, soil temperature, soil moisture content, and soil resistance. For these measurements, 36 samples were taken using a 0.25 m2 sampling square, randomly placed in the field. Straw volume was estimated by collecting material from the soil surface, and the samples were weighed using a semi-analytical balance to provide an estimate of tons per hectare.
Soil temperature was measured above and below the straw at the 36 sample points, and soil moisture was obtained by collecting material from a depth of 0–20 cm. Fresh samples were weighed and naturally dried for 7 d in the laboratory. The soil moisture was calculated as the difference between fresh and dry sample weights, in both steps using a semi-analytical balance. Soil resistance was measured using a digital soil penetrometer (PLG 2040, Falker), at a depth of 0–40 cm for all sample points.
Post-Sowing Analysis and Result Evaluation
Sowing was performed using a precision pneumatic seed drill (PL 7027, New Holland), with 27 rows spaced 0.45 m apart, equipped with pneumatic distributors working together for high-efficiency operation. The seed drill was calibrated to distribute 13.5 seeds per meter at a depth of 3 cm. The operation was conducted using a tractor (T8 385, New Holland) with a 340 hp engine, 279 L min-1 flow rate, five remote valves with electronic flow adjustment, high hydraulic lift capacity, and automatic gear shifting management with speed scaling. The soybean cultivar ‘Pampeana 9510 IPRO’ was used, with a medium life cycle of 122 days, a determinate growth habit, and a recommended stand of 13.5 plants per meter.
After sowing at different speeds and soil covers, seed depth and longitudinal distribution were analyzed according to the method used by Kurachi et al. (1989). For seed depth, measurements were taken from two sub-samples (sowing rows) parallel to 2 m for each replicate. The measurements were performed by carefully opening the seed furrows manually until the seeds were identified. Seed depth was measured using two graduated rulers placed perpendicular to the soil surface.
The seed longitudinal distribution was also measured after manually opening the furrows and was estimated from the longitudinal distance between seeds using a metric tape. The spacings between seeds (Xi) were evaluated according to the classification described by Kurachi et al. (1989), determining the percentage of spacings corresponding to the categories: normal (0.5 Xref < Xi < 1.5 Xref), multiple (Xi < 0.5 Xref), and missed (Xi > 1.5 Xref), based on the reference spacing (Xref) according to the seed drill settings. Identifying the depth, longitudinal, and transverse distribution of seeds significantly aids in evaluating sowing quality (Jasper et al., 2013).
After sowing, the emergency speed index (ESI) was evaluated daily. The number of plants that emerged were counted after the appearance of the first true leaf. The evaluation took place over a 7-d interval, and the estimate was calculated using [eq. (1)] according to Maguire (1962). The stand closure was evaluated twenty days after sowing by measuring the plants and counting the number of emerged plants per meter.
Where:
ESI is the emergency speed index;
E1, E2, and EN are the number of normal seedlings counted in the first, second, and last evaluations, respectively, and
N1, N2, and NN are the number of days between the first, second, and last evaluations, respectively.
Operational quality was visualized in a boxplot diagram, showing the mean and median positioned within the quartiles. The range between the first and third quartiles contained 50% of the data, with the median value of the evaluated variable. Outside the box, the data are represented by vertical lines, showing the upper and lower limits, and values that exceed these limits are outliers.
Statistical Quality Control (SQC) charts, specifically the Statistical Process Control (SPC) were used. SPC is a set of tools designed to understand, monitor, control, and improve the performance of various production processes, including agricultural processes, over time. Their use is essential for achieving process stabilization by identifying unstable moments (points) (Lim et al., 2014). The control charts present central lines (overall mean and mean range) as well as the upper and lower control limits (UCL and LCL, respectively), calculated based on the standard deviation of the variables, as shown in eqs (2) and (3).
Where:
UCL is the upper control limit;
LCL is the lower control limit;
X̅ is the overall mean of the variable, and
σ is the standard deviation.
RESULTS AND DISCUSSIONS
Characterization of the experimental area
The contribution of residual biomass to the soil indicates a greater increase in coverage in C1 than C2. However, as shown in Figure 2, there is a greater oscillation in the biomass produced within the C1 area, where the first sampling points had more straw than the others. In contrast, C2 had a more uniform ground cover.

Control chart of individual straw values (t ha-1) for the Urochloa brizantha cv. Marandu (C1) and Urochloa ruziziensis (C2) covers.
This may be related to the desiccation of the cover crops, which were managed with the same dose of the herbicide glyphosate (750 g e.a. ha–1) and, consequently, were more efficient in terms of the senescence of C2, which was smaller than that of C1. Therefore,C1 its more entouced and cespitose growth habit, and the fact that the knife-roller was not used, may have contributed to a greater contribution of dry matter in clumps, generating greater variability. These results are consistent with those of Salomão et al. (2020), who recommended the efficient management of cover materials to achieve a successful contribution of straw in no-till systems, because even with the use of modern machinery, sowing can be compromised when done in uneven plots.
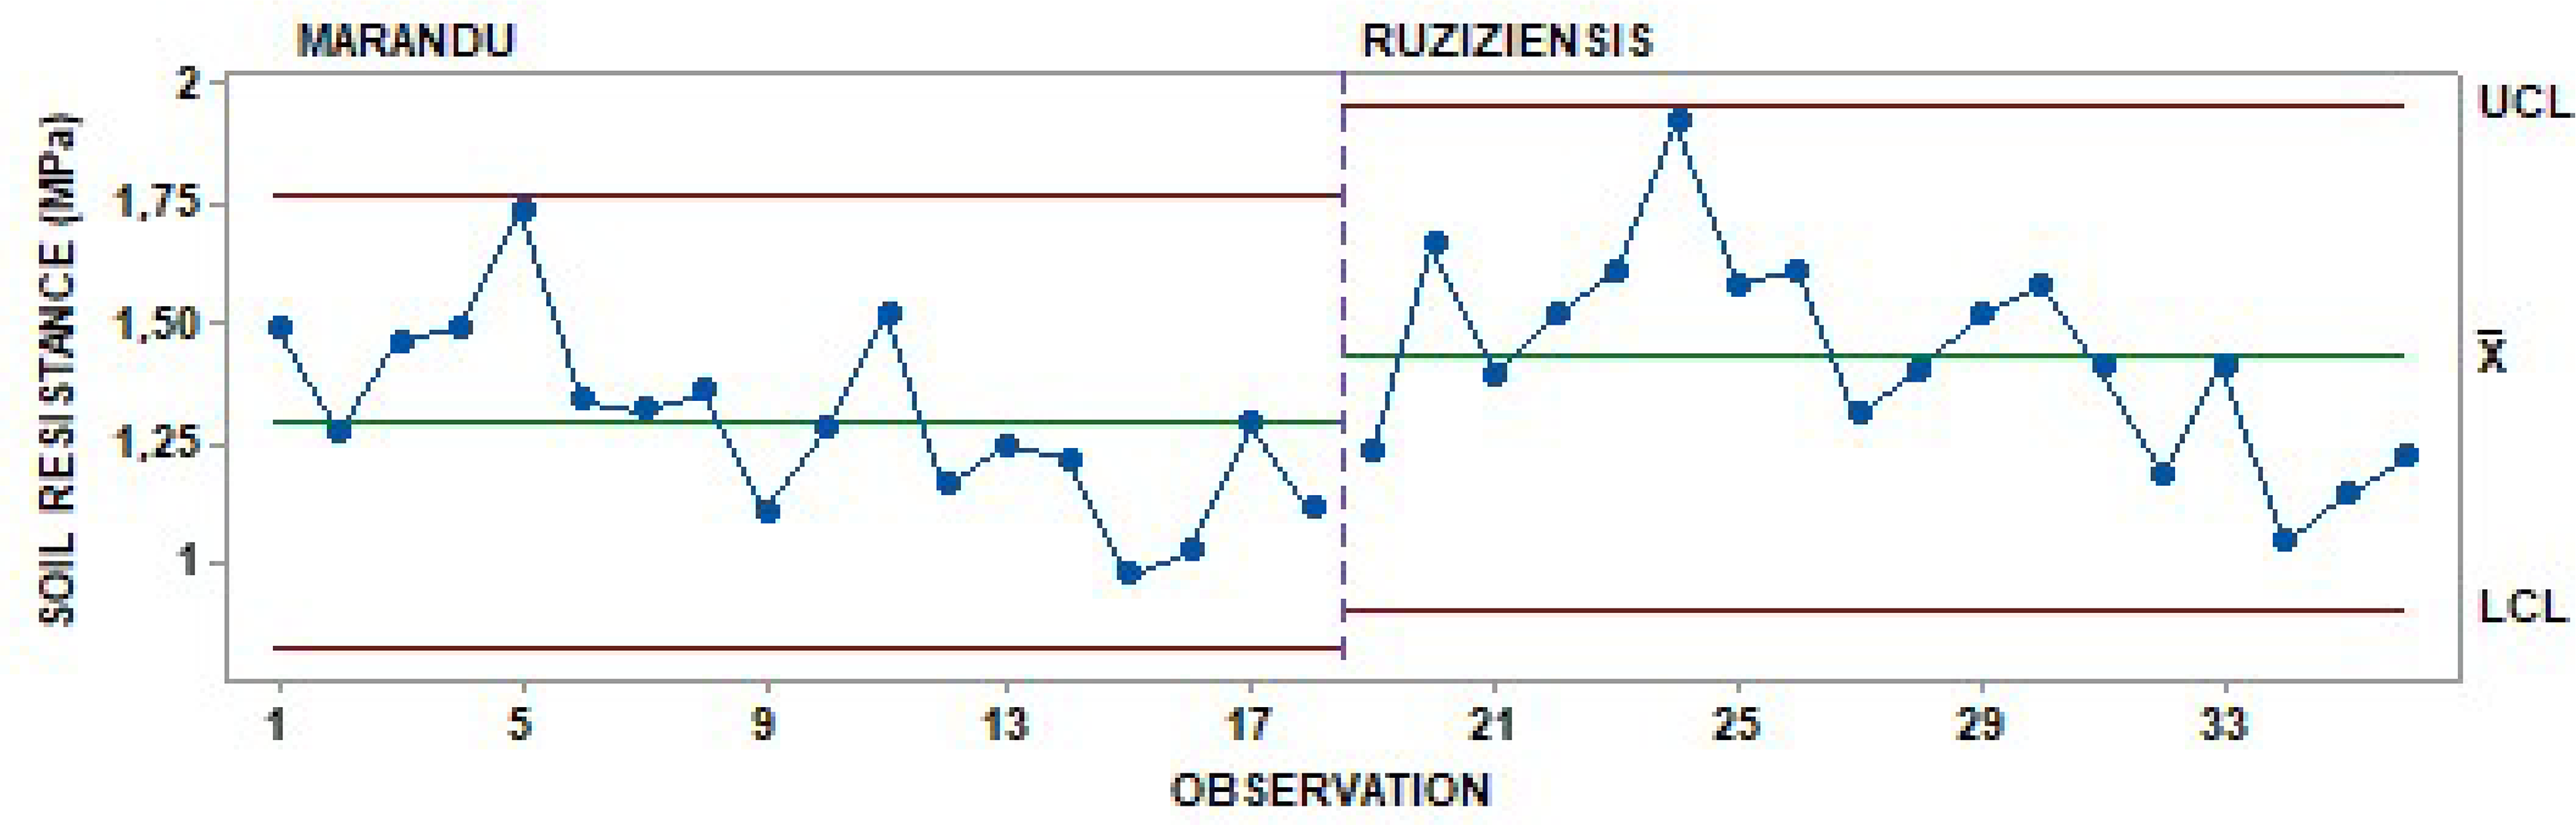
Figure 3 shows the individual value control charts for soil resistance in no-till system with C1 and C2 straw. The area occupied by C2 straw had greater variability than that occupied by C1 straw, with points 5 and 25 standing out with 1.75 MPa and 1.95 MPa, respectively. However, both materials were beneficial in terms of soil conservation aspects.

Control chart of individual soil resistance values (MPa), for the Urochloa brizantha cv. Marandu (C1) and Urochloa ruziziensis (C2) mulches.
According to Guimarães et al. (2013), critical soil resistance values can vary from 1.5–4.0 MPa, although values close to 2 MPa are accepted as impeding root growth. Thus, C1 and C2 showed that there were no out-of-control points, stabilizing the process for both straw types and demonstrating compliance with the limits proposed in the literature. Regarding soil temperature, there was greater uniformity and lower temperatures in C1, with an average soil temperature of 24.6 ºC (Figure 4). According to Mello et al. (2020), this can benefit the soybean crops during sowing and harvesting. Teodoro et al. (2021) added that the occurrence of adverse weather, such as low rainfall and high temperatures throughout the crop cycle could be mitigated by effective soil cover designed for conservation management in no-till systems.

Control chart of individual soil temperature values, under cover of Urochloa brizantha cv. Marandu (C1) and Urochloa ruziziensis (C2).
The control charts for soil moisture showed greater uniformity in C2 than in C1, which may have been related to the different straw volume (Figures 2 and 5).

Control chart of individual soil moisture values, for Urochloa brizantha cv. Marandu (C1) and Urochloa ruziziensis (C2) cover.
This higher uniformity in C2 may favor germination, as soil moisture is crucial for this physiological process. According to Soares & Krupek (2019), germination can be affected by water deficits, preventing emergence and growth. Mello et al. (2020) related that the relative humidity has a direct relationship with the soybean seeds moisture, as they are hygroscopic and require a balance with the environment.
Boxplot analysis of sowing quality
The variation in the results obtained between the sowing speed and mulch was visualized using boxplot graphs. The boxplots included observations between the second quartile (Q2) and third quartile (Q3), known as the interquartile range, with lines extending to the minimum and maximum values observed, as well as the mean and median.
For the sowing depth variable, at a sowing speed of 7 km h–1 and Urochloa brizantha cv. Marandu (C1) and Urochloa ruziziensis (C2) straw, the lower limit value was 1 cm, and the interquartile range was 2.9–4.9 cm (Figure 6). In addition, at 7 km h–1 there was a variation in sowing depths of 3.8 cm and 4.0 cm, with a median of 3.6 cm and 3.8 cm, for C1 and C2, respectively.

Boxplot of seeding depth under different seeding speeds (7.0 and 8.5 km h-1) and Urochloa sp. cover crops (C1 - Urochloa brizantha cv. Marandu, C2 - Urochloa ruziziensis).
At a sowing speed of 8.5 km h–1 there was more variability in the database, with C1 showing variations in the lower (2.0 cm) and upper (9.0 cm) depth limits, with an interquartile range of 3.5–5.5 cm. There was an outlier in C1, in which the sowing depth exceeded the upper limit of 9.0 cm (Figure 6). This may have been due to operational failures during the sowing process. According to Barbosa et al. (2018), the presence of outliers, whose atypical values are far removed from the data set, may indicate an abnormality arising from mechanical, climatological or pedological processes during the sowing process. Morettin & Toloi (2006) mentioned that outliers can be significant in the obtained results and have a significant influence; thus, they may not be generated only by random errors, and can mask a statistical control assessment.
C2 had a lower and upper depth limit of 1.4 cm and 8.3 cm, with an interquartile range of 2.5–3.5 cm at a sowing speed of 8.5 km h–1. However, there was a significant increase in outliers in C2 compared to C1, which can be explained by the different straw volume and increase in operating speed. At 7 km h–1 for C1 and C2 there was symmetry; however, with an increase to 8.5 km h–1 there may be greater instability (Figure 6). Regarding acceptable longitudinal distribution, sowing of C1 and C2 at 7 km h-1 showed less amplitude in the data compared to 8.5 km h–1. At 7 km h–1 sowing of C1 had a lower limit of 22% and an upper limit of 88%, with an interquartile range of 59.0–83.5%, a mean of 69.3%, and a median of 74.5%. C2 showed an increase of 6.4% in the mean and 8.1% in the median for acceptable longitudinal distribution (Figure 7).

Boxplot of longitudinal distribution in relation to acceptable seed spacing, under different sowing speeds (7.0 and 8.5 km h-1) and Urochloa sp. mulches (C1 - Urochloa brizantha cv. Marandu, C2 - Urochloa ruziziensis).
Sowing of C1 at 8.5 km h–1 had a lower limit of 22.0% and the upper limit of 92.0%, with an interquartile range of 44.0–71.5%, mean of 57.0%, and median of 58.0%. C2 had a lower limit of 18.0% and an upper limit of 88.0%, with an interquartile range of 47.5–81.0%, mean of 63.2%, and median of 70.0%. As the speed of the sowing process increased, the range and percentage of acceptable seeds increased (Figure 7).
In relation to the double spacing in the longitudinal distribution, sowing at 8.5 km h–1 showed higher rates of double spacing for C1 and C2, with upper limits of up to 25.0% when compared to that at 7 km h–1. There was a 44.0% reduction in double spacings, which corroborates the premise observed in the acceptable longitudinal distribution, where an increase in sowing speed led to the double spacing and sowing failures (Figure 8).

Boxplot of longitudinal distribution in relation to double seed spacing, under different sowing speeds (7.0 and 8.5 km h-1) and Urochloa sp. mulches (C1 - Urochloa brizantha cv. Marandu, C2 - Urochloa ruziziensis).
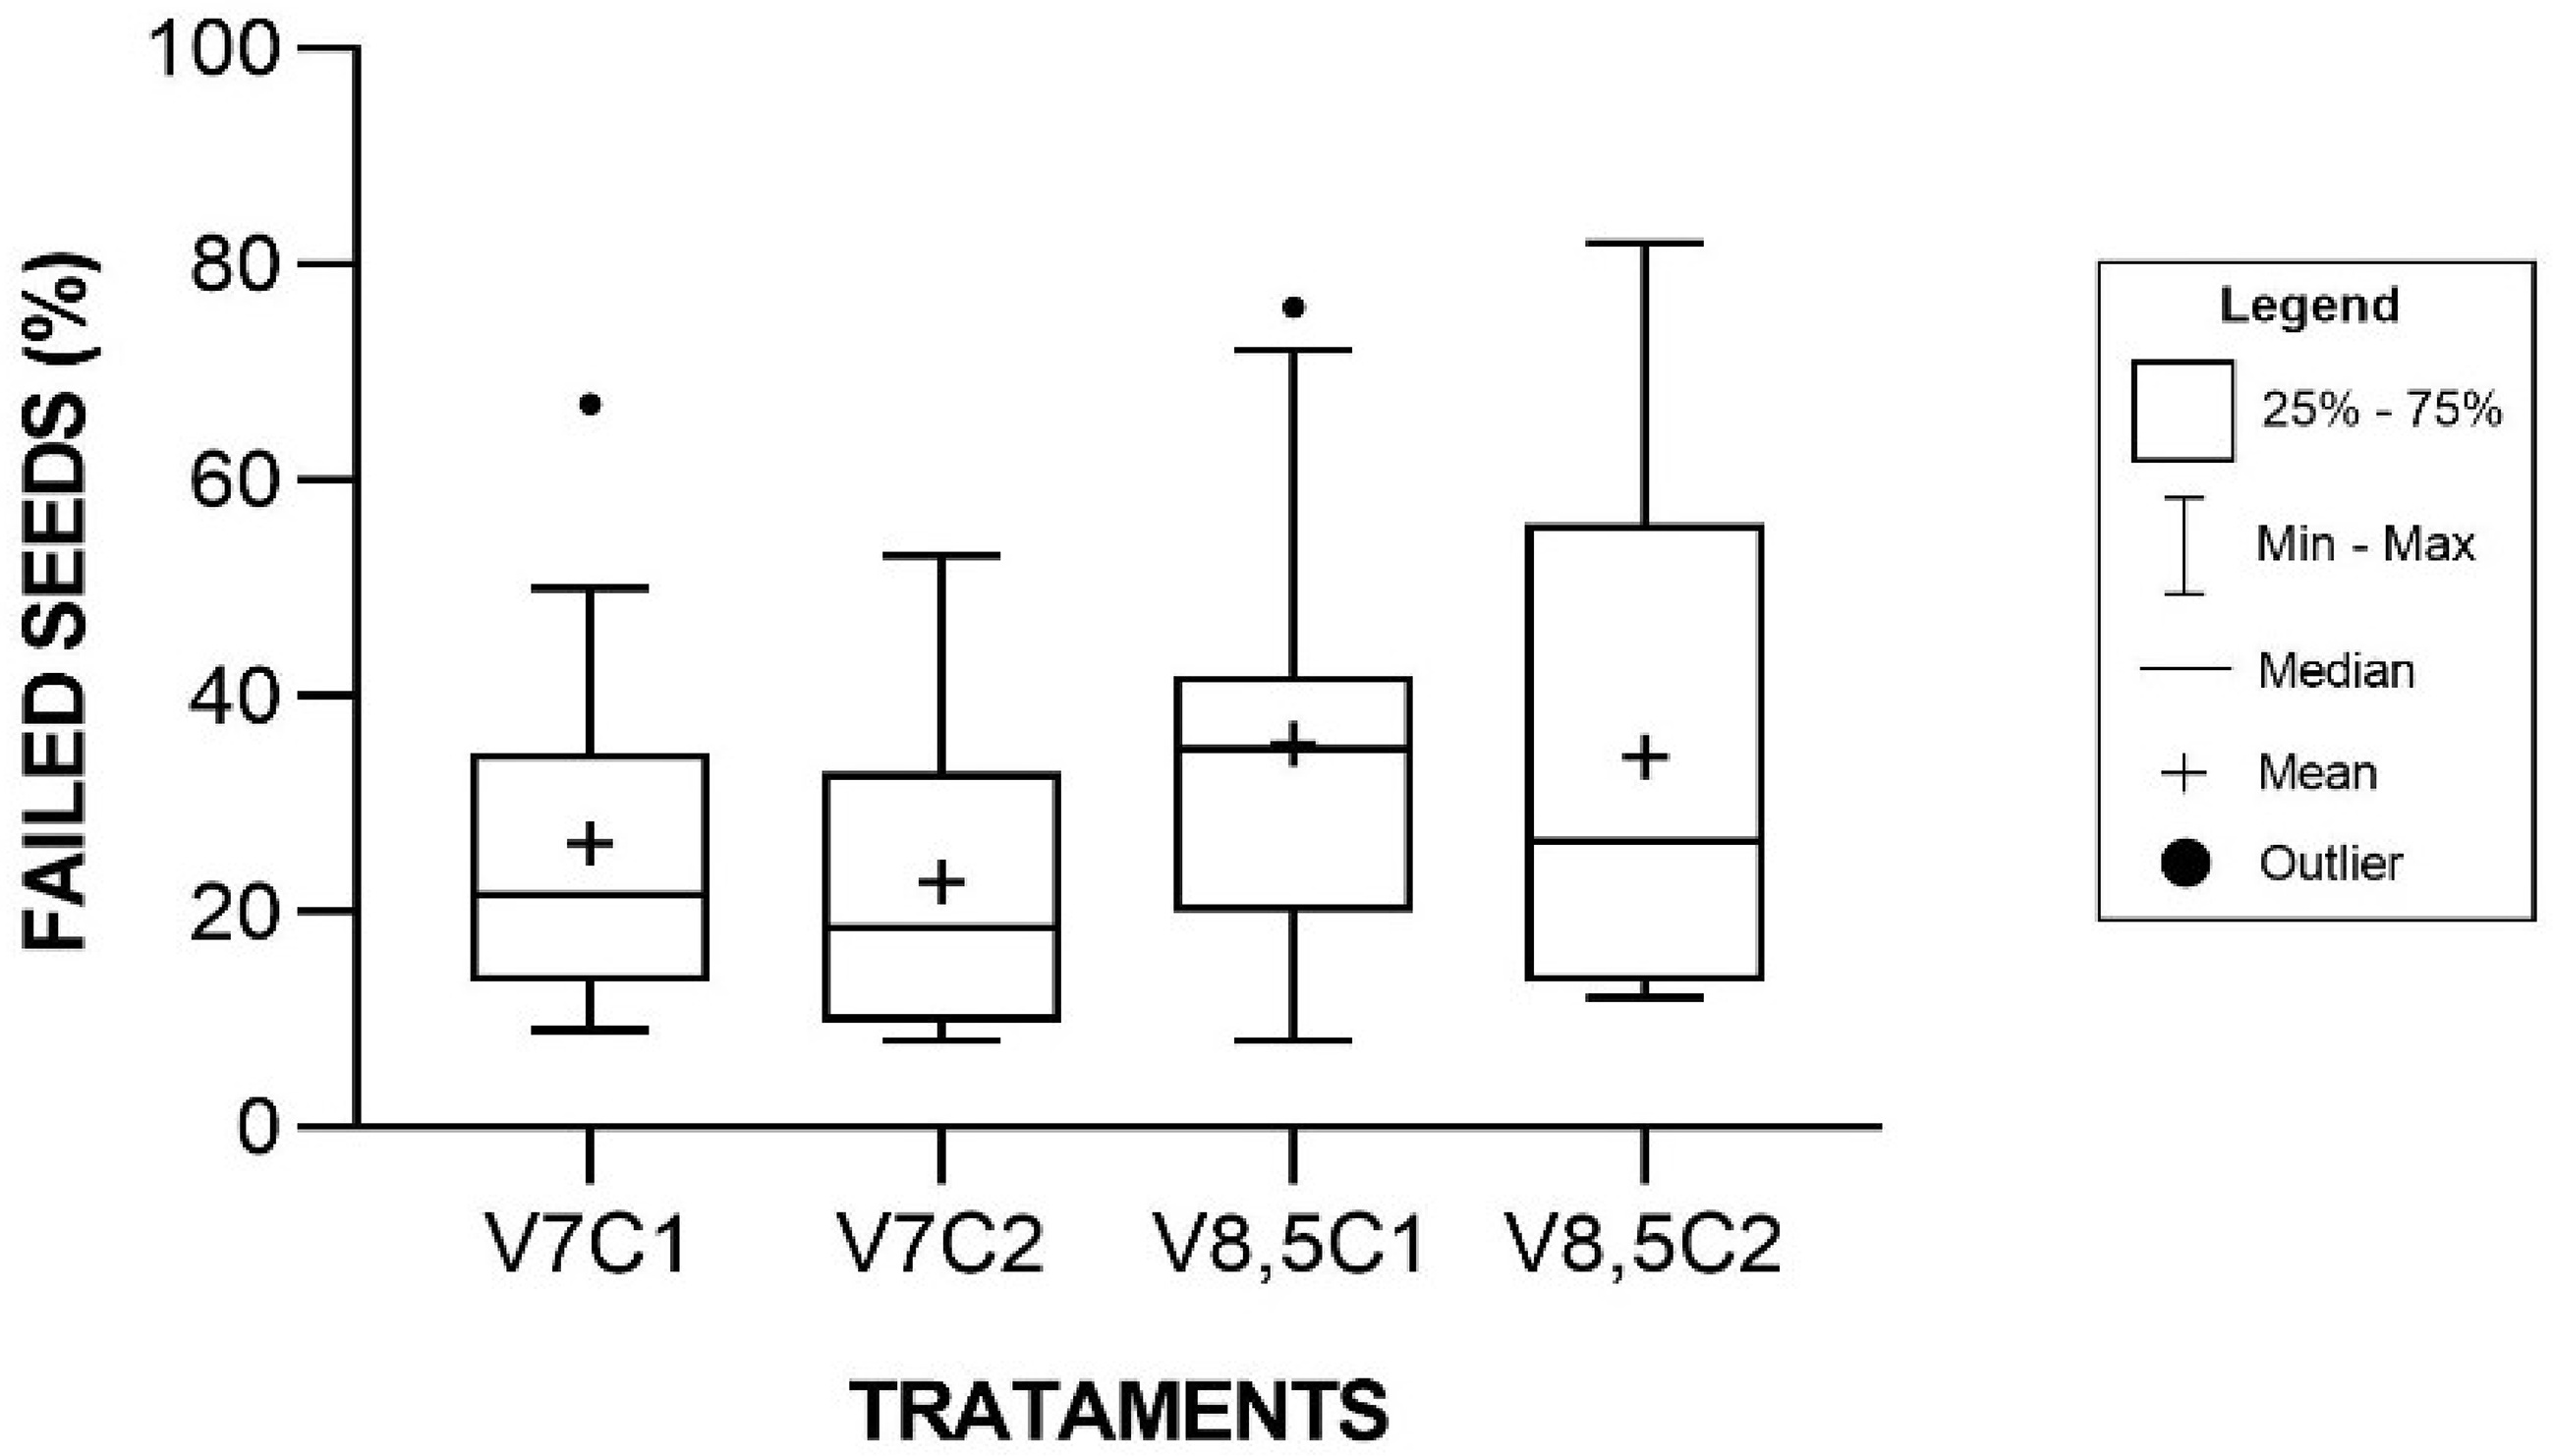
Sowing at 7 km h–1 resulted in a lowestfailed spacing in the longitudinal distribution. In C1, the lower limit was 9% and the upper limit was 67%, with an interquartile range of 13.8–34.5%. The average of failed spacings was estimated to 26.3% and the median was 21.5%. In C2, the data set was similar and there were no outliers. The interquartile range was 10.0–32.8%, with a slight reduction than C1 (Figure 9).

Boxplot of longitudinal distribution in relation to seed spacing failures, under different sowing speeds (7.0 and 8.5 km h-1) and Urochloa sp. mulches (C1 - Urochloa brizantha cv. Marandu, C2 - Urochloa ruziziensis).
However, sowing at 8.5 km h–1 showed a greater amplitude of the database, with the lower and upper limits estimated at 8.0 and 76.0%, respectively. In C1, the interquartile range was 20.3–41.8%, similar to those observed at 7 km h–1 in C1 and C2. However, they had an average of 35.6% and median of 35.0% failed spacings in longitudinal distribution. Regarding C2, sowing at 8.5 km h–1 produced a wider interquartile range, estimated at between 13.8% and 55.8%, with an average of 34.3% and median of 26.5% (Figure 9).
Analysis of seeding quality using control charts
Regarding the depth, both sowing speeds had out-of-control points in C1, indicating an operational instability. The desiccation of C1 at the same herbicide dose as C2, as well as its cespitose growth habit, may have caused the higher variability in C1 at 8.5 km h–1 (Figure 10).

Control charts of individual values of transverse distance (depth) of seeds, under different sowing speeds (7.0 and 8.5 km h-1) and Urochloa sp. mulches (C1 - Urochloa brizantha cv. Marandu, C2 - Urochloa ruziziensis).
As the sowing speed increased, the variability in deposition also increased, reaching maximum of 7.3 cm depht, which is high and above the ideal values found in the literature. Thus, they were significantly upper than the desired standard for the operation (3 cm) (Figure 10A). In C2, both sowing speeds indicated a failure in operational quality, but variability decreased when the machine sowed at 8.5 km h–1, showing better uniformity compared to the average (Figure 10B).
Figure 11 shows the control charts for acceptable spacing at sowing speeds of 7.0 and 8.5 km h–1, for C1 and C2 straw. In C1, there was an increase in variability when from the sowing speed increased from 7.0 km h–1 to 8.5 km h–1, but the process remained stable with little out-of-control points, which is consistent the results of Bortoli et al. (2021).

Control charts for longitudinal distribution of acceptable seeds under different sowing speeds (7.0 and 8.5 km h-1) and Urochloa sp. mulches (C1 - Urochloa brizantha cv. Marandu, C2 - Urochloa ruziziensis).
At 8.5 km h-1, C2 had one out-of-control point; point 30, which was below the control limit, with a value of 24.4%. This could be explained by operational failures or variations in the field (Figure 11).
Figure 12 shows the charts of the double spacing. For C1, at 7 km h–1, there was less variability, reflecting better operational quality and points closer to the average. However, for C1, at 8.5 km h–1, there was a high variability, with points far from the average.

Control charts for the longitudinal distribution of double seeds under different sowing speeds (7.0 and 8.5 km h-1) and Urochloa sp. mulches (C1 - Urochloa brizantha cv. Marandu, C2 - Urochloa ruziziensis).
At 7.0 km h–1 the C2 was the most stable, showing low variability, with no points outside the control limits. At 8.5 km h–1, the start of the operation was stable, but its variability increased between points 24 and 29 (Figure 12). These results corroborate those of Correia et al. (2020), who found that double spacing increased as the operating speed increased. According to them, this causes gaps in the seeding lines, which favors competition between the plants. In the control charts for seed distribution failures, it was observed that sowing at 7.0 km h–1 for both C1 and C2, caused fluctuations at most of the points close to the center line, with no points outside the control limit (Figure 13).

Control charts for longitudinal distribution of seed failures under different sowing speeds (7.0 and 8.5 km h-1) and Urochloa sp. mulches (C1 - Urochloa brizantha cv. Marandu, C2 - Urochloa ruziziensis).
In contrast, speed influenced C2, with one point outside the upper limit (point 30), and with 75.8% of the failures spacing at 8.5 km h–1 (Figure 13). Carper et al. (2017) suggested that it is extremely important to conduct periodic maintenance of equipment to reduce failures and obtain a uniform standard in the field, especially when the operating speed increases.
Figure 14 shows the germination percentages in C1 and C2, corresponding to the sowing speed at 7 km h–1. In C1, the germination percentage was highly variable; however, there were no out-of-control points. In C2, there was less variability and points fluctuated around the average, showing a better germination percentage over the study period. This may be related to the sowing quality at 7.0 km h–1, more uniform straw, lower temperature, and higher soil moisture in C2.

Control charts of individual germination values at a speed of 7.0 km h-1, under different Urochloa sp. mulches (C1 - Urochloa brizantha cv. Marandu, C2 - Urochloa ruziziensis).
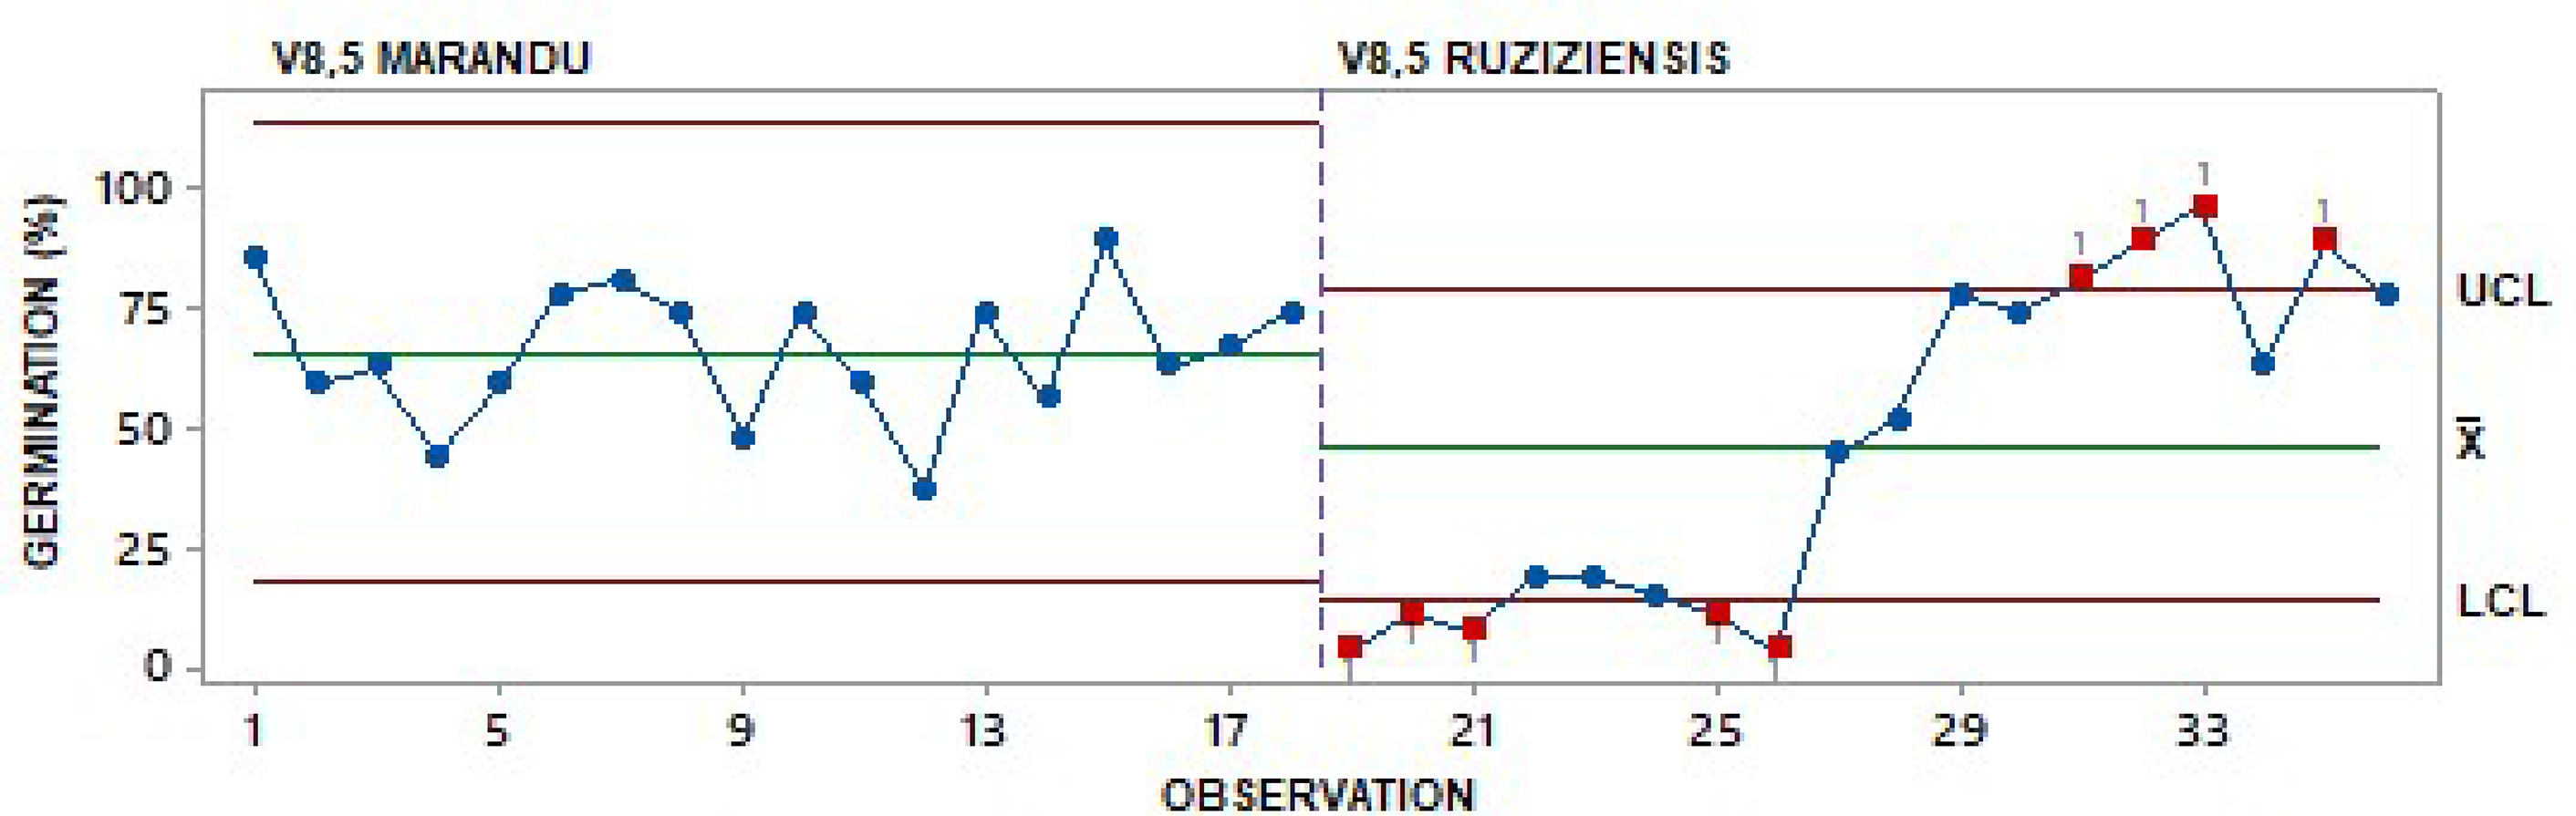
At 8.5 km h–1, there was a high variability in both C1 and C2, with the presence of out-of-control points at the beginning and end of the operation in C2 (Figure 15). This is possibly a result of operational failures that included a more heterogeneous depth and above the recommended limit (3 cm) at 8.5 km h–1 in C1 and C2 (Figure 15).

Control charts of individual germination values at a speed of 8.5 km h-1, under different Urochloa sp. mulches (C1 - Urochloa brizantha cv. Marandu, C2 - Urochloa ruziziensis).
Soybean yield
At 7 km h–1, C1 showed a lower limit of 3,147 kg ha–1 and an upper limit of 4,224 kg ha–1, with an interquartile range of 3,348–4,205 kg ha–1, an average yield of 3,742 kg ha–1, and a median of 3,604 kg ha–1. In C2 there was a reduction in the amplitude of the yield database, with a lower limit of 3,015 kg ha-1 and an upper limit of 3,763 kg ha-1, an average of 3,571 kg ha-1, and a median of 3,704 kg ha-1 (Figure 16).

Boxplot of productivity under different sowing speeds (7.0 and 8.5 km h-1) and Urochloa sp. mulches (C1 - Urochloa brizantha cv. Marandu, C2 - Urochloa ruziziensis).
At 8.5 km h–1, C1 showed a low amplitude in the yield database. The lower limit was 3,447 kg ha–1 and the upper limit was 4,021 kg ha–1, with an average of 3,703 kg ha-1, and a median of 3,662 kg ha-1. In contrast, C2 showed more variability with a lower limit of 2,706 kg ha-1 and an upper limit of 4,185 kg ha-1, an interquartile range of 2709–3792 kg ha-1, and an average yield of 3,247 kg ha-1.
CONCLUSIONS
Urochloa ruziziensis provided a more uniform soil cover and moisture than U. brizantha cv. Marandu, but with less biomass (straw). Sowing speeds of 7.0 km h–1 and 8.5 km h–1 are both recommended for Urochloa ruziziensis. However in a no-till system with U. brizantha cv. Marandu straw is recommended to use a sowing speed of 7.0 km h–1.
REFERÊNCIAS
-
Andrade AT, Torres JLR, Paes JMV, Teixeira CM, Condé ABT (2018) Desafios do sistema plantio direto no Cerrado. Informe Agropecuário EMBRAPA. Available: https://www.researchgate.net/publication/329451343_Desafios_do_Sistema_Plantio_Direto_no_Cerrado Accessed Jan 12, 2023.
» https://www.researchgate.net/publication/329451343_Desafios_do_Sistema_Plantio_Direto_no_Cerrado -
Barbosa JJ, Pereira TM, Oliveira FLP de (2018) Uma proposta para identificação de outliers multivariados. Ciência e Natura 40(40): 2-9. https://doi.org/10.5902/2179460X29535
» https://doi.org/10.5902/2179460X29535 -
Bortoli LF, Arismendi GDA, Ferreira MM, Martin TN (2021) Sowing speed can affect distribution and yield of soybean. Australian Journal of Crop Science 15(1):16-22. https://doi.org/10.21475/ajcs.21.15.01.2238
» https://doi.org/10.21475/ajcs.21.15.01.2238 -
Carper DP, Alonço AS, Francetto TR, Franck CJ, Belle MP, Machado ODC (2017) Effect of different conductor tubes on the longitudinal distribution of soybean seeds. Revista Brasileira de Engenharia Agrícola e Ambiental 21(9): 657-662. http://dx.doi.org/10.1590/1807-1929/agriambi.v21n9p657-662
» http://dx.doi.org/10.1590/1807-1929/agriambi.v21n9p657-662 -
Chaveiro AC, Bonini CSB, Freitas PGN, Reis DCS, Oliveira JMK, Souza JAL, Hidalgo GF, Oliveira AB (2022) Qualidade física e química do solo em plantio direto cultivado com hortaliças - Uma revisão. Pesquisa, Sociedade e Desenvolvimento 11(9): 1-12. http://dx.doi.org/10.33448/rsd-v11i9.31564
» http://dx.doi.org/10.33448/rsd-v11i9.31564 -
Chen K, Wang Y, Zhang R, Zhang H, Gao C (2019) CRISPR/Cas genome editing and precision plant breeding in agriculture. Annual Review of Plant Biology 70(1): 667-697. https://doi.org/10.1146/annurev-arplant-050718-100049
» https://doi.org/10.1146/annurev-arplant-050718-100049 -
Copetti E (2015) Os desafios da semeadura. Revista SEEDNews. Available: https://seednewscom.br/artigos/923-os-desafios-da-semeadura-edicao-janeiro-2015 Accessed Jan 29, 2023.
» https://seednewscom.br/artigos/923-os-desafios-da-semeadura-edicao-janeiro-2015 -
Correia TPS, Lopes AGC, Faggion F, Silva PRA, Sousa SFG (2020) Semeadura de soja em função de mecanismos dosadores e velocidade operacional. Energia na Agricultura 35(2): 190-198. http://dx.doi.org/10.17224/EnergAgric.2020v35n2p190-198
» http://dx.doi.org/10.17224/EnergAgric.2020v35n2p190-198 -
Cortez JW, Moreno CTM, Farinha LS, Arcoverde SNS, Valente IQM (2019) Variabilidade espacial da resistência do solo à penetração em um sistema de semeadura direta. Científica 47(2): 175-182. http://dx.doi.org/10.15361/1984-5529.2019v47n2p175-182
» http://dx.doi.org/10.15361/1984-5529.2019v47n2p175-182 -
Dantas JS, Marques Júnior J, Martins Filho MV, Resende JM do A, Camargo LA, Barbosa RS (2014) Gênese de solos coesos do Leste Maranhense: relação solo paisagem. Revista Brasileira de Ciência do Solo 38:1039-1050. http://dx.doi.org/10.1590/S0100-06832014000400001
» http://dx.doi.org/10.1590/S0100-06832014000400001 -
Guimarães RML, Tormena CA, Blainski É, Fidalski J (2013) Intervalo hídrico ótimo para avaliação da degradação física do solo. Revista Brasileira de Ciência do Solo 37(6): 1512-1521. https://doi.org/10.1590/S0100-06832013000600008
» https://doi.org/10.1590/S0100-06832013000600008 -
Jasper R, Jasper M, Assumpção PSM, Rocil J, Garcia LC (2013) Velocidade de semeadura da soja. Engenharia Agrícola 31(1): 102-110. https://doi.org/10.1590/0034-737X202269060015
» https://doi.org/10.1590/0034-737X202269060015 -
Kurachi SAH, Costa JADS, Bernardi JÁ, Coelho JLD, Silveira GMD (1989) Avaliação tecnológica de semeadoras e/ou adubadoras: tratamento de dados de ensaios e regularidade de distribuição longitudinal de sementes. Bragantia 48(2): 249-262. https://doi.org/10.1590/S0006-87051989000200011
» https://doi.org/10.1590/S0006-87051989000200011 -
Lenhardt ER, Feldmann NA, Mühl RF, Cassol PS (2022) Influência de diferentes velocidades de semeadura na produtividade da soja. Revista Inovação: Gestão e Tecnologia no Agronegócio Available: https://revistas.uceff.edu.br/inovacao/issue/view/3 Accessed Fev 01, 2023.
» https://revistas.uceff.edu.br/inovacao/issue/view/3 -
Lim, SAH, Antony J, Albliwi S (2014) Statistical Process Control (SPC) in the food industry-A systematic review and future research agenda. Trends in Food Science & Technology 37(2):137-151. https://doi.org/10.1016/J.TIFS.2014.03.010
» https://doi.org/10.1016/J.TIFS.2014.03.010 -
Maguire JD (1962) Speed of germination-aind in selection and evaluation for seedling emergence and vigor. Crop Science 2(2):176-177. https://doi.org/10.2135/cropsci1962.0011183X000200020033x
» https://doi.org/10.2135/cropsci1962.0011183X000200020033x -
Mello BFFR, Binotti FFS, Zoz EC (2020) Hidratação em sementes de soja por atmosfera úmida em diferentes temperaturas na reestruturação de membranas. In: Cultivando Saber. Available: https://www.researchgate.net/publication/343892876_Hidratacao_em_sementes_de_soja_por_atmosfera_umida_em_diferentes_temperaturas_na_reestruturacao_de_membranas Accessed Fev 01, 2023.
» https://www.researchgate.net/publication/343892876_Hidratacao_em_sementes_de_soja_por_atmosfera_umida_em_diferentes_temperaturas_na_reestruturacao_de_membranas -
Morettin PA, Toloi C (2006) Análise de séries temporais. Available: https://www.researchgate.net/publication/264971369_Analise_de_Series_Temporais#:~:text=A%20análise%20de%20séries%20temporais%20consiste%20em%20procurar,%28MORETTIN%20%26%20TOLOI%2C%202006%3B%20BAYER%20%26%20SOUZA%2C%202010%29 Accessed Jan 16, 2023.
» https://www.researchgate.net/publication/264971369_Analise_de_Series_Temporais#:~:text=A%20análise%20de%20séries%20temporais%20consiste%20em%20procurar,%28MORETTIN%20%26%20TOLOI%2C%202006%3B%20BAYER%20%26%20SOUZA%2C%202010%29 -
Passos MLV, Zambrzycki GC, Pereira RS (2016) Balanço hídrico e classificação climática para uma determinada região de Chapadinha-MA. Revista Brasileira de Agricultura Irrigada 10(4): 758-766. https://doi.org/10.7127/rbai.v10n400402
» https://doi.org/10.7127/rbai.v10n400402 -
Petrovic B, Bumbalek R, Zoubek T, Kunes R, Smutny L, Bartos P (2024) Application of precision agriculture technologies in Central Europe-review. Journal of Agriculture and Food Research 15(1): 1-10. https://doi.org/10.1016/j.jafr.2024.101048
» https://doi.org/10.1016/j.jafr.2024.101048 -
Salomão PEA, Kriebel W, Santos AA, Martins, ACE (2020) A importância do sistema de plantio direto na palha para reestruturação do solo e restauração da matéria orgânica. Research, Society and Development 9(1):1-21. https://doi.org/10.33448/rsd-v9i1.1870
» https://doi.org/10.33448/rsd-v9i1.1870 -
Silva VT, Gava R, Cotrim MF, Wassolowski CR, Teodoro PE, Snyder RL (2020) Manejo de irrigação na cultura da soja em sistema de semeadura direta, sobre restos culturais de Brachiaria ruziziensis. Research, Society and Development 9(6): 1-23. https://doi.org/10.33448/rsd-v9i6.3430
» https://doi.org/10.33448/rsd-v9i6.3430 -
Soares SL, Krupek RA (2019) Efeito da disponibilidade hídrica sobre a germinação de sementes de Araucaria angustifolia (Berth.) O. Kuntze. Revista Brasileira de Biociências 17(2). Available: https://Efeito+da+disponibilidade+hídrica+sobre+a+germinação+de+sementes+de+Araucaria+angustifolia+(Berth.)+O.+Kuntze.+Revista+Brasileira+de+Biociências+&u=a1aHR0cHM6Ly9zZWVyLnVmcmdzLmJyL2luZGV4LnBocC9yYnJhc2Jpb2NpL2FydGljbGUvZG93bmxvYWQvMTE0NTgyLzYxODg4LzA&ntb=1 Accessed Jan 21, 2023.
» https://Efeito+da+disponibilidade+hídrica+sobre+a+germinação+de+sementes+de+Araucaria+angustifolia+(Berth.)+O.+Kuntze.+Revista+Brasileira+de+Biociências+&u=a1aHR0cHM6Ly9zZWVyLnVmcmdzLmJyL2luZGV4LnBocC9yYnJhc2Jpb2NpL2FydGljbGUvZG93bmxvYWQvMTE0NTgyLzYxODg4LzA&ntb=1 -
Teodoro MS, Araújo FS, Barroso JR, Freitas L de O (2021) Efeito residual de coberturas em pré-plantio no cultivo da mandioca em LATOSSOLO AMARELO Distrófico no Piauí. Agrarian 14(52):213-222. https://doi.org/10.30612/agrarian.v14i52.11227
» https://doi.org/10.30612/agrarian.v14i52.11227
Edited by
-
Area Editor:
Renildo Luiz Mion