 INTEGRATED SURGERY PLANNING AND BED ALLOCATION WITH MULTIPLE ROUTES OF POST-SURGICAL CARE, WITH APPLICATION TO A MILITARY HOSPITAL’S ORTHOPAEDIC DEPARTMENT
ABSTRACT
This paper presents na integrated surgery scheduling and post-surgical bed planning problem for a standard hospital setting. The setting gives rise to a general healthcare modelling problem with a number of innovations with respect to the literature. The model includes multiple post-surgical recovery trajectories involving possible stays at the intensive (ICU) or semi-intensive care unit (SICU) and allows the decision maker to assign a bed allocation plan that considers the maximum length of stays at both SICU and ICU. The approach is designed to ensure a seamless patient flow, avoiding surgery cancellations due to insufficient downstream resources, and enables tactical planning that considers the long-term balance between demand and surgery provision across all specialities. To validate the model and investigate the sensitivity with respect to model parameters and the availability of resources, we use a series of experiments that were based on the actual operation of a military hospital’s orthopaedic department. The results illustrate the demand pressures, as na optimised allocation with the current demand and resources results in na occupation of 96.5%. We also show that increases in demand should be matched by a similar percentage increase in operating theatre capacity in order to keep the occupation below 100%.
Keywords:
healthcare modelling; master surgery scheduling; mathematical programming; integrated surgery planning
1 INTRODUCTION
The need to properly plan and manage resource intensive hospital services such as surgery provision has been accentuated by the combination of ageing populations and limited budgets across the globe (e.g., Cylus et al., 2022). Indeed, the literature on surgery scheduling has steadily increased over the last decade and it includes a number of important literature reviews on the topic (Demeulemeester et al., 2013; Samudra et al., 2016; Wang et al., 2021). However, since this is a complex problem, some specific issues still remain under-explored or unaddressed. Integrated tactical planning covering both upstream (e.g., perioperative tests) and downstream resources (e.g., post-surgical beds at different recovery units) is an example of the former (Wang et al., 2021; Harris & Claudio, 2022); as well as the gap between theory and practice mentioned by Wang et al. (2021). In contrast, tactical planning considering the integration of multiple post surgical units across distinct hospital recovery pathways is an example of the latter. Also lacking is a focus on co-designing the model with the healthcare partners considering the real-world need for decision support, with a view to generating informative but parsimonious models that can be readily understood and adopted by medical practitioners. We argue that this is an essential step to bridge the gap between theory and practice, as quite often the models in the literature are very complex, yet also insufficient to provide the actual decision support needed in a real-world application (Wang et al., 2021).
Among the models that consider some sort of post-surgical stay, an important issue is model complexity and the required computational burden. This complexity often grows as a function of the maximum overall post-surgical length of stay (e.g., Fügener et al., 2014; Santos & Marques, 2022), thereby hindering the model’s applicability to post-surgical stays comprising multiple distinct units.
This paper proposes a general model that integrates surgery scheduling and bed allocation, with a number distinguishing characteristics and novel contributions to the literature. Firstly, it tackles an integrated surgery scheduling and bed planning problem that covers the whole patient trajectory, from surgery to discharge, whilst covering multiple recovery pathways that may include intensive (ICU) or semi-intensive (SICU) care prior to the final recovery in the Ward and posterior hospital discharge. In contrast to the previous literature (e.g., Fügener et al., 2014; Schneider et al., 2020), however, the model remains parsimonious and its complexity does not grow with the length of stay in the Ward. This is attained via an innovative flow formulation that, unlike previous formulations derived from (Fügener et al., 2014; Fügener, 2015), need not consider the maximum patient stay across the post-surgical units. Instead, we need only consider the maximum stay at either ICU or SICU to ensure that these vital units are planned accordingly and do not hinder the flow of patients. The flow formulation is well suited to the large patient volumes and longer stays at the ward, as these combine to produce a more stable and predictable output process that can be modelled via steady-state flow equations. This results in a model that is simple enough to seamlessly deal with the longer patient stays at the Ward, while informative enough to provide the required decision support to the decision makers.
Secondly, the model combines open block surgery scheduling, that allows different specialities to share operating theatres, with bed capacity allocation at all three recovery units (ICU, SICU and Ward) to balance input and output patient flows; and it does so by considering the empirical distribution of the lengths of stay at ICU and SICU, thus introducing some robustness to the downstream planning. Thirdly, the weekly schedule is integrated with the downstream capacity planning to ensure that the surgery plans remain viable whilst demand and capacity constraints make sure that the capacity exceeds the demand for all surgical specialties, thereby integrating tactical planning with the hospital’s long-term objective of decreasing the waiting queues. This is vital to provide a better management of post-surgical flows, as the lack of an integrated planning is known to generate additional challenges at the operational level, especially in the ICU and SICU (Heider et al., 2022).
Bridging theory and practice, the present study is applied to a military hospital in Rio de Janeiro, Brazil. The hospital partner required decision support with their tactical elective surgery scheduling planning for the orthopaedic centre. However, although their surgical pathways follow a standard setting, the literature lacked an integrated surgery scheduling and bed planning approach considering the post-surgical interaction between ICU, SICU and the Ward, a further evidence of the gap between theory and practice in the field. Hence, a new modelling approach was required, which was co-designed with the healthcare partner to better fit their decision support needs, while remaining simple enough to be readily understood and utilised in practice. It is this new modelling approach that we introduce in this study. The next subsection briefly discusses the hospital setting.
1.1 The case study setting
The centre for orthopaedic surgeries at the hospital partner is a leading regional centre of its kind, with a large demand for elective surgeries and a waiting queue which currently holds about 750 surgical patients. Due to the size of the waiting queue, one of the concerns of the tactical planning to be proposed is that it generates a schedule with some excess capacity relatively balanced across the medical specialities, to make sure that the waiting queue for each speciality will decrease in the long-term. It is perhaps worth mentioning here that, in public health systems such as Brazil’s and the UK’s (the latter with a current queue of over 7.5 million elective procedures (NHS, 2023) in England), improving efficiency is a means to improving patient flow, thereby ensuring improved service and reducing the surgery queues across all specialities. Consequently, we will focus on improving patient flow to meet the demand and reduce waiting times, which can only be achieved via integrated planning. This may contrast with the focus on hospital profitability that motivates a significant portion of the works in the area, see for example (Fügener, 2015; Moosavi & Ebrahimnejad, 2020).
The operating theatres are open from Monday to Friday, and are compatible with each of the seven orthopaedic specialities served at the hospital’s orthopaedic centre, namely: foot, hand, shoulder, knee, spine, hip, and paediatric. Figure 1 illustrates the entire flow from hospital referral to discharge, with the bottom part representing the flow at the surgical centre that is modelled in this study. Observe that, after surgery, the patient is transferred to the postoperative recovery centre, where he/she stays until he/she is ready for hospital discharge. The last two blocks in Figure 1 are detailed in Figure 2.


Notice that Figure 2 details the downstream processes, i.e., the post-surgical care provided by the orthopaedic centre. It is a general, albeit fairly standard setting that includes three different recovery units: the Intensive Care Unit (ICU), the Semi-Intensive Care Unit (SICU) - which is the hospital’s equivalent of a high-dependency unit (HDU) - and the Ward. To the best of our knowledge, this setting remains unaddressed in its entirety in the literature concerning tactical surgery scheduling. It generates a set of patient pathways that can include visits to either ICU or SICU prior to the final recovery at the Ward and subsequent discharge from hospital. While patients that do not require special care are immediately referred to the Ward, those that do will visit either the ICU or the SICU depending on their individual requirements. SICU receives patients that require special care but no permanent monitoring, whilst patients that require both will be referred to the ICU. It is worth mentioning that SICU and ICU are distinct units, which require distinct resources. Therefore, it was a consensus between modellers and healthcare partners that the model should consider them independently to provide more realistic and actionable real-life decision support.
The rest of the paper is structured as follows. The next section features a brief literature review that contrasts our approach to the related literature. Section 3 introduces the proposed mathematical model and explains its connection to the studied problem. To validate the proposed approach and to discuss its implications, Section 4 introduces a set of experiments based on the operation of the hospital partner. The experiments also analyse the variation of the resulting weekly surgery schedules and bed assignment plans with changes in the operating theatre capacity and in the model parameters. Finally, Section 5 concludes the paper.
2 LITERATURE REVIEW
The management of surgeries at the hospital level comprises two different classes of interrelated problems: surgery planning and surgery scheduling (Zhu et al., 2019; Akbarzadeh et al., 2019). Whilst planning typically involves determining a set of surgeries to be performed within a time horizon (e.g., Fügener et al., 2014; Fügener, 2015), surgery scheduling determines the exact schedule of patients that will have surgery at a given date (Akbarzadeh et al., 2019). These are widely studied problems that have been reviewed by several authors in recent years (e.g., Samudra et al., 2016; Gür & Eren, 2018; Zhu et al., 2019; Wang et al., 2021; Harris & Claudio, 2022). Like the majority of works in the area, this paper focuses on the planning of elective surgeries.
Surgery planning problems can be divided into three different decision levels: strategic, tactical and operational (e.g., Zhu et al., 2019; Wang et al., 2021; Harris & Claudio, 2022; Samudra et al., 2016). Issues at the strategic level have a long-term time horizon and aim to improve the use of available hospital resources and their distribution across medical teams (e.g., Choi & Wilhelm, 2014; Riise et al., 2016; Fügener et al., 2017). The tactical level looks at a medium-term horizon (e.g., Fügener, 2015; Penn et al., 2017; Britt et al., 2021; Heider et al., 2022) and aims to bridge the gap between the strategic and the operational level. The latter, in turn, has a short-term time horizon such as the scheduling of surgeries for a single day (e.g., Zhang et al., 2021; Younespour et al., 2019; Bam et al., 2017). This study addresses a tactical-level surgery planning problem.
At the tactical level, a surgery planning problem is often referred to as a Master Surgery Scheduling Problem (MSSP) and produces a cyclical schedule for assigning surgeries to different medical teams or specialities over a given period, which often amounts to one week (Fügener et al., 2014; Fügener, 2015; Schneider et al., 2020; Harris & Claudio, 2022). Many studies, however, consider only short-term performance measures aimed at maximising profit (Fügener, 2015) or reducing financial costs such as those related to the use of resources or professional labour (e.g., Fügener et al., 2014; Abedini et al., 2016; Dellaert & Jeunet, 2017; Roshanaei et al., 2017; Moosavi & Ebrahimnejad, 2020; Heider et al., 2022; Santos & Marques, 2022; Tayyab et al., 2023), ignoring long-term issues such as reducing waiting queues across surgical specialities. Our approach will link tactical planning with long-term goals by ensuring that the prescribed capacity for surgeries exceeds the demand across each individual speciality - a sufficient condition for the waiting queues’ long-term stability (Shortle et al., 2018).
Another important concept relates to the hospital’s strategic policy for assigning medical teams to operating theatres. There are two main classes of policies for sharing operating theatres, namely open block and closed block (e.g., Zhu et al., 2019; Wang et al., 2021; Harris & Claudio, 2022). Closed block policies assign each operating theatre (OT) for exclusive use by a single medical team for a prescribed length of time - often a day (e.g., Fügener et al., 2014; Fügener, 2015; Koppka et al., 2018; Guido & Conforti, 2017; Roshanaei et al., 2020; Zhu et al., 2020; Heider et al., 2022). In contrast, open block policies allow OTs to be shared between different medical teams or surgical specialities (e.g., Hashemi Doulabi et al., 2016; Roshanaei et al., 2017; Tayyab & Saif, 2022). Whilst open block policies involve additional management issues such as coordinating different medical teams or surgical specialities, they expand the number of possible configurations of surgery sessions and can therefore promote a better usage of the OT capacity (e.g., Siqueira et al., 2018; Britt et al., 2021). In our study, we chose the open block approach to allow greater flexibility in the assignment of surgeries and promote a better usage of the OTs, as open block policies are welcomed by our hospital partner. It is also worth mentioning that open block policies allow for a granular management of the number of weekly surgeries, thus aligning better with the long-term goal of decreasing the surgery queues and waiting times across all specialities. Consider, for example, a speciality with an average weekly demand of 4.5 surgeries and closed blocks comprising 4 surgeries within a MSS plan. Whilst one block is not enough to meet the demand, two blocks will imply a spare capacity of three surgeries a week for that speciality whilst blocking the equivalent surgery time for other specialities.
In terms of the types of models used in the problems, the majority of the literature use deterministic models (e.g., Dellaert & Jeunet, 2017; Zhu et al., 2020; Tayyab et al., 2023). Some researchers use stochastic modelling to account for uncertainties in the time required to perform each surgery (e.g., Dellaert & Jeunet, 2017; Makboul et al., 2022) or in the patient’s recovery time after surgery (e.g., Fügener et al., 2014; Fügener, 2015; Cappanera et al., 2014; Dellaert & Jeunet, 2017; Santos & Marques, 2022; Schneider et al., 2020; Moosavi & Ebrahimnejad, 2020). Mathematical programming is the most used solution method for tactical-level problems (Wang et al., 2021), but some authors also use simulation (Cappanera et al., 2014; Koppka et al., 2018). To reduce the computational time for finding satisfactory solutions, some authors use heuristics (Dellaert & Jeunet, 2017; Guido & Conforti, 2017; Zhu et al., 2020; Moosavi & Ebrahimnejad, 2020; Tayyab & Saif, 2022).
This paper introduces a tactical-level integrated surgery planning and bed management problem with a number of important characteristics that differentiate it from the previous literature. Similarly to Siqueira et al. (2018), we consider an integrated open block surgery planning problem which also assigns post-surgical beds to surgical specialities, with a view to improving the patient flow by optimising the use of downstream resources. To promote long-term equilibrium, the approach makes sure that the assigned number of weekly surgeries exceeds the demand over the same period for each surgical speciality. Our study innovates, however, by considering different routes of post-surgical recovery (see Figure 2) that include stays at either the intensive care unit (ICU) or the semi-intensive care unit (SICU). In contrast to previous works, which considered a single post-surgical route with a single step (Ward) or at most two sequential steps (ICU and Ward), our approach gives rise to multiple distinct and concurrent post-surgical trajectories (see Figure 3), each with its own probability. This creates additional modelling challenges that we address with a novel and hybrid approach that combines concepts of stochastic optimisation, robust optimisation, and flow modelling, as detailed in Section 3.

To the best of our knowledge, this is the first surgery planning approach that considers the flow of patients through a SICU - a link between the operating theatre and the ward that provides postoperative care for patients who do not require permanent monitoring, but still demand dedicated care (Ekeloef et al., 2019). Although previous literature considered the interplay between ICU and the ward in post-surgical care (e.g., Fügener et al., 2014; Fügener, 2015; Moosavi & Ebrahimnejad, 2020; Schneider et al., 2020; Santos & Marques, 2022), it is important to emphasise that SICU and ICU are distinct units that demand distinct levels of service and resources, therefore they should be planned separately.
Considering SICU and ICU into the patient flow model is important not only because it renders the model more realistic, but also due to the high financial cost of these units, whose demand comes mainly from the operating theatres (Heider et al., 2020), and because of the significant difference in costs and resources between ICU and SICU. Furthermore, the lack of postoperative ICU and SICU beds propagates in the system, causing surgery cancellations and potential delays in subsequent surgeries. Whilst some previous studies also considered the ICU in their model (e.g., Fügener et al., 2014; Fügener, 2015; Dellaert & Jeunet, 2017; Anjomshoa et al., 2018; Makboul et al., 2022; Tayyab et al., 2023), to the best of our knowledge the proposed model is the first to consider recovery routes that can include either an ICU or a SICU stay, each with a given probability that depends on the surgical speciality, giving rise to multiple post-surgical trajectories instead of the single post-surgical trajectory generally found in the literature. These multiple pathways also elongate the post-surgical stays, which hinders the application of previous modelling techniques, that grow in computational complexity depending on the maximum overall post-surgical length of stay (e.g., Fügener et al., 2014; Santos & Marques, 2022), as they are based on the enumeration of all possible post-surgical trajectories. Furthermore, while previous works considered fixed ICU capacities for each speciality, our model also prescribes the allocation of the available beds at each post-operative unit (SICU, ICU and Ward) to surgical specialities, to promote an optimised flow of patients. This is a significant distinction, as our approach derives an optimal bed allocation which improves the patient flow across all specialities and results in better surgery schedules. This is not possible in previous approaches, as they consider a fixed and prescribed bed allocation that does not necessarily make the best use of the available bed capacity.
From the modelling standpoint, the collaboration and co-design with healthcare partners allowed us to introduce a distinct approach that accounts for the whole post-surgical trajectory. Our model considers each day in the patient’s trajectory at both ICU and SICU, in order to adjust for the worst case scenarios and avoid surgery cancellations due to the lack of ICU or SICU beds. This means that the complexity of the model depends on the length of the stay of patients at the ICU and SICU units, which is generally limited. The Ward, however, allows a more flexible approach as the large patient volumes, added flexibility and longer stays result in a more predictable and less volatile flow of patients, thus enabling a simpler and less computationally demanding patient flow formulation at this unit. By doing that, we avoid the increased complexity of the traditional modelling approach that is based on the influential work of Fügener et al. (2014), which grows exponentially with the overall length of stay (including the Ward), rendering instances with relatively long recoveries virtually intractable.
Finally, another important contribution of the approach is that it ensures a balance between input and output at both the ICU and the SICU for each day of the planning horizon, by considering the overall length of stay at these units. This confers some robustness to the resulting surgery and bed allocation plans, with a view to improving patient flow and preventing surgery cancellations due to do the absence of downstream resources.
Table 1 summarises the proposed approach according to the main classifications discussed above and compares it to the related literature. Note that some papers address planning and scheduling separately (e.g., Agnetis et al., 2014; Vancroonenburg et al., 2015; Zhu et al., 2020; Tayyab et al., 2023). First, at the tactical level, they create schedules that assign surgeries to operating theatres; then, at the operational level, they assign individual patients to scheduled slots. The next section introduces and discusses the proposed mathematical model in detail.
3 MATHEMATICAL MODEL
The proposed mathematical model covers the process from entry into the operating theatre to discharge from the hospital. The parameters of the problem are described in Table 2, the modelling parameters are in Table 3, and the decision variables are in Table 4.
Figure 3 details the flow of patients from operating theatre to hospital discharge, considering their multiple recovery pathways. Observe that patients of any given speciality can be referred to the ICU or SICU after surgery in case they need SICU or ICU care. Otherwise, they will be directly referred to the Ward. Finally, patients will be discharged from hospital after their recovery at the Ward.
Equation (1) below introduces the optimisation problem to be solved:
Observe that the left-hand side of Eq. (1) represents the total time effectively assigned to surgeries during the planning horizon, whereas the right hand side is a weighted sum of the number of beds allocated. Therefore, the aim is to maximise the utilisation of the surgical centre, whilst limiting the number of post-surgical beds allocated across the different units. This is intended to help the decision-maker manage possible fluctuations in the availability of downstream resources by maintaining a reserve of bed capacity to use when needed.
Constraint (2) ensures that the number of hours required to perform all surgeries assigned to an operating theatre (OT) on a given day, including cleaning and preparation, never exceeds the hospital limit of H hours (Table 2) on days in which the OT is available
where C T is the median cleaning time across specialities. The parameter U t,d (Table 3) on the right hand side of expression (2) ensures that surgeries are only assigned on days when the OT is available. The last term in the right-hand side of (2) represents an extra cleaning and preparation interval, as both the preparation for the first surgery and the cleaning of the last one can be done outside of the working hours.
Constraints (3) and (4) below concern the allocation of operating theatres to surgical specialities and their corresponding medical teams
Whilst (3) ensures that surgeries of speciality s can only be assigned to OT t on day d if theatre t is assigned to speciality s on day D (z s,t,d =1, see Table 4), constraint (4) guarantees that, if active on day d∈D, the medical team responsible for surgeries of speciality s∈S will perform all their surgeries in a single OT. Note that this constraint does not prevent different specialities sharing the same OT. Instead, it is a sufficient condition to prevent any surgical speciality s∈S from being assigned two concomitant surgeries in different OTs (inconsistent assignment). The parameter M 1 (Table 3) is an arbitrarily large positive integer (“big M”).
Elective surgical procedures follow a weekly schedule so that surgeries can only be assigned to the speciality s on day d if a medical team of that speciality is available. Thus, constraint (5) states that surgeries of speciality s∈S can only be performed on day d∈D if the corresponding medical team is present
Note that the parameter B s,d , (Table 2), on the right hand side of the inequality (5), prevents surgeries of speciality s from being scheduled on days when the corresponding medical team is absent. The parameter M 2 (Table 3) on the right hand side of the inequality is also an arbitrarily large positive integer (“big M”), and in this case it acts as a bound on the total number of surgeries of speciality s∈S assigned on day d∈D.
For long-term management of the queues across all specialities, to prevent them from growing uncontrollably, constraint (6) establishes that the minimum number of surgeries of speciality s∈S assigned throughout the week must exceed, in at least one unit, the weekly demand for surgeries of the respective speciality, represented in Table 2 by parameter Dem s:
As a complement to constraint (6), and to avoid an excessive number of surgeries, constraint (7) states that, for each speciality, the total number of surgeries over the planning horizon cannot exceed a prescribed upper bound, namely one and a half times the demand over the same period rounded up
This is intended to result on a relatively balanced schedule across all specialties, to ensure that an eventual spare capacity in the OTs is not fully assigned to a small subset of specialities.
The remaining constraints model the post-surgical patient flow depicted in Figure 3, starting with equation (8) below:
Eq. (8) establishes that the total number of surgeries of speciality s∈S assigned to operating theatre t∈T on day d∈D, represented by the variable (Table 4), will be split between surgeries requiring patient recovery in the ICU , surgeries requiring recovery in the SICU and surgeries whose patients can be directly sent to the Ward . Similarly to Schneider et al. (2020), this extends previous models based on (Fügener et al., 2014) by allowing patients from a given speciality to be allocated to multiple recovery units. But our model further innovates by including SICU stays and more complex recovery pathways. It also allow us to plan downstream resource utilisation as advocated in (Heider et al., 2022).
It is noteworthy that and are auxiliary variables to help us plan the required ICU and SICU bed capacity according to the expected number of surgeries requiring a stay at each of these units. Constraints (9)-(10) ensure that we plan ICU (SICU) bed capacity for a minimum of percent of the total number of surgeries of each speciality s∈S on each day d∈D (see Table 2):
The modelling approach in Eq. (9)-(10) is a contribution of this work, and allows for a more realistic planning of the post-surgical patient flow, considering that patients from any speciality can be routed to multiple units with a given probability - and can henceforth follow multiple recovery trajectories.
To balance entries and exits in the special care units for each speciality, constraints (11) and (12) specify that the number of patients of speciality s∈S who are in the ICU and the SICU, respectively, on day d∈D is limited to the total number of beds allocated to that speciality. The left side of each constraint represents the sum of the quantities of patients of speciality s∈S sent to ICU and SICU beds in the last and days (Table 2), respectively:
Notice that, by establishing as the maximum length of stay at the ICU (SICU) for a patient of speciality s∈S, we attain some robustness for the bed planning at these units, which will help us guarantee that the weekly plan will not be hindered by the lack of downstream resources.
Constraint (13) states that if surgeries of speciality s∈S can be scheduled on day d∈D, then the total number of new patients arriving at the ward is limited to the number of free beds for that speciality on that day
Note that the right hand side of the constraint represents the number of patients of speciality s leaving the ward beds in the interval of Int s,d days (i.e., since the last day when surgeries of speciality s where undertaken - see Table 2), where is the average number of patients of this speciality discharged daily per recovery bed.
The left hand side of (13) aggregates the patients who underwent surgery on day d and were transferred directly to the ward, plus those who came from the special care units: those who have recovered in the ICU and SICU for and days, respectively, and who arrived at the ward in the last Int s,d days.
In complement, constraint (14) guarantees that in case new surgeries of speciality s∈S cannot be performed on day d∈D (B s,d =0 and Int s,d =0), the total number of patients of said speciality arriving at the ward on this day does not exceed the average number of released beds:
The flow modelling approach in Eq. (13)-(14) is an innovation with respect to previous works (e.g., Fügener et al., 2014; Santos & Marques, 2022), and it allows the model to remain parsimonious whilst considering the whole patient pathway. By looking at the flow of patients entering and leaving the ward, we can account for large lengths of stay at this unit without the need to explicitly model the overall trajectory of every patient on a daily basis - as in previous modelling approaches. The latter would render the model impractical for large recovery periods within the ward, which are by no means uncommon in the experience of our hospital partners.
Constraint (15) states that the number of patients of speciality s∈S arriving at the ward on day d∈D is limited to the number of beds allocated to the speciality in question. Note that this figure is composed of patients who came directly from the operating theatre, added to those from the special care units, who had their recovery period in the and days before:
Constraints (16), (17) and (18) establish that the totals of beds allocated across all specialities s∈S are restricted to the quantities available in the hospital in each postoperative unit, represented by the parameters Beds icu , Beds sicu and Beds ward (Table 2):
Constraints (19) and (20) ensure that the decision variables that assign surgeries and allocate beds (Table 4) belong to the set of non-negative integers:
Finally, constraint (21) states that the decision variable that allocates operating theatres (Table 4) is binary, being equal to 1 if OT t∈T is allocated to speciality s∈S on day d∈D, or equal to 0 otherwise:
Next, in Section 4, we present some numerical experiments that validate our approach and provide some insights into the effects of varying parameters such as the weekly demand for surgeries, the number of available operating theatres across the week and the penalty for allocating extra beds in the post-surgery units - SICU, ICU and Ward.
4 NUMERICAL EXPERIMENTS
We start this section by introducing the baseline parameters for our experiments. These were obtained from our military hospital partner and cover their operation from January to December, 2022. These are the model parameters listed in Table 2, which will be detailed in the next subsection.
4.1 General parameters for the experiments
The number of daily working hours H at each OT is equal to 12 hours, whereas the surgery preparation and cleaning time is set to 30 minutes for all specialities; we should bear in mind that the cleaning up of the last surgery and the preparation of the first one can be performed outside the OT working hours. As previously mentioned, the hospital covers a set S comprised of 7 orthopaedic specialities. As for the operating theatre availability, it varies across the week and the precise number of OTs available at each day will be individually introduced for each of the experiments. Hence, the set T of operating theatres will vary across experiments, as well as the weekly availability of individual theatres. Finally, elective surgeries will only be performed from Monday to Friday.
Table 5 shows the schedule of the medical team of each speciality during the week, represented in the model by parameter B s,d . The table conveys the availability of the medical teams during the week, with B sd =1 if the medical team for speciality s is available on day d and B sd =0 otherwise. One can see, for example, that the paediatric surgery team will perform surgeries only on Mondays and Fridays, whereas hip surgeries can take place on any day from Monday to Friday.
Table 6 depicts the model parameter Int s,d for all specialities across the week. Recall that Int s,d measures the interval (in days) since the last day that the medical team for speciality s was available to perform surgeries. For the example, as the medical team for the shoulder speciality is available from Monday to Friday - Table 5, Int s,d =1 from Tuesday to Friday. On Monday, however, the parameter value is equal to 3 days, representing the time elapsed between Friday and Monday.
The time required to perform a surgery of speciality s∈S, represented by the parameter Ope s , and the postoperative hospitalisation times in the different units, required for patient recovery in the respective speciality, indicated by , and , are illustrated in Table 7.
Table 8 comprises a set of parameters that vary only with respect to the surgical speciality, namely: the weekly demand for surgeries (Dem s ), the minimum percentage of surgeries that require recovery in the ICU and the minimum percentage of surgeries that require recovery in the SICU .
Finally, Table 9 shows the number of beds available in the ICU (Beds icu ), in the SICU (Beds sicu ) and in the Ward (Beds ward ).
In the remainder of this section, we will introduce specific sets of experiments and discuss their results and implications.
4.2 Experimental results
The series of experiments to be presented in the next subsections were run using the Gurobi Optimizer version 9.1.2 (Gurobi Optimization, LLC, 2022) on a laptop computer with Windows 10 operating system, 2.27 GHz i5 processor and 8 GB RAM. To limit the execution time, we utilised a maximum gap of 2% when searching for solutions using the branch and bound algorithm. The referenced value is expressed by , where UB and LB are equivalent to the values of the upper (dual) bound and lower (primal) bound, respectively.
4.2.1 Analysis of the effects of increasing operating theatre capacity
This subsection proposes the first set of experiments, which is comprised of experiments A1-A5. Starting from the baseline instance (experiment A1), we gradually increase operating theatre availability and observe the effects of the increase on the resulting optimal weekly surgery schedule and bed allocation plans across the ICU, the SICU and the Ward.
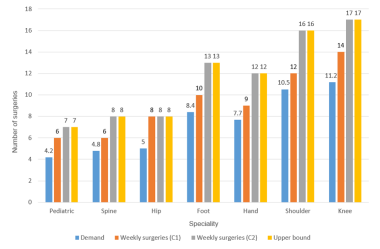
Table 10 shows the weekly demand for surgeries for all specialities s∈S; we also present the maximum number of weekly surgeries which would be assigned as per constraint (7), which limits the weekly number of surgeries to prevent an excessive bias in the weekly allocation. These parameters will remain constant over experiments A1-A5.
Table 11 details the OT availability for experiments A1 to A5; notice that the penalty for each post-surgical bed allocated in the optimal solution is set to W=1 in all experiments - see the objective function (Eq. (1)). Experiment A1 utilises the minimum number of operating theatres to attain feasibility. For the other experiments, OTs are gradually added along the week; each change of OT capacity with respect to the previous experiment is illustrated in red in Table 11.
Let us start by analysing the optimal weekly Master Surgery Schedule (MSS) for experiment A1, depicted in Figure 4. As the model does not specify the order of the surgeries, we set it up arbitrarily for the optimal allocation. One can see an intense occupation of the surgical centre across the whole week. One important measure related to the optimal MSS is the time assigned for surgeries, that corresponds to the first summation in the objective function - Eq. (1), and amounts to 96.3 hours distributed across a total of 49 surgeries. Another measure of interest is the total length of the OT sessions which adds up the time elapsed from the outset of the first surgery to the end of the last surgery across all operating theatres. This amounts to 115.8 hours in experiment A1, as it includes the preparation and cleaning operations performed during the working hours. Finally, the overall occupation rate of a MSS represents the ratio between the total length of the OT sessions and the total time available for surgeries in the whole surgical centre - measured as a percentage. As we have a weekly total of 120 hours available for surgeries (2 OTs, each with 12 daily working hours, open five days a week), the overall occupation rate for experiment A is 96.5% - as the total length of the OT sessions (115.8 hours) corresponds to 96.5% of 120 hours.

Table 12 summarises the performance indicators discussed above for experiments A1 to A5, along with the value of the objective function, the (optimality) gap and the time in seconds required to search for solutions.
The results in Table 12 illustrate the effect of increasing the capacity for a fixed demand. As expected, as we add more OT capacity, the overall occupation rate decreases, once the demand is kept constant in experiments A1-A5. To illustrate the changes, Figures 5 and 6 show the weekly MSS for experiments A4 and A5. Indeed, one can see in Figure 5 a considerable decrease in occupation on Wednesday and Thursday with respect to the MSS of experiment A1 (Fig. 4), whereas Figure 6 unfolds an additional decrease in OT occupation on Friday.


Figure 7 shows the total number of surgeries for each speciality for experiments A1-A5. As expected, one can see a gradual increase in the number of surgeries as more OT capacity is added, up to the time each speciality reaches the respective upper bound in the number of surgeries, see Table 10. It is worth mentioning that the number of weekly surgeries for spine and hip already reach the upper bound in experiment A1 and remain there across all experiments.

We will now analyse the effect of the increase in OT capacity in the bed allocation for ICU, SICU and Ward. Figure 8 depicts the bed allocation to surgical specialties across the three post-surgical units for experiment A1. One can see that the largest number of ICU beds are allocated to hip and spine; this is expected considering that these specialties feature the longest length of stay in the ICU (Table 8) as well the largest likelihood of requiring an ICU bed (Table 9). Notice that shoulder and knee require more Ward and SICU beds due to the large weekly demand, whereas hip and spine have lower demands but still require a considerable number of Ward and SICU beds due to their extended lengths of stay.

Depicted in Figure 9, the bed allocation for experiment A5 requires a larger number of post-surgical beds across all three units. This is expected, as this is the experiment with the largest operating theatre capacity. Note that, for experiment A5, we need to allocate a total of 15 beds in the ICU, one unit less than the amount provided by the hospital, as shown in Table 9.

Finally, Figure 10 illustrates the change in the overall number of beds allocated across the post-surgical units for experiments A1-A5. One can see a stable behaviour in the Ward and SICU, with a gradual increase in the required number of ICU beds as the OT capacity increases.

In the next subsection, we analyse the necessary resource capacity to balance supply and increased demand.
4.3 The effect of increases in weekly demand for surgeries
To investigate the sensitivity of the model with respect to demand increase, we evaluated the effect of demand increases of 20%, 40%, 60% and 100% with respect to the baseline. For each demand increase, we generated two experiments: one with the minimum number of OTs required to attain a feasible solution and one with enough OT capacity to approach the upper bound in the number of surgeries for each speciality (i.e., 1.5 times the demand plus one - Eq. (7)). The OT capacity and the demand multipliers (with respect to Table 8) for the resulting experiments are depicted in Table 13. The bed capacities and remaining parameters maintained the baseline values from experiment A1. One can see that we may need to roughly double the capacity of the OTs with respect to the baseline to accommodate an increase of 100% in the surgery demand levels across all specialties.
Table 14 shows the performance indicators for each experiment in Table 13. As expected, we observe increases in the number of surgeries as OT capacity increases, with a corresponding decrease in the OT occupation.
Figures 11, 12, 13 and 14 show the total number of weekly surgeries scheduled for each speciality in experiments B1-B2, C1-C2, D1-D2 and E1-E2, together with the weekly demand and the upper bound in the number of weekly surgeries.


Figures 15, 16, 17 and 18 illustrate the effect of the demand increase on the number of beds allocated in ICU, SICU and Ward. One can notice a significant increase in the number of required ICU and Ward beds as demand increases. The level of SICU beds, however, is kept stable as the overall probability of using SICU beds is generally small across most specialties, with short projected lengths of stay. Overall, while experiment B1 employs 45 post-surgical beds, experiment E2 requires 70 beds; which amounts to an increase of 55%.


In experiments D1-D2 and E1-E2, where we observe, respectively, increases of 60% and 100% with respect to the original demand, the current availability of beds in each recovery unit (Table 9) suffices to meet the weekly demand for surgeries. However, to reach the upper bound in the number of surgeries, we needed to allocate respectively one and two extra ICU beds with respect to the baseline.
4.4 The effect of the penalty in the number of allocated beds
Recalling that parameter W in the objective function (Eq. (1)) effectively penalises the allocation of post-surgical beds in the final solution, this section proposes a set of experiments to assess the effect of this parameter on the allocation of ICU, SICU and Ward beds. To do that, we introduce experiments F1-F9, based on the OT availability of experiment A4 (Table 11) of Section 4.2.
Table 15 conveys the results from experiments F1-F9, which cover different values of the penalty parameter W . Observe that all available beds across SICU, ICU and the Ward are allocated when W=0. This is expected, as no penalty is considered for allocating beds to specialities, therefore one can expect the spare bed capacity to be distributed across the medical specialities. The same behaviour is observed for small values of W, as one can see that the number of assigned surgeries and the total time assigned for surgeries remain constant up to W=0.7. As W increases, however, one can expect a decrease in the number of allocated beds, which in turn results in a decrease in the number of performed surgeries and therefore in the total time assigned for surgeries. This is observed in Table 15, as these quantities display a non-increasing behaviour with respect to parameter W, until they reach a lower limit. Indeed, one can see that the solutions remain constant for W≥6.1. This can be expected in general, as for large values of W one can expect the optimal solution to allocate the minimum number of SICU, ICU and Ward beds that ensure that the weekly schedule includes the minimum number of surgeries to satisfy and exceed the weekly demand by one unit - Eq. (6).
Figure 19 summarises the evolution of the total time assigned for surgeries as we increase the penalty parameter W. It conveys the non-increasing behaviour of the total time assigned for surgeries with respect to W . One can see that the maximum number of surgery hours is observed for small values of W, and that the number of surgery hours gradually decreases as W increases, until we reach the minimum total number of SICU, ICU and Ward beds that are required to meet and exceed the demand, from where the weekly schedule will remain constant.

4.5 Implications to hospital operation
As illustrated in the results, the proposed formulation allows the hospital to plan the medium-term (tactical) operation, whilst ensuring that the resulting strategy is in line with the hospital’s long-term goal of decreasing waiting times and queue lengths. This is ascertained as the formulation guarantees that the number of performed surgeries will exceed the average demand at each planning period - Eq. (6) for each individual specialities. In turn, this guarantees long-term stability for the waiting queues across all specialities (Shortle et al., 2018).
Our approach avoids ever increasing queues that typically appear across neglected specialities, where specialities are neglected due to an emphasis on the short-term utilisation of the operating theatres, or prioritisation of some specialities over others without considering potential long-term effects of successive weeks utilising unbalanced schedules. Managing the long-term queues, however, falls beyond the tactical planning horizon addressed in this paper and involves striking a balance between the number of surgeries in excess of the demand performed across all specialities. This is further complicated, as the capacity utilisation is also limited by the availability of surgical teams, and creates an interesting number of issues to be investigated in future research.
The proposed approach allows hospitals to anticipate the minimum increases in resources needed to accommodate increased demand over a tactical planning horizon, shifting the focus from prioritising specialities and managing ever-increasing queues to maintaining a minimum level of resources that allows all specialities to be fairly served, and ensures that all patients will have timely access to surgery over the long-term, whilst also promoting an optimised use of both the operating theatre and the post-surgical beds.
5 CONCLUDING REMARKS
This paper introduced a general integrated surgery scheduling and post-surgical bed planning problem for a typical surgical centre configuration, including multiple surgery recovery units and multiple routes of post-surgical care. The approach allows the decision maker to not only design an optimised tactical surgery scheduling plan, but also to plan the post-surgical bed capacity in the intensive and semi-intensive care units and in the ward, to ensure patient flow and therefore prevent cancellations due to the unavailability of downstream resources, i.e., post-surgical care capacity.
Starting from the decision support required by the hospital partner, the model bridges the gap between theory and practice by providing support for tactical planning in a realistic hospital setting, with a level of generality not previously addressed in the literature. For each speciality, the model includes the probability that a patient will need either intensive or semi-intensive care and considers the maximum stay at these units, thereby providing some level of robustness in the bed planning. This is essential, as it helps us make sure that the downstream resources suffice to ensure patient flow and avoid cancellations.
The integrated model will allow decision makers to experiment with the parameters and find out the level of upstream and downstream resources needed to satisfy the demand for all specialities, whilst considering the whole patient trajectory up to hospital discharge. Indeed, the demand and capacity constraints are designed to ensure service provision for all specialities, thereby linking with long-term goals such as reducing waiting queues while ensuring service provision for all patients who demand it.
Our experimental results illustrate the demand pressures, as an optimised allocation with the current demand and resources results in an occupation of 96.5%. We also show that increases in demand should be matched by a similar percentage increase in operating theatre capacity in order to keep the occupation below 100%. Furthermore, experiments also illustrate that the hospital partner needs a minimum of about 100 weekly surgery hours to satisfy the weekly demand across all specialities and thus ensure that the waiting queues across all specialties have a decreasing trend in the long-term.
The healthcare modelling approach proposed in this paper gives rise to a number of possible future research avenues. One obvious albeit challenging extension is to consider the uncertainty in either the surgery times or the lengths of stay in the ward. That would be a sensible step towards considering both sources of uncertainty. One can also investigate extensions of the proposed model for surgical centres subject to urgent or emergency surgeries. This is a challenging task as it would also involve the modelling of the protocol to be followed in case of an emergency or urgent surgical request, which would determine for example whether and which elective surgery would be cancelled to accommodate the extra demand, as well as the capacity sharing between elective and non-elective procedures for both upstream and downstream resources.
References
- ABEDINI A, YE H & LI W. 2016. Operating room planning under surgery type and priority constraints. Procedia Manufacturing, 5: 15-25.
- AGNETIS A, COPPI A, CORSINI M, DELLINO G, MELONI C & PRANZO M. 2014. A decomposition approach for the combined master surgical schedule and surgical case assignment problems. Health Care Management Science, 17: 49-59.
- AKBARZADEH B, MOSLEHI G, REISI-NAFCHI M & MAENHOUT B. 2019. The re-planning and scheduling of surgical cases in the operating room department after block release time with resource rescheduling. European Journal of Operational Research, 278: 596-614.
- ANJOMSHOA H, DUMITRESCU I, LUSTIG I & SMITH O. 2018. An exact approach for tactical planning and patient selection for elective surgeries. European Journal of Operational Research, 268: 728-739.
- BAM M, DENTON B, VAN OYEN M & COWEN M. 2017. Surgery scheduling with recovery resources. IISE Transactions, 49: 942-955.
- BRITT J, BAKI M, AZAB A, CHAOUCH A & LI X. 2021. A stochastic hierarchical approach for the master surgical scheduling problem. Computers & Industrial Engineering, 158: 107385.
- CAPPANERA P, VISINTIN F & BANDITORI C. 2014. Comparing resource balancing criteria in master surgical scheduling: A combined optimisation-simulation approach. International Journal of Production Economics, 158: 179-196.
- CHOI S & WILHELM W. 2014. An approach to optimize block surgical schedules. European Journal of Operational Research, 235: 138-148.
- CYLUS J, WILLIAMS G, CARRINO L, ROUBAL T & BARBER S. 2022. Population ageing and health financing: A method for forecasting two sides of the same coin. Health Policy, 126: 1226-1232.
- DELLAERT N & JEUNET J. 2017. A variable neighborhood search algorithm for the surgery tactical planning problem. Computers & Operations Research, 84: 216-225.
- DEMEULEMEESTER E, BELIËN J, CARDOEN B & SAMUDRA M. 2013. Operating room planning and scheduling. In: Handbook of Healthcare Operations Management. pp. 121-152. Springer.
- EKELOEF S, THYGESEN L & GÖGENUR I. 2019. Short-and long-term mortality in major non-cardiac surgical patients admitted to the intensive care unit. Acta Anaesthesiologica Scandinavica, 63: 639-646.
- FÜGENER A, SCHIFFELS S & KOLISCH R. 2017. Overutilization and underutilization of operating rooms-insights from behavioral health care operations management. Health Care Management Science, 20: 115-128.
- FÜGENER A. 2015. An integrated strategic and tactical master surgery scheduling approach with stochastic resource demand. Journal of Business Logistics, 36: 374-387.
-
FÜGENER A, HANS E, KOLISCH R, KORTBEEK N & VANBERKEL P. 2014. Master surgery scheduling with consideration of multiple downstream units. European Journal of Operational Research, 239: 227-236. Available at: https://www.sciencedirect.com/science/article/pii/S0377221714004160
» https://www.sciencedirect.com/science/article/pii/S0377221714004160 - GUIDO R & CONFORTI D. 2017. A hybrid genetic approach for solving an integrated multi-objective operating room planning and scheduling problem. Computers & Operations Research, 87: 270-282.
- GÜR S & EREN T. 2018. Application of operational research techniques in operating room scheduling problems: literature overview. Journal of Healthcare Engineering, 2018.
- HARRIS S & CLAUDIO D. 2022. Current trends in operating room scheduling 2015 to 2020: a literature review. In: Operations Research Forum. pp. 1-42. Springer.
- HASHEMI DOULABI S, ROUSSEAU L & PESANT G. 2016. A constraint-programming-based branch-and-price-and-cut approach for operating room planning and scheduling. INFORMS Journal on Computing, 28: 432-448.
- HEIDER S, SCHOENFELDER J, KOPERNA T & BRUNNER J. 2022. Balancing control and autonomy in master surgery scheduling: Benefits of ICU quotas for recovery units. Health Care Management Science, 25: 311-332.
- HEIDER S, SCHOENFELDER J, MCRAE S, KOPERNA T & BRUNNER J. 2020. Tactical scheduling of surgeries to level bed utilization in the intensive care unit. IISE Transactions on Healthcare Systems Engineering, 10: 229-242.
- KOPPKA L, WIESCHE L, SCHACHT M & WERNERS B. 2018. Optimal distribution of operating hours over operating rooms using probabilities. European Journal of Operational Research, 267: 1156-1171.
- MAKBOUL S, KHARRAJA S, ABBASSI A & ALAOUI A. 2022. A two-stage robust optimization approach for the master surgical schedule problem under uncertainty considering downstream resources. Health Care Management Science, 25: 63-88.
- MARQUES I, CAPTIVO M & BARROS N. 2019. Optimizing the master surgery schedule in a private hospital. Operations Research for Health Care, 20: 11-24.
- MOOSAVI A & EBRAHIMNEJAD S. 2020. Robust operating room planning considering upstream and downstream units: A new two-stage heuristic algorithm. Computers & Industrial Engineering, 143: 106387.
-
NHS. 2023. Available at: Available at: https://www.england.nhs.uk/statistics/statistical-work-areas/rtt-waiting-times/ accessed on 21/12/2023.
» https://www.england.nhs.uk/statistics/statistical-work-areas/rtt-waiting-times/ - PENN M, POTTS C & HARPER P. 2017. Multiple criteria mixed-integer programming for incorporating multiple factors into the development of master operating theatre timetables. European Journal of Operational Research, 262: 194-206.
- RIISE A, MANNINO C & BURKE E. 2016. Modelling and solving generalised operational surgery scheduling problems. Computers & Operations Research, 66: 1-11.
- ROSHANAEI V, BOOTH K, ALEMAN D, URBACH D & BECK J. 2020. Branch-and-check methods for multi-level operating room planning and scheduling. International Journal of Production Economics, 220: 107433.
- ROSHANAEI V, LUONG C, ALEMAN D & URBACH D. 2017. Collaborative operating room planning and scheduling. INFORMS Journal on Computing, 29: 558-580.
- SAMUDRA M, VAN RIET C, DEMEULEMEESTER E, CARDOEN B, VANSTEENKISTE N & RADEMAKERS F. 2016. Scheduling operating rooms: achievements, challenges and pitfalls. Journal of Scheduling, 19: 493-525.
- SANTOS D & MARQUES I. 2022. Designing master surgery schedules with downstream unit integration via stochastic programming. European Journal of Operational Research, 299: 834-852.
- SCHNEIDER AT, VAN ESSEN T, CARLIER MJ & HANS EW. 2020. Scheduling surgery groups considering multiple downstream resources. European Journal of Operational Research, 282: 741-752.
- SHORTLE J, THOMPSON J, GROSS D & HARRIS C. 2018. Fundamentals of Queueing Theory, Wiley Series in Probability and Statistics. 5 ed. New York: Wiley.
- SIQUEIRA C, ARRUDA E, BAHIENSE L, BAHR G & MOTTA G. 2018. Long-term integrated surgery room optimization and recovery ward planning, with a case study in the Brazilian national institute of traumatology and orthopedics (INTO). European Journal of Operational Research, 264: 870-883.
- TAYYAB A & SAIF U. 2022. A two-stage genetic artificial bee colony algorithm for solving integrated operating room planning and scheduling problem with capacity constraints of downstream wards. IEEE Access, 10: 131109-131127.
- TAYYAB A, ULLAH S, MAHMOOD T, GHADI Y, LATIF B & ALJUAID H. 2023. Modeling of multi-level planning of shifting bottleneck resources integrated with downstream wards in a hospital. Applied Sciences, 13: 3616.
- VANCROONENBURG W, SMET P & BERGHE G. 2015. A two-phase heuristic approach to multi-day surgical case scheduling considering generalized resource constraints. Operations Research for Health Care, 7: 27-39.
- WANG L, DEMEULEMEESTER E, VANSTEENKISTE N & RADEMAKERS F. 2021. Operating room planning and scheduling for outpatients and inpatients: A review and future research. Operations Research for Health Care, 31: 100323.
- YOUNESPOUR M, ATIGHEHCHIAN A, KIANFAR K & ESFAHANI E. 2019. Using mixed integer programming and constraint programming for operating rooms scheduling with modified block strategy. Operations Research for Health Care, 23: 100220.
- ZHANG J, DRIDI M & EL MOUDNI A. 2021. A two-phase optimization model combining Markov decision process and stochastic programming for advance surgery scheduling. Computers & Industrial Engineering, 160: 107548.
- ZHU S, FAN W, LIU T, YANG S & PARDALOS P. 2020. Dynamic three-stage operating room scheduling considering patient waiting time and surgical overtime costs. Journal of Combinatorial Optimization, 39: 185-215.
- ZHU S, FAN W, YANG S, PEI J & PARDALOS P. 2019. Operating room planning and surgical case scheduling: a review of literature. Journal of Combinatorial Optimization, 37: 757-805.