
 Hydrosedimentological modeling in a subhumid tropical catchment and its interactions with phosphorus
ABSTRACT
This research aims to propose a method for estimating total phosphorus (TP) concentration in reservoirs based on relationships with water discharges and sediment load in regions with a lack of available data on TP load into reservoirs. The case study was the 45.4 km2 subhumid tropical catchment, located in the state of Ceará, with a 482,920 m3 outlet reservoir. The hydro-sedimentological modeling was performed using the process-oriented WASA-SED model (model of Water Availability in Semi-arid Areas with SEdiment Dynamics). Four sediment production models were tested (Universal Soil Loss Equation [USLE], Onstad-Foster, Modified Universal Soil Loss Equation [MUSLE], and Multiscale Soil Erosion Tool [MUST]), yielding decadal sedimentation rates in the Tijuquinha reservoir ranging from 2.8% to 15% per decade, with the best performance for MUST (7.2% decade−1) as compared with the data derived from bathymetric surveys carried out in 1992 and 2020 (7% decade−1). To estimate the TP input load during the wet season with inflow discharges, a phosphorus balance was performed considering measured data on TP concentrations at the reservoir. Thus, a phosphorus-discharge relationship was established, with an R2 of 0.58. Using the time series of water discharge generated with WASA-SED for the Tijuquinha catchment from 1980 to 2019, the historical TP load into the Tijuquinha reservoir was reconstructed for that period by applying the phosphorus-discharge relationship. The method proposed in this study was able to capture the intra-annual pattern of TP dynamics in the Tijuquinha reservoir, comparing monthly average values of measured and modeled TP concentrations. A specific TP input rate of 20.7 kg km−2 year−1 was found, with a TP deposition in the reservoir of 98.5% and a TP release by the outlet devices of 1.5%.
Keywords:
phosphorus-discharge relationship; WASA-SED; ungauged catchment
RESUMO
Esta pesquisa tem como objetivo propor um método para estimar a concentração de fósforo total (TP) em reservatórios, baseado nas relações com vazões e carga de sedimentos em regiões com dados limitados sobre a carga de TP em reservatórios. O estudo de caso foi realizado em uma bacia hidrográfica tropical subúmida de 45,4 km2, localizada no estado do Ceará, com um reservatório de saída de 482.920 m3. A modelagem hidrossedimentológica foi conduzida utilizando o modelo orientado a processos WASA-SED (Modelo de Disponibilidade Hídrica em Áreas Semiáridas com Dinâmica de Secamento). Quatro modelos de produção de sedimentos foram testados — Equação Universal de Perda de Solo (USLE), Onstad-Foster, Equação Universal de Perda de Solo Modificada (MUSLE) e Ferramenta Multiescala de Erosão do Solo (MUST) —, produzindo taxas de sedimentação decadal no reservatório de Tijuquinha variando de 2,8 a 15% por década, com o melhor desempenho observado para o MUST (7,2% década-1) em comparação com dados de levantamentos batimétricos realizados em 1992 e 2020 (7% década-1). Para estimar a carga de entrada de TP durante a estação chuvosa com base nas vazões de entrada, foi realizado um balanço de fósforo considerando os dados medidos das concentrações de TP no reservatório. Dessa forma, estabeleceu-se uma relação fósforo-descarga, com R2 de 0,58. Utilizando a série temporal de descarga d’água gerada com o WASA-SED para a bacia hidrográfica do Tijuquinha, entre 1980 e 2019, a carga histórica de TP no reservatório foi reconstruída para esse período aplicando-se a relação fósforo-descarga. O método proposto neste estudo conseguiu capturar o padrão intra-anual da dinâmica de TP no reservatório Tijuquinha, ao comparar os valores médios mensais das concentrações de TP medidas e modeladas. Foi identificada uma taxa específica de entrada de TP de 20,7 kg km-2 ano-1, com uma deposição de TP no reservatório de 98,5% e uma liberação de TP pelos dispositivos de saída de 1,5%.
Palavras-chave:
relação fósforo-descarga; WASA-SED; bacia não monitorada
INTRODUCTION
Water supply in the state of Ceará, Brazil, depends mostly on surface waters accumulated in reservoirs, representing about 93% of the water offered to the population (De Araújo, 2003). Thus, this type of storage is fundamental for the sustainable development of the region and the conservation of quality and quantity of stored water (De Araújo, 2003). These water bodies have been impacted by the eutrophication process caused by total phosphorus (TP) inputs, increasing toxicity levels, and costs of water treatment (Rocha; Lima Neto, 2021).
The transport of TP is the major limiting factor for eutrophication in reservoirs and plays an important role in the aquatic ecological environment (Fang et al., 2017; Huang et al., 2017). Most phosphorus in water is transported and adsorbed to fine sediment particles due to its large specific surface area (Fang et al., 2013). In reservoirs, the water depth increases and the flow velocity decreases, promoting the phosphorus and sediment to settle to the bed surface (Huang, 2015). The phosphorus exchange between the bottom sediment at the reservoir bed and the overlying water is directly affected by the adsorption and desorption on sediments. A continuous process of phosphorus sorption occurs from the overlying water to the bed sediment and desorption to the water column by resuspension, depending on the concentration of phosphate (Jarvie et al., 2005; Bai et al., 2017).
According to Zhou et al. (2022), erosion and sediment transport processes are the basic mechanisms for phosphorus transfer from soil to the river network within the watershed by adsorption at the particle-water interface. According to Medeiros et al. (2014), the connection between water and sediment transport from hillslopes (sediment-producing areas) to the drainage network (transport element) is a key process controlling sediment transfer at the hillslope scale. At this scale, low runoff depth is the main feature breaking sediment connectivity. At a larger scale (medium-sized to large catchments), networks of surface reservoirs act as the most important barriers for disconnecting sediments. Therefore, considering the interactions of phosphorus and sediments in a river basin, areas that can lead to an increase in TP concentrations in aquatic ecosystems will be those with a combination of multiple factors, such as increased phosphorus levels in the soil, increased susceptibility to erosion, and closer proximity to watercourses (Walling; Collins; Stroud, 2008).
In general, the transport of particulate phosphorus in rivers is influenced by the sediment transport regime, which is the combination of forces that keep sediments in motion and forces that cause sediments to settle in the water column (Fang et al., 2013). Some researchers have investigated the relationships between phosphorus and water fluxes into water bodies (Bowes et al., 2008, 2009, 2010, 2014; Bowes; Smith; Neal, 2009; Lima Neto et al., 2022; Rocha; Lima Neto, 2021), the transport of phosphorus adsorbed to sediment (Hodson; Mumford; Lister, 2004; Walling; Collins; Stroud, 2008; Zhou et al., 2022), and the interactions between phosphorus and sediment in reservoirs (Wang et al., 2009; Lira; Medeiros; Lima Neto, 2020).
Monitoring of water quality in the State of Ceará is restricted to the strategic reservoirs and a few parameters, including TP, with a very low frequency of data collection at the water body. Furthermore, no data on TP input load into most of those reservoirs are available, requiring the adoption of an alternative method based on phosphorus modeling (Rocha; Lima Neto, 2021).
Considering this lack of available data on TP input load into tropical reservoirs and the dominance of non-point sources (NPS) load, which can be mobilized by surface runoff and erosion processes, we assumed that a scientific method based on TP load relationships with water discharge and suspended sediment load derived from hydrosedimentological modeling may be a good strategy to overcome the challenges of dealing with the scarcity of TP load data in such areas. For this purpose, the WASA-SED model (model of Water Availability in Semi-arid Areas with SEdiment Dynamics) was selected. WASA-SED enables the simulation of water fluxes using a process-oriented hydrological routine tailored for tropical regions and sediment fluxes, considering four different erosion equations available in the code (Universal Soil Loss Equation [USLE], Onstad-Foster, Modified Universal Soil Loss Equation [MUSLE], and Multiscale Soil Erosion Tool [MUST]) to evaluate the model sensitivity for estimating sediment yield.
MATERIALS AND METHODS
Study area characterization
This study was carried out at the 45.4-km2 Tijuquinha catchment located approximately 80 km from Fortaleza in the Baturité Massif, in the State of Ceará, Brazil (Figure 1). The outlet reservoir, also named Tijuquinha, was built in 1917 and has a current storage capacity of 482,920 m3 and a maximum water depth of 11.9 m. The water stored in the Tijuquinha reservoir has been mainly used for supplying water to the Baturité city located downstream. The Tijuquinha reservoir presents high intra-annual variability in water volumes, with filling and emptying in the same year along the time series of measured data (2010–2023), even during the prolonged dry period in the state of Ceará (2011–2019). An average annual inflow of 5.2 m3 s−1 was estimated by the water balance in the Tijuquinha reservoir in the last 10 years since there are no measured data on annual water inflows. The Tijuquinha watershed has air temperatures ranging from 17.5 to 25.2°C and a mean daily insolation of 4.9 h per day. The average annual precipitation in the area is about 1730 mm year−1, with rains concentrated mainly from February to May. The average elevation in the watershed is 753 m, with altitudes ranging from 343 to 1020 m, indicating a mountainous watershed with high altimetric variability and rugged relief with an average slope of 30%. Regarding land use mapped from Google Earth Pro 7.3 (2022), which is based on a mosaic of multiple satellite or aerial photos taken over days or months, a well-preserved basin can be noticed with 72% of tropical rain-cloud forest (or humid mountain forest), 22.6% of degraded humid mountain forest, 4% of agriculture and pasture, and 1.4% of exposed soil. The predominant agricultural production in the region is the cultivation of bananas, with emphasis also on coffee, which boosts tourism.

Estimation of total phosphorus input load into the Tijuquinha reservoir
The database of the Water Resources Management Company of the State of Ceará—COGERH, provides monitoring data on TP concentrations in the Tijuquinha reservoir, with low-frequency sampling near the dam (up to three times a year), for the period 2009–2021, with values varying from 0.021 to 0.518 mg L−1. Water sampling was performed using a Van Dorn bottle and samples were analyzed according to the Standard Methods for the Examination of Water and Wastewater of the American Public Health Association. No measurements of TP concentrations were performed at the inlet and outlet of the reservoir. The measured data on TP enables the analysis of water quality in the Tijuquinha reservoir regarding this nutrient, indicating that TP concentrations often exceeded the limits established by the National Environment Council (CONAMA) according to Resolution 357 of the National Environment Council (Brasil, 2005), even for class 3 (values lower than 0.05 mg L−1), which already has some water use restrictions.
The nutrient balance method has been commonly used for simulating TP dynamics in tropical reservoirs (Andrade et al., 2020; Praxedes et al., 2023). This method allowed us to evaluate the influence of seasonality on phosphorus delivery into tropical reservoirs with such data scarcity as an attempt to relate TP input with hydrosedimentological variables such as water runoff and sediment yield. The TP balance was carried out for the rainy season (January to June) when rainfall is concentrated and water inputs from surface runoff in the watershed are recorded. Measured data on reservoir volume and spillway overflow discharges are available, as well as measured TP concentrations in the reservoir. The water and TP balances were performed to estimate the TP input load in the time intervals between TP concentration measurements carried out in the reservoir during the rainy season, based on Equations 1–4:
Initially, a mass balance for TP is performed:
Where MP,in and MP,out are the phosphorus content at the reservoir's inlet and outlet (tons), respectively, and MP,start and MP,end are the phosphorus content in the reservoir water column at the beginning and end of the time interval between TP concentration measurements (tons), respectively.
Since TP content (M) is computed by multiplying the TP concentration (C) by the water volume (V), Equation 2 becomes:
Where Cin and Cout are the input and output TP concentrations at the reservoir's inlet and outlet (mg L−1), respectively, Cstart and Cend are the TP concentrations in the reservoir at the beginning and end of the time interval between TP concentrations measurements (mg L−1), respectively, Vin and Vout are the input and output water volumes (m3), respectively, Vstart and Vend are the volumes of water in the reservoir at the beginning and end of the time interval between TP concentrations measurements (m3), respectively. Considering the lack of measured data of TP concentration at the outlet of the reservoir, it was assumed to be equivalent to TP concentration in the reservoir after the complete mixing process at the end of the time interval. Although this assumption is subject to uncertainties, these can be reduced if the proposed method is applied to shorter time intervals (weekly or daily, as defined by the user). Therefore, Equation 3 becomes:
Replacing Equation 3 into Equation 2 and isolating TP concentration at the reservoir's inlet (Cin), Equation 4 becomes:
Daily measured data on the water level at the Tijuquinha reservoir provided by COGERH was used to estimate water inflow volumes into the Tijuquinha reservoir (Vin) by performing the water balance in the time step.
Hydro-sedimentological modeling with Water Availability in Semi-arid Areas with SEdiment Dynamics
The WASA-SED model (model of water availability in tropical environments with a sediment dynamics component: Guentner; Bronstert, 2004; Mueller et al., 2010; Bronstert et al., 2014) was chosen to simulate the processes of runoff generation and sediment production in the Tijuquinha reservoir watershed. The WASA-SED uses a spatial structure with discretization of the watershed into homogeneous hydrological units, which are composed of land components that represent different topographic characteristics and are subdivided into combinations of soil and vegetation where runoff generation processes occur. It has been widely used for simulating water and sediment routing processes in tropical watersheds (Malveira; De Araújo; Guentner, 2012; Medeiros et al., 2014; Mamede et al., 2018; Lima et al., 2023), in some areas in Spain (Mueller et al., 2008; Francke, 2009), India (Jackisch, 2007), and Central Asia (Duethmann et al., 2013).
The WASA-SED has been successfully applied in studies carried out in tropical regions (Malveira; De Araújo; Guentner, 2012; Medeiros et al., 2014; Mamede et al., 2018) to simulate water and sediment dynamics in watersheds. In the case of erosion and sediment transport processes in the watershed, the WASA-SED model includes four erosion models using variations of the USLE equation (Wischmeier; Smith, 1978), which can be generalized as proposed by Williams (1995), as detailed in Mueller et al. (2010). The USLE equation and its variations can be generalized in Equation 5 as follows:
Where E is the gross erosion (t), K is the soil erodibility factor (t ha h ha−1 MJ−1 m−1), LS is the slope length factor, C is the vegetation and crop management factor, P is the erosion control practice factor, ROKF is the coarse fragment factor as used in USLE, A is the area of interest (ha), and χ is the energy term that differs between the USLE derivatives, which are provided in the following section. The energy term χ is calculated (Williams, 1995) for USLE (Equation 6), Onstad-Foster (Equation 7), MUSLE (Equation 8), and MUST (Equation 9) as follows:
Where EI is the rainfall energy factor (MJ mm ha−1 h−1), Qsurf is the runoff depth (mm), and qp is the peak runoff rate (mm h−1). The four different erosion and sediment transport equations (Equations 6–9) are available in the WASA-SED model and were tested in this study. In contrast to the original USLE (Equation 6), Equations 7–9 incorporate the surface runoff Qsurf for computing the energy component, which eliminates the need to enter a sediment delivery ratio (SDR) and implicitly accounts for antecedent soil moisture (Mueller et al., 2010; Bronstert et al., 2014). Erosion (E) is distributed among the user-specified number of particle size classes, according to the mean composition of the eroded horizons in the area. They differ from each other in relation to the method of calculating the energy required to transport the eroded sediment to the drainage network.
To estimate the sedimentation rate on the Tijuquinha reservoir, data from bathymetry surveys carried out in different monitoring years were used, considering a temporal evolution described by a geometric progression as described in Equation 10:
Where Sed is the sedimentation rate per decade (m3 decade−1), Vi is the initial storage capacity (m3), Vf is the final storage capacity (m3), and td is the time (decade). According to historical data provided by the Ceará Water and Sewage Company—COGERH, the Tijuquinha reservoir had a storage capacity of 0.605 hm3 in 1992 and 0.483 hm3 in 2020, representing a sedimentation rate of 7% decade−1, which is the range of other studies performed in the state of Ceará, with values varying from 0.6% decade−1 to 14.4% decade−1 (De Araújo et al., 2003; Lima Neto; Wiegand; De Araújo, 2011; Mamede et al., 2018; De Araújo et al., 2023).
Model parameterization and calibration
For the parameterization of WASA-SED, the following data analysis and processing steps have been performed: (a) land cover characterization by correlating data from satellite imageries and Google Earth Pro; (b) rainfall data processing using daily data from the Guaramiranga rain gauge (POSTO 54—GUARAMIRANGA; Latitude: −4.2670; Longitude: −38.9333), provided by the Research Institute of Meteorology and Water Resources (FUNCEME) and located closest to the area; (c) generation of topographic maps using Digital Elevation Model (30-m resolution) from the Shuttle Radar Topography Mission (SRTM) (NASA, 2013) to identify the spatial units of the catchment and the related LS slope length factor; (d) characterization of soil units using data from RADAMBRASIL soil map (1981), processed with the Rosetta model (Schaap, 1999), and estimation of the soil erodibility factor (K) taking into account the particle size distribution of the topmost horizon of each soil using the equation proposed by Williams (1995); and (e) estimation of the USLE cover and management factor (C) using tabulated values according to the land cover identified within the Tijuquinha catchment. As no practice of protection against erosion was observed in the study area, the support practice factor (P) was set to 1.
To improve the performance of the WASA-SED model in generating runoff, the scaling factor was calibrated (scaling factor—SF), which allows adjustments to the saturated hydraulic conductivity of the soil, since rainfall data are recorded on a daily scale and runoff events occur, in general, with shorter durations. Calibration of SF was carried out for the entire period (1980–2019) with the purpose of minimizing uncertainties in hydrological modeling for applications of the results of the hydrosedimentological model in the estimation of TP input loads at the reservoir inlet and the concentration of this nutrient in the lake. For testing the model performance (Figure 2), the Nash-Sutcliffe model efficiency coefficient (NSE) (Nash; Sutcliff, 1970) was used (Figure 2A), which was developed to assess the predictive skill of hydrological models. Furthermore, the mean absolute error (MAE) and root mean squared error (RMSE) were also used to evaluate the performance of the hydrological modeling with WASA-SED in the calibration process (Figures 2B and 2C, respectively).

Scale factor adjustment in the calibration process of the Water Availability in Semi-arid Areas with SEdiment Dynamics model using (A) Nash-Sutcliffe coefficient, (B) mean absolute error, and (C) root mean squared error.
The results are shown in Figure 2, with the best fit for the SF of 13 with an NS coefficient of 0.42, MAE of 0.029 hm3, and RMSE of 0.08. The normalized RMSE, also called the coefficient of variation, presented a residual variance of 11%, which may be considered acceptable for such complex hydrological modeling. Lima et al. (2023) adjusted SF values for 12 watersheds in the state of Ceará under semi-arid climate conditions and found values ranging from 0.2 to 2.5. The high value adjusted for the Tijuquinha reservoir watershed can be explained by the rapid hydrological response in a heterogeneous landscape with steep slopes and rainfall characteristics of a sub-humid climate, with values much higher than the average for the state of Ceará.
Estimation of total phosphorus concentration in the Tijuquinha reservoir
The WASA-SED model was applied to the Tijuquinha reservoir watershed to simulate the runoff generation and sediment yield from 1980 to 2019. Using water runoff generated with WASA-SED, the TP input load was estimated by the regression with water inflow discharges. To estimate TP concentrations in the reservoir, a combined equation was used that differentiates between the wet and dry periods. Time series of water runoff generated with the WASA-SED model were used to estimate TP input load by a regression equation. For the wet period, the general TP balance equation (Equation 11) was applied, considering the complete mixing process of the TP input load with the phosphorus content in the reservoir water body.
Based on the measured data of TP concentrations in the Tijuquinha reservoir during wet and dry periods, it can be observed that the dominant process related to phosphorus dynamics is the entry of TP load into the reservoir during the rainy season, increasing TP concentration in the lake, and TP decay due to sedimentation during the dry season, which may be explained by the very low water inflow into the reservoir (no water flow most of the time) and the increased water retention time, favoring faster TP sedimentation rates (Toné; Lima Neto, 2020; Silva; Cavalcante; Mamede, 2024). Despite the complex TP exchange between the bottom sediment in the reservoir bed and the overlying water by adsorption and desorption in sediments, TP deposition processes in the rainy season and TP resuspension in the dry season were not incorporated into the method proposed in this study. Therefore, a decay equation for TP concentrations in the reservoir was assumed for the dry period (Equation 12), based on the reference TP concentrations, which are defined as the median values of measured TP concentrations in the reservoir during the wet period (0.111 mg/L) and the dry period as well (0.047 mg/L) for the whole period from 2009 to 2021. The median TP concentration associated with the wet and dry periods was used to avoid distortions in mean values due to outliers of the time series. The TP decay ratio (λ) is calibrated to the simulation time step with t in years and a 6-month timeframe (the duration of the dry season period):
Where Ci and Ci+1 are the TP concentrations in the reservoir for consecutive time step i and i+1 (mg L−1), respectively, Vin is the input water volume into the reservoir in the time step (m3), V is the stored water volume in the reservoir for the time step i (m3), λ is the TP decay ratio in the time step (year−1), and t is the time interval (years).
Overview of the method for estimating total phosphorus concentration in reservoirs
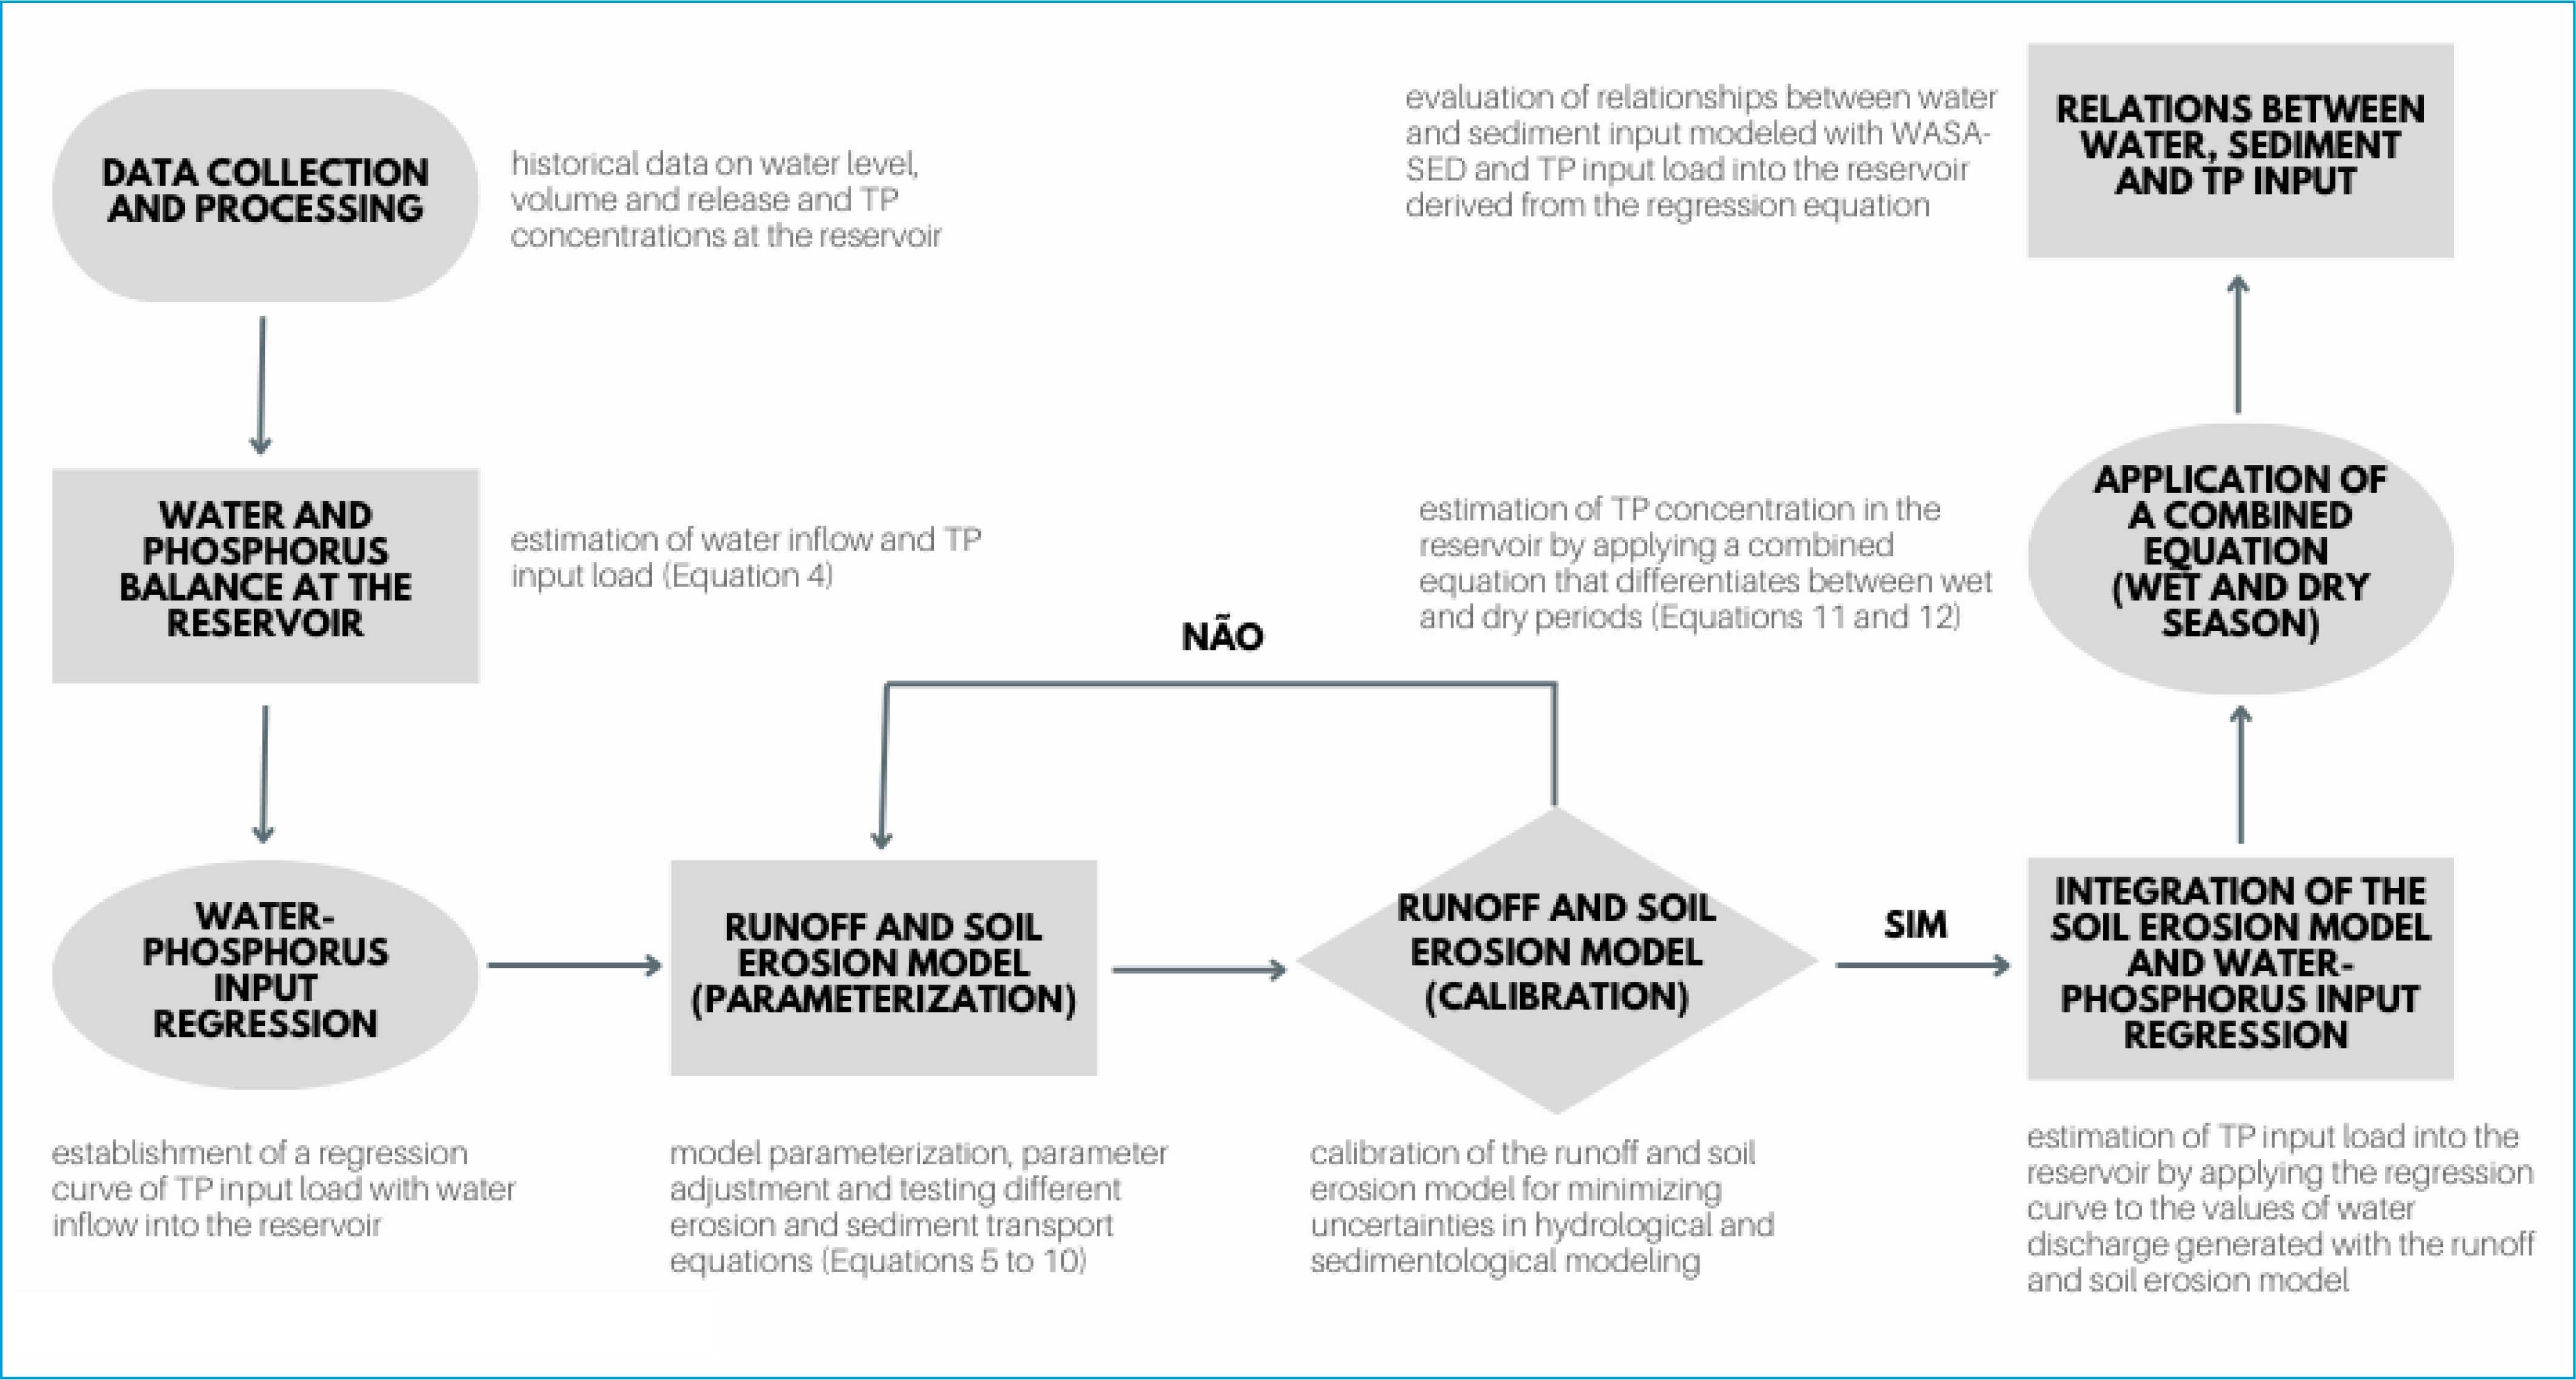
For estimating TP input loads into tropical reservoirs, a scientific method based on relationships with water discharge and sediment load derived from hydrosedimentological modeling has been proposed in this study, comprising the following steps (as summarized in Figure 3): (1) collection and processing of historical data on water level, water stored volume, water release, and TP concentrations at the reservoir; (2) estimation of water inflow and TP input load by performing the water and phosphorus balance at the reservoir for the time interval between TP concentration measurements (Equation 4); (3) establishment of a regression curve of TP input load with water inflow into the reservoir; (4) parameterization and calibration of the WASA-SED model for minimizing uncertainties in hydrological and sedimentological modeling by adjusting the SF scaling factor and testing four different erosion and sediment transport equations (Equations 5–9) based on the sedimentation rate in the reservoir (Equation 10); (5) estimation of TP input load into the reservoir in the time step by applying the regression curve to the values of continuous water discharge generated with WASA-SED; (6) estimation of TP concentration in the reservoir by applying a combined equation that differentiates between the wet and dry periods (Equations 11 and 12); (7) evaluation of relationships between water discharges and sediment input modeled with WASA-SED and TP input load into the reservoir derived from the regression equation. For that, the Pearson and Spearman correlation coefficients were applied, which are widely used coefficients to compare two sets of data and evaluate the correlation between them. While the Pearson coefficient represents a normalized measurement of covariance between two variables and is the most widely used correlation statistic to assess the degree of the relationship between linearly related variables, the Spearman coefficient is a nonparametric measure of correlation between the ranking of two variables, and it can be applied even when the between the variables is non-linear using a monotonic function. The application of two methods allows a more detailed analysis of the relationship between the variables considered in these studies (water discharges, sediment load, and TP load). Here, no data transformation was performed for the statistical analysis. In this study, data transformation was not performed for the statistical analysis.

Flowchart describing the method for estimating total phosphorus concentration in reservoirs proposed in this study.
RESULTS AND DISCUSSION
Hydro-sedimentological modeling of the Tijuquinha catchment
The WASA-SED model was applied to the Tijuquinha reservoir watershed in a daily time step for the period from 1980 to 2019 to simulate the hydrological and sedimentological processes that occurred during that period. The simulation of hydro-sedimentological included different erosion and sediment transport equations (USLE, Onstad-Foster, MUSLE, and MUST) available in the sediment routine of WASA-SED, on which most soil erosion models developed in the last decades are based (e.g., in SWRRB—Arnold et al., 1990; SWIM—Krysanova et al., 2000; LASCAM—Sivapalan et al., 1996; SWAT—Neitsch et al., 2002; and WASA-SED—Bronstert et al., 2014). These four equations differ in the calculation of the energy component χ, using rainfall erosivity, surface runoff characteristics, or a combination of both (Mueller et al., 2010; Bronstert et al., 2014). The erosion module of WASA-SED also allows the estimation of sediment yield and intra-hill deposition by applying a sediment transport capacity. The simulation considers an SF of 13 (best fit of the hydrological model) and the land use and land cover classification performed in the context of this research, based on Google Earth images. According to the model results, sedimentation rates in the Tijuquinha reservoir can range from 74,210 to 393,692 m3 (reduction from 2.8% to 15.0% per decade), depending on the selected erosion and sediment transport equation without calibration. The MUST equation presented a sedimentation rate (7.2% per decade), which is remarkably close to that obtained from the comparison between the topographic/bathymetric surveys of 1992 and 2020 (7% per decade).
The application of the WASA-SED model generated a time series of stored volumes in the Tijuquinha reservoir during the period from 1980 to 2019, as illustrated in Figure 4. This model application allowed the evaluation of temporal evolution of storage capacity in the Tijuquinha reservoir because of the sedimentation process considering the MUST equation, which presented the best results in terms of sedimentation rate in the Tijuquinha reservoir. The results show the model's ability to reproduce the dynamics of increasing water volumes during the rainy season and decreasing water volumes during the dry season. The Tijuquinha reservoir is characterized by important inflows that ensure the complete filling of the reservoir and intensive use of stored water, with emptying occurring within the same year. Also in Figure 4, one may observe the evolution of its storage capacity with a significant reduction over the decades due to the continuous deposition of sediments in its bed, which reinforces the importance of considering processes of reservoir sedimentation in the management of its water resources.

Evolution of measured and modeled water volumes in the Tijuquinha reservoir using Water Availability in Semi-arid Areas with SEdiment Dynamics for the period from 1980 to 2019.
Total phosphorus input load into the Tijuquinha reservoir
Based on the water and TP balance carried out in the Tijuquinha reservoir during intervals with measured data on TP concentrations in the reservoir during the rainy season, input water discharges and TP concentrations at the reservoir inlet were estimated. Thus, regression equations between TP concentration and load with water discharges at the reservoir inlet were established as shown in Figure 5, with R2 of 0.58 and 0.20, respectively. Figure 5A shows that the TP input load increases when the water discharge also increases, indicating that NPS contribution is predominant. However, the increase in surface runoff exceeds the TP assimilation in the water flow in such a preserved catchment (with almost 94% of rainforest and low nutrient availability), which may explain the negative linear regression between TP concentration and discharge shown in Figure 5B, as also found by He and Xu (2018). According to Rocha and Lima Neto (2021), the TP input load into most of the reservoirs investigated (16 from 20 strategic reservoirs in the State of Ceará) comes from NPS contribution (agriculture, livestock, and soil), while in four reservoirs, point sources (PS) such as fish farming and sewer production are predominant in urban (Santo Anastácio) and rural catchments with intensive populational occupation (Orós, Castanhão, and Acarape do Meio). A dilution pattern of TP was found for PS dominance, and a constant or slight increase of TP concentration with water discharge was observed for NPS dominance (Rocha; Lima Neto, 2021).

Regression curve of total phosphorus input load (A) and concentration at the Tijuquinha reservoir inlet (B) with water discharge.
This simplified approach may be a useful tool in reservoirs with no monitoring of TP input loads into reservoirs, such as at the Tijuquinha reservoir. Rocha and Lima Neto (2021) analyzed the correlation between TP concentration and flow in the river section at the inlet of 20 reservoirs in the State of Ceará, with storage capacities ranging from 0.3 to 1940 hm3, and found an average R2 of 0.45 and a maximum of 0.94 in the Forquilha reservoir. Lima Neto et al. (2022) also found a good relationship between TP concentration and water discharge to the 7.7 hm3 São José I reservoir (R2 of 0.99).
Applying the TP regression equation (Figure 5A), one may estimate the historical series of TP input loads based on water inflow discharges into the Tijuquinha reservoir generated with WASA-SED, as illustrated in Figures 6A and 6B for monthly and annual time resolutions, respectively. Figure 6A presents the historical series of TP concentrations and water volume in the reservoir in the period from 2009 to 2019, estimated based on the integrative modeling approach proposed in this study, highlighting the temporal evolution of water volumes and TP concentrations measured in Tijuquinha, which in general exceed the limits of CONAMA Resolution 357/2005 (classes 1–3). Based on the measured data of TP concentrations, it is possible to notice that the highest values are associated with the period of high surface runoff in the rainy season (higher water volumes stored in the reservoir), with a decay of TP concentrations in the reservoir in the dry season, with a few exceptions. Figure 6B shows high interannual variability in annual water inflow and TP input loads into the Tijuquinha reservoir, with a peak above 1.5 tons year−1 in 2,000 and more uniform values in periods of prolonged drought (1980–1984 and 2012–2019). A comparison of measured and computed TP concentrations is presented in Figure 6C. The uncertainties of the hydrological model and the reduced amount of measured data of TP concentrations in the reservoir result in a weak fit between the measured and modeled data, although one may observe coherence regarding their order of magnitude. Furthermore, the adsorption and desorption of phosphorus on sediments and TP exchange between the bottom sediment at the reservoir bed and the overlying water were not deeply addressed by the integrative modeling approach proposed in this study, which may also explain the weak fit between the measured and modeled TP concentrations. The intra-annual variation of TP concentrations can be observed in Figure 6D, highlighting the same behavior observed in other tropical reservoirs, with higher TP loads and concentrations in the Tijuquinha reservoir resulting from surface runoff in the rainy season (first half of the year) and decay in TP concentrations in the dry season (second half of the year). The method proposed in this study was able to capture the intra-annual pattern of TP dynamics in the Tijuquinha reservoir, with monthly average values of measured and modeled TP concentrations close to each other, except for the month of April when the modeling approach underestimated the results.

(A) Measured and modeled total phosphorus concentrations in the reservoir based on the integrative modeling approach proposed in this study, highlighting the limits for water quality classes 1–3 according to the CONAMA Resolution 357/2005 and the water volume evolution. (B) Annual water inflow modeled with Water Availability in Semi-arid Areas with SEdiment Dynamics and annual total phosphorus input load computed at the Tijuquinha reservoir inlet based on the regression equation. (C) Comparative analysis of measured and modeled total phosphorus concentrations in the Tijuquinha reservoir. (D) Average monthly total phosphorus concentration modeled with Water Availability in Semi-arid Areas with SEdiment Dynamics (minimum, average, and maximum values) compared to average total phosphorus concentrations measured in the Tijuquinha reservoir, including average monthly total phosphorus input load into the reservoir.
Based on the application of this integrative method (WASA-SED with TP regression equation), TP rates of 20.7 kg km−2 year−1 and specific sediment yields ranging from 54.6 to 289.9 tons km−2 year−1 (depending on the selected sediment transport equation) were found. In the case of the simulation with MUST, a specific sediment yield of 139 tons km−2 year−1 was observed, which resulted in a sedimentation rate of 7.2% per decade, close to that derived from bathymetric surveys of 1992 and 2020 (7.2% per decade). Rocha and Lima Neto (2021) estimated TP rates ranging from 4.4 to 39.3 kg km−2 year−1 for 20 catchments in the state of Ceará. The highest TP rate was found in the Acarape do Meio catchment, which is located next to the Tijuquinha catchment, in the same mountainous region with similar properties concerning topography and land use, in the Baturité Massif. The higher TP rates found in those catchments (Tijuquinha and Acarape do Meio) may be explained by their potential areas of phosphorus production (Lima et al., 2018) and the heterogeneous landscape terrain that favors the connectivity of runoff and the transport of sediment and adsorbed phosphorus (Medeiros et al., 2014). Hodson, Mumford and Lister (2004) estimated TP rates ranging from 64 to 2,000 kg km−2 year−1 in six glacial watersheds in the Northern Hemisphere, with areas ranging from 6.3 to 365 km2, while the production of fine sediment in these watersheds varied from 150 to 6,100 t km−2 year−1. Walling, Collins and Stroud (2008) found TP rates ranging from 0.04 to 11 kg km−2 year−1 in 12 watersheds in the United Kingdom, with areas ranging from 16 to 109 km2, while the production of fine sediments varied from 0.1 to 20 tons km−2 year−1.
Total phosphorus concentrations in the Tijuquinha reservoir
For estimating TP concentrations in the reservoir, an integrative modeling approach was applied considering the seasonal TP dynamics: a wet period with runoff generation and phosphorus yield from the catchment (Equation 11) and a dry period without inflow discharges into the Tijuquinha reservoir, characterized by prevailing TP decay (Equation 12). In the wet period, TP input loads into the Tijuquinha reservoir were obtained through the regression equation presented in Figure 5A, applied to water discharges generated with WASA-SED. In the dry period, the TP decay equation was considered. To estimate the TP decay in the dry period (second half of the year), reference values of initial and final TP concentrations were assumed, derived from median TP concentrations measured in the reservoir in the wet (0.111 mg/L) and dry periods (0.047 mg/L), respectively. The TP decay rate (λ factor) of 1.69 year−1 was estimated based on Equation 12, assuming the reference concentrations for the wet and dry periods. Silva, Cavalcante and Mamede (2024) estimated decay rates in three reservoirs in the State of Ceará, Brazil, considering periods with different hydrological regimes: a period with higher surface runoff and shorter hydraulic retention time (2004–2010) and another one with prolonged drought and longer hydraulic retention time. The author found λ factors ranging from 0.7 to 6.0 for this sample of reservoirs with distinct hydrological regimes.
Phosphorus and sediment relationship
Relations between phosphorus and sediments yielded in the Tijuquinha catchment for the period from 1980 to 2019 were also investigated (Figures 7A and 7B) as a complementary analysis, and the correlation coefficients between those variables can be seen in Table 1. For that, four sediment transport equations available in WASA-SED were tested: USLE, Onstad-Foster, MUSLE, and MUST. The results, presented in Figure 7A, indicated that TP input loads at the reservoir inlet estimated using the regression equation proposed in this study adjusted well to the sediment load generated by the WASA-SED model, with R2 values greater than 0.94 for the different equations tested. The Pearson and Spearman coefficients also reinforce a strong correlation between the variables with values greater than 0.93, as presented in Table 2. The relationship between phosphorus and suspended sediment has been investigated in several studies (Ruzycki et al., 2014; Hamidi et al., 2017). Ruzycki et al. (2014) analyzed the relationship between phosphorus and sediment in four watersheds in the State of Minnesota in the United States and found regressions with R2 values ranging from 0.40 to 0.69, indicating a strong relationship between these variables with 95% confidence intervals (p<0.0001). Hamidi et al. (2017) also found a strong relationship between TP and suspended sediment concentrations in Green Bay in the United States, with an R2 value of 0.83.

Relationships between water discharges and sediment loads yielded at the Tijuquinha catchment modeled with Water Availability in Semi-arid Areas with SEdiment Dynamics for the simulation period 1980–2019, considering four sediment yield equations (Universal Soil Loss Equation, Modified Universal Soil Loss Equation, Onstad-Foster, and Multiscale Soil Erosion Tool) and total phosphorus input load obtained from the regression equation proposed in this study: (A) total phosphorus versus sediment load and (B) sediment load versus inflow discharge.
Sedimentation rate in the Tijuquinha reservoir from 1980 to 2019 using the Water Availability in Semi-arid Areas with SEdiment Dynamics model and the four sediment production equations available in the sediment routine.
Correlation coefficient between water discharges and sediment loads yielded at the Tijuquinha catchment modeled with Water Availability in Semi-arid Areas with SEdiment Dynamics for the simulation period 1980–2019, considering four sediment yield equations (Universal Soil Loss Equation, Modified Universal Soil Loss Equation, Onstad-Foster, and Multiscale Soil Erosion Tool) and total phosphorus input load obtained from the regression equation proposed in this study.
The regression between TP input load and sediment yield in the Tijuquinha catchment obtained by the MUST soil erosion model (Figure 7) was applied to estimate the TP balance in the reservoir, considering the transport of phosphorus adsorbed to sediment particles. The results showed a TP input load of 37.3 tons in the period from 1980 to 2019, which represents an annual TP load of 932 kg year−1, of which 918 kg year−1 (98.5%) are deposited in the reservoir and 14 kg year−1 (1.5%) are released by the reservoir outlet devices (spillway and water intake). Andrade et al. (2020) found a TP deposition rate of 91% (1,270 tons year−1) and a TP release rate of 9% (124 tons year−1) in another tropical reservoir in the State of Ceará (Orós), based on water and phosphorus balance using measured data for a time period from 2008 to 2012. In this period, a specific TP load of 55.2 kg km−2 year−1 was recorded in the Orós basin, with an area of 25.240 km2, about twice the load yielded in the Tijuquinha catchment. The period studied by Andrade et al. (2020) included 3 years with above-average rainfall and recorded water spillage in the years 2008, 2009, and 2011, which may explain the higher TP release when compared to that observed in Tijuquinha.
Figure 7B, on the contrary, illustrates the relationship between sediment load and water discharges generated with the WASA-SED model for the sediment transport equations available, highlighting the relevance of surface runoff as a predictor variable of sediment production in the different USLE-derived formulations. Several scientific studies have found that surface runoff acts as the main mechanism for transporting sediments and phosphorus from the soil to the river network and subsequent deposition in reservoirs (Andrade et al., 2020; Zhou et al., 2022; Praxedes et al., 2023). In Figure 7B, the weakest fit between sediment and water discharge was observed for the USLE (R2 of 0.915). The other equations derived from the USLE are a function of the runoff depth and peak flow of the event, which strengthens the relationship between sediment production and generated surface runoff, and consequently, the relationship between the TP and sediment load, since TP concentrations were derived from a regression equation with water inflow discharges into the Tijuquinha reservoir (Figure 5A). Jones et al. (2010) performed a correlation matrix between temperature, water discharge, turbidity, TP, and suspended sediment concentration. Both TP and suspended sediment concentration showed a good correlation with water discharge with Pearson correlation coefficients of 0.80 and 0.70, with 95% confidence intervals. The authors found an even better correlation between TP and suspended sediment concentration with the turbidity variable (Pearson of 0.95 for both), which could be considered in future studies.
CONCLUSIONS
This research carried out the modeling of hydrological and sedimentological processes in a subhumid tropical basin, particularly the Tijuquinha catchment, with satisfactory performance of the WASA-SED model in estimating the water discharges and sediment production from the contributing area, as well as the evolution of volumes stored in the reservoir. The modeling results indicated that the MUST equation presented the best performance in predicting the sedimentation rate of the Tijuquinha reservoir among the four sediment transport equations available in WASA-SED, approaching the sedimentation measured from the difference between storage capacities in years of topographic/bathymetric surveys of the reservoir (7% per decade).
The proposed methodology for estimating the TP concentrations at the inlet of an ungauged reservoir based on regression with the water runoff generated in the catchment can be a good strategy for generating historical data of phosphorus in reservoirs without monitoring of TP loads or with only little data measured at the reservoir, such as in the case of the Tijuquinha reservoir. A complementary analysis enabled the evaluation of the relationship between the historical series of TP load derived from the regression equation with water discharges and suspended sediment concentrations generated with the WASA-SED model.
Despite the high practical value and good performance of WASA-SED in conjunction with the phosphorus regression equation established by TP mass balance in estimating TP concentrations in tropical reservoirs, this modeling system does not yet comprise all aspects related to TP dynamics in reservoirs, such as phosphorus release from anoxic sediments in deep lakes, with stratification of the water column and hypoxia of the deeper water layers.
To overcome difficulties related to limited TP concentration data in reservoirs, remote sensing techniques can be applied to Landsat 8 and 9 images to complement the database by correlating TP concentration with parameters such as top of the atmosphere radiance and surface reflectance in the water body. Furthermore, the Monte Carlo methods could also be tested to minimize uncertainties in estimating TP concentrations in data-constraint tropical reservoirs.
REFERENCES
-
ANDRADE, Eunice Maia de; FERREIRA, Kássia Crislayne Duarte; LOPES, Fernando Bezerra; ARAÚJO, Isabel Cristina da Silva; SILVA, Antônio Givanilson Rodrigues da. Balanço de nitrogênio e fósforo em um reservatório na região semi-árida tropical. Revista Ciência Agronômica, v. 51, n. 1, p. 1-10, 2020. https://doi.org/10.5935/1806-6690.20200020
» https://doi.org/10.5935/1806-6690.20200020 - ARNOLD, Jeffrey G.; WILLIAMS, Jimmy R.; NICKS, Arlin D.; SAMMONS, Nancy B.. SWRRB: A basin scale simulation model for soil and water resources management. Texas A & M University Press, Texas, 1990. 142 p. ISBN 0-89096-337-1.
-
BAI, Junhong; YE, Xiaofei; JIA, Jia; ZHANG, Guangliang; ZHAO, Qingqing; CUI, Baoshan; LIU, Xinhui. Phosphorus sorption-desorption and effects of temperature, pH and salinity on phosphorus sorption in marsh soils from coastal wetlands with different flooding conditions. Chemosphere, v. 188, 677-688, 2017. https://doi.org/10.1016/j.chemosphere.2017.08.117
» https://doi.org/10.1016/j.chemosphere.2017.08.117 -
BOWES, Michael J.; JARVIE, Helen P.; NADEN, Pamela S.; OLD, Gareth H.; SCARLETT, Peter M.; ROBERTS, Colin; ARMSTRONG, Linda K.; HARMAN, Sarah A.; WICKHAM, Heather D.; COLLINS, Adrian L. Identifying priorities for nutrient mitigation using river concentration-flow relationships: the Thames basin, UK. Journal of Hydrology, v. 517, p. 1-12, 2014. https://doi.org/10.1016/j.jhydrol.2014.03.063
» https://doi.org/10.1016/j.jhydrol.2014.03.063 -
BOWES, Michael J.; NEAL, Colin; JARVIE, Helen P.; SMITH, Jim T.; DAVIES, Helen N. Predicting phosphorus concentrations in British rivers resulting from the introduction of improved phosphorus removal from sewage effluent. Science of the Total Environment, v. 408, p. 4239-4250, 2010. https://doi.org/10.1016/j.scitotenv.2010.05.016
» https://doi.org/10.1016/j.scitotenv.2010.05.016 -
BOWES, Michael J.; SMITH, Jim T.; JARVIE, Helen P.; NEAL, Colin. Modelling of phosphorus inputs to rivers from diffuse and point sources. Science of the Total Environment, v. 395, p. 125-138, 2008. https://doi.org/10.1016/j.scitotenv.2008.01.054
» https://doi.org/10.1016/j.scitotenv.2008.01.054 -
BOWES, Michael J.; SMITH, Jim T.; JARVIE, Helen P.; NEAL, Colin; BARDEN, Ruth. Changes in point and diffuse source phosphorus inputs to the River Frome (Dorset, UK) from 1966 to 2006. Science of the Total Environment, v. 407, n. 6, p. 1954-1966, 2009. https://doi.org/10.1016/j.scitotenv.2008.11.026
» https://doi.org/10.1016/j.scitotenv.2008.11.026 -
BOWES, Michael J.; SMITH, Jim T.; NEAL, Colin. The value of high-resolution nutrient monitoring: a case study of the River Frome, Dorset, UK. Journal of Hydrology, v. 378, p. 82-96, 2009. https://doi.org/10.1016/j.jhydrol.2009.09.015
» https://doi.org/10.1016/j.jhydrol.2009.09.015 -
BRASIL. Ministério do Meio Ambiente. Conselho Nacional de Meio Ambiente. Resolução CONAMA n° 357, de 17 de março de 2005 Available at: https://www.siam.mg.gov.br/sla/download.pdf?idNorma=2747 Access on: Mar. 10, 2023.
» https://www.siam.mg.gov.br/sla/download.pdf?idNorma=2747 -
BRONSTERT, Axel; DE ARAÚJO, José-Carlos; BATALLA, Ramon J.; CUNHA COSTA, Alexandre; DELGADO, José Miguel; FRANCKE, Till; FOERSTER, Saskia; GUENTNER, Andreas; LÓPEZ-TARAZÓN, José Andrés; MAMEDE, George Leite; MEDEIROS, Pedro Henrique; MUELLER, Eva; VERICAT, Damià. Process-based modelling of erosion, sediment transport and reservoir siltation in mesoscale semi-arid catchments. Journal of Soils and Sediments, v. 14, n. 12, p. 2001-2018, 2014. https://doi.org/10.1007/s11368-014-0994-1
» https://doi.org/10.1007/s11368-014-0994-1 -
DE ARAÚJO, José Carlos. Assoreamento em reservatórios do semi-árido: modelagem e validação. Revista Brasileira de Recursos Hídricos, v. 8, n. 2, p. 39-56, 2003. https://doi.org/10.21168/rbrh.v8n2.p39-56
» https://doi.org/10.21168/rbrh.v8n2.p39-56 -
DE ARAÚJO, José Carlos; LANDWEHR, T.; ALENCAR, P.; PAULINO, W. Water Management causes increment of reservoir silting and reduction of water yield in the semiarid State of Ceará, Brazil. Journal of South American Earth Sciences, v. 121, p. 104102, 2023. https://doi.org/10.1016/j.jsames.2022.104102
» https://doi.org/10.1016/j.jsames.2022.104102 -
DUETHMANN, Doris; ZIMMER, Janek; GAFUROV, Abror; GUENTNER, Andreas; KRIEGEL, David; MERZ, Bruno; VOROGUSHYN, Sergiy. Evaluation of areal precipitation estimates based on downscaled reanalysis and station data by hydrological modelling. Hydrology and Earth System Sciences, v. 17, n. 7, p. 2415-2434, 2013. https://doi.org/10.5194/hess-17-2415-2013
» https://doi.org/10.5194/hess-17-2415-2013 -
FANG, Hong-wei; CHEN, Ming-hong; CHEN, Zhi-he; ZHAO, Hui-ming; HE, Guo-jian. Effects of sediment particle morphology on adsorption of phosphorus elements. International Journal of Sediment Research, v. 28, p. 246-253, 2013. https://doi.org/10.1016/S1001-6279(13)60035-9
» https://doi.org/10.1016/S1001-6279(13)60035-9 -
FANG, Hongwei; CUI, Zhenghui; HE, Guojian; HUANG, Lei; CHEN, Minghong. Phosphorus adsorption onto clay minerals and iron oxide with consideration of heterogeneous particle morphology. Science of The Total Environment, v. 605-606, p. 357-367, 2017. https://doi.org/10.1016/j.scitotenv.2017.05.133
» https://doi.org/10.1016/j.scitotenv.2017.05.133 - FRANCKE, Till. Distributed hydrological modeling using a GIS and remote sensing in semi-arid regions of developing countries PhD Thesis. Technische Universität Berlin, Berlin, Germany, 2009.
-
GOOGLE EARTH PRO 7.3. Baturité, 2022, 4°18’15.87"S, 38°54’17.60"W, eye alt 20,000 ft Available at: https://earth.google.com/web/@-4.19348583,-38.90771621,-46965.44109234a,56022.24388012d,35y,-2.49900012h,14.86561056t,0.0016r/data=OgMKATA Access on: May 31, 2023.
» https://earth.google.com/web/@-4.19348583,-38.90771621,-46965.44109234a,56022.24388012d,35y,-2.49900012h,14.86561056t,0.0016r/data=OgMKATA -
GUENTNER, Andreas; BRONSTER, Axel. Representation of landscape variability and lateral redistribution processes for large-scale hydrological modeling in semi-arid areas. Journal of Hydrology, v. 297, n. 1-4, p. 136-161, 2004. https://doi.org/10.1016/j.jhydrol.2004.04.008
» https://doi.org/10.1016/j.jhydrol.2004.04.008 -
HAMIDI, Sajad Ahmad; HOSSEINY, Hossein; EKHTARI, Nima; KHAZAEI, Bahram. Using MODIS remote sensing data for mapping the spatio-temporal variability of water quality and river turbid plume. Journal of Coastal Conservation, v. 21, p. 939-950, 2017. https://doi.org/10.1007/s11852-017-0564-y
» https://doi.org/10.1007/s11852-017-0564-y -
HE, Songjie; XU, Y. Jun. Phosphorus fluxes from three coastal watersheds under varied agriculture intensities to the Northern Gulf of Mexico. Water, v. 10, n. 816, p. 1-24, 2018. https://doi.org/10.3390/w10060816
» https://doi.org/10.3390/w10060816 -
HODSON, Andy; MUMFORD, Paul; LISTER, Debbie. Suspended sediment and phosphorus in proglacial rivers: bioavailability and potential impacts upon the P status of ice-marginal receiving waters. Hydrological Processes, v. 18, p. 2409-2422, 2004. https://doi.org/10.1002/hyp.1471
» https://doi.org/10.1002/hyp.1471 -
HUANG, Lei; FANG, Hongwei; FAZELI, Mehdi; CHEN, Yishan; HE, Guojian; CHEN, Daoyi. Mobility of phosphorus induced by sediment resuspension in the Three Gorges Reservoir by flume experiment. Chemosphere, v. 134, p. 374-379, 2015. https://doi.org/10.1016/j.chemosphere.2015.05.009
» https://doi.org/10.1016/j.chemosphere.2015.05.009 -
HUANG, Lei; FANG, Hongwei; XU, Xingya; HE, Guojian; ZHANG, Xuesong; REIBLE, Danny. Stochastic modeling of phosphorus transport in the Three Gorges Reservoir by incorporating variability associated with the phosphorus partition coefficient. Science of The Total Environment, v. 592, p. 649-661, 2017. https://doi.org/10.1016/j.scitotenv.2017.02.227
» https://doi.org/10.1016/j.scitotenv.2017.02.227 - JACKISCH, Conrad. Hydrological and hydraulic modelling of the Nagarjuna Sagar Dam catchment area, India M.Sc. Thesis. Department of Hydraulic Engineering and Water Resources Management, Technical University of Munich, Munich, Germany, 2007.
-
JARVIE, Helen P.; JÜRGENS, Monika D.; WILLIAMS, Richard J.; NEAL, Colin; DAVIES, Jennifer J.L.; BARRETT, Cyril; WHITE, John. Role of riverbed sediments as sources and sinks of phosphorus across two major eutrophic UK river basins: the Hampshire Avon and Herefordshire Wye. Journal of Hydrology, v. 304, p. 51-74, 2005. https://doi.org/10.1016/j.jhydrol.2004.10.002
» https://doi.org/10.1016/j.jhydrol.2004.10.002 -
JONES, Amber SPACKMAN; STEVENS, David K.; HORSBURGH, Jeffery S.; MESNER, Nancy O. Surrogate measures for providing high frequency estimates of total suspended solids and total phosphorus concentrations. Journal of the American Water Resources Association, v. 47, n. 2, p. 1-15, 2010. https://doi.org/10.1111/j.1752-1688.2010.00505.x
» https://doi.org/10.1111/j.1752-1688.2010.00505.x -
KRYSANOVA, Valentina; WECHSUNG, Frank; ARNOLD, Jeff; SRINIVASAN, Ragavan; WILLIAMS, Jimmy. SWIM (Soil and Water Integrated Model) User Manual, PIK Report Nr. 69, 2000, 239 p. Available at: https://www.osti.gov/etdeweb/servlets/purl/20170564 Accessed on Mar. 10, 2023.
» https://www.osti.gov/etdeweb/servlets/purl/20170564 -
LIMA NETO, Iran Eduardo; MEDEIROS, Pedro H.A.; COSTA, Alexandre C.; WIEGAND, Mario C.; BARROS, Antônio Ricardo M.; BARROS, Mário U.G. Assessment of phosphorus loading dynamics in a tropical reservoir with high seasonal water level changes. Science of The Total Environment, v. 815, p. 152875, 2022. http://dx.doi.org/10.1016/j.scitotenv.2021.152875
» http://dx.doi.org/10.1016/j.scitotenv.2021.152875 -
LIMA NETO, Iran Eduardo; WIEGAND, Mário Cesar; DE ARAÚJO, José Carlos. Sediment redistribution due to a dense reservoir network in a large semi-arid Brazilian basin. Hydrological Sciences Journal, v. 56, n. 2, p. 319-333, 2011. https://doi.org/10.1080/02626667.2011.553616
» https://doi.org/10.1080/02626667.2011.553616 -
LIMA, Berthyer Peixoto; MAMEDE, George Leite; LIMA NETO, Iran Eduardo. Monitoring and modeling of water quality in a semiarid watershed. Sanitary and Environmental Engineering Journal, v. 23, n. 1, p. 125-135, 2018. https://doi.org/10.1590/S1413-41522018167115
» https://doi.org/10.1590/S1413-41522018167115 -
LIMA, Thales Bruno Rodrigues; MEDEIROS, Pedro Henrique Augusto; MAMEDE, George Leite; DE ARAÚJO, José Carlos. Impact of intensive water use from farm dams on the storage dynamics in strategic reservoirs. Hydrological Sciences Journal, v. 68, n. 16, p. 2422-2434, 2023. https://doi.org/10.1080/02626667.2023.2272669
» https://doi.org/10.1080/02626667.2023.2272669 -
LIRA, Camila C.S.; MEDEIROS, Pedro Henrique Augusto; LIMA NETO, Iran Eduardo. Modelling the impact of sediment management on the trophic state of a tropical reservoir with high water storage variations. Anais da Academia Brasileira de Ciências (Online), v. 92, n. 1, p. e20181169, 2020. https://doi.org/10.1590/0001-3765202020181169
» https://doi.org/10.1590/0001-3765202020181169 -
MALVEIRA, Vanda Tereza Costa; DE ARAÚJO, José Carlos; GUENTNER, Andreas. Hydrological impact of a high-density reservoir network in the semiarid north-eastern Brazil. Journal of Hydrologic Engineering, v. 17, n. 1, p. 109-117, 2012. https://doi.org/10.1061/(ASCE)HE.1943-5584.0000404
» https://doi.org/10.1061/(ASCE)HE.1943-5584.0000404 -
MAMEDE, George L.; GUENTNER, Andreas; MEDEIROS, Pedro H. A.; DE ARAÚJO, José Carlos; BRONSTERT, Axel. Modeling the effect of multiple reservoirs on water and sediment dynamics in a semiarid catchment in Brazil. Journal of Hydrologic Engineering, v. 23, n. 12, p. 1-13, 2018. https://doi.org/10.1061/(ASCE)HE.1943-5584.0001701
» https://doi.org/10.1061/(ASCE)HE.1943-5584.0001701 -
MEDEIROS, Pedro Henrique Augusto; DE ARAÚJO, José Carlos; MAMEDE, George Leite; CREUTZFELDT, Benjamin; GÜNTNER, Andreas; BRONSTERT, Axel. Connectivity of sediment transport in a semiarid environment: a synthesis for the Upper Jaguaribe Basin, Brazil. Journal of Soils and Sediments, v. 14, n. 12, p. 1938-1948, 2014. https://doi.org/10.1007/s11368-014-0988-z
» https://doi.org/10.1007/s11368-014-0988-z -
MUELLER, Eva Nora; BATALLA, Ramon J.; GARCIA, Celso; BRONSTERT, Axel. Modelling bedload rates from fine grain-size patches during small floods in a gravel-bed river. Journal of Hydrologic Engineering, v. 134, p. 1430-1439, 2008. https://doi.org/10.1061/(ASCE)0733-9429(2008)134:10(1430)
» https://doi.org/10.1061/(ASCE)0733-9429(2008)134:10(1430) -
MUELLER, Eva Nora; GUENTNER, Andreas; FRANCKE, Till; MAMEDE, George Leite. Modelling sediment export, retention and reservoir sedimentation in drylands with the WASA-SED model. Geoscientific Model Development, v. 3, p. 275-291, 2010. https://doi.org/10.5194/gmd-3-275-2010
» https://doi.org/10.5194/gmd-3-275-2010 -
NATIONAL AERONAUTICS AND SPACE ADMINISTRATION (NASA). Shuttle Radar Topography Mission (SRTM) Global. Distributed by OpenTopography, 2013. https://doi.org/10.5069/G9445JDF
» https://doi.org/10.5069/G9445JDF -
NASH, James Eamonn; SUTCLIFFE, John Vernon. River flow forecasting through conceptual models part I — a discussion of principles. Journal of Hydrology, v. 10, n. 3, p. 282-290, 1970. https://doi.org/10.1016/0022-1694(70)90255-6
» https://doi.org/10.1016/0022-1694(70)90255-6 -
NEITSCH, Susan L.; ARNOLD, Jeffrey G.; KINIRY, James Robert; WILLIAMS, Jimmy R.; KING, Kevin Wayne. Soil and Water Assessment Tool. Theoretical Documentation, Version 2000, Published by Texas Water Resources Institute, TWRI Report, TR-191, 2002. Available at: https://swat.tamu.edu/media/1290/swat2000theory.pdf Accessed on Mar. 10, 2023.
» https://swat.tamu.edu/media/1290/swat2000theory.pdf -
PRAXEDES, Carine Fernandes; LOPES, Fernando Bezerra; ANDRADE, Eunice Maia de; DA SILVA, Thiago Teixeira; BECKER, Helena. Evaluation of nitrogen and phosphorus in surface reservoirs of the semi-arid region of Brazil using mass balance. Revista Ciência Agronômica, v. 54, e20228421, p. 1-16, 2023. https://doi.org/10.5935/1806-6690.20230057
» https://doi.org/10.5935/1806-6690.20230057 -
RADAMBRASIL. Projeto RADAMBRASIL. Série Levantamento de Recursos Naturais v. 23. Rio de Janeiro: Projeto Radambrasil, 1981. 744 p. Available at: https://biblioteca.ibge.gov.br/pt/biblioteca-catalogo?view=detalhes&id=217129. Access on: Mar. 10, 2023.
» https://biblioteca.ibge.gov.br/pt/biblioteca-catalogo?view=detalhes&id=217129 -
ROCHA, Maria de Jesus Delmiro; LIMA NETO, Iran Eduardo. Modeling flow-related phosphorus inputs to tropical semiarid reservoirs. Journal of Environmental Management, v. 295, p. 113123, 2021. https://doi.org/10.1016/j.jenvman.2021.113123
» https://doi.org/10.1016/j.jenvman.2021.113123 -
RUZYCKI, Elaine M.; AXLER, Richard P.; HOST, George E.; HENNECK, Jerald R.; WILL, Norman R. Estimating sediment and nutrient loads in four western lake superior streams. Journal of the American Water Resources Association, v. 50, n. 5, p. 1-17, 2014. https://doi.org/10.1111/jawr.12175
» https://doi.org/10.1111/jawr.12175 -
SCHAAP, Marcel G. Rosetta model 1999. Available at: https://www.ars.usda.gov/pacific-west-area/riverside-ca/agricultural-water-efficiency-and-salinity-research-unit/docs/model/rosetta-model/ Access on: Mar. 10, 2023.
» https://www.ars.usda.gov/pacific-west-area/riverside-ca/agricultural-water-efficiency-and-salinity-research-unit/docs/model/rosetta-model/ -
SILVA, Antonio Jose Pereira da; CAVALCANTE, Larissa Diniz; MAMEDE, George. Impacts of water quality on water availability of reservoirs in the state of Ceará. Revista Engenharia Sanitária e Ambiental, v. 29, n. e20230146, p. 1-9, 2024. https://doi.org/10.1590/S1413-415220230146
» https://doi.org/10.1590/S1413-415220230146 -
SIVAPALAN, Murugesu; VINEY, Neil R.; JEEVARAJ, Charles G. Water and salt balance modelling to predict the effects of land use changes in forested catchments. 3. the large scale model. Hydrological Processes, v. 10, p. 429-446, 1996. https://doi.org/10.1002/(SICI)1099-1085(199603)10:3%3C429::AID-HYP309%3E3.0.CO;2-G
» https://doi.org/10.1002/(SICI)1099-1085(199603)10:3%3C429::AID-HYP309%3E3.0.CO;2-G -
TONÉ, Arthur J. A.; LIMA NETO, Iran Eduardo. Modelagem simplificada do fósforo total em lagos e reservatórios brasileiros. Revista DAE, v. 68, n. 221, p. 142-156, 2020. https://doi.org/10.36659 /dae.2020.012
» https://doi.org/10.36659 /dae.2020.012 -
WALLING, Desmond Erik; COLLINS, Adrian L.; STROUD, Rob W. Tracing suspended sediment and particulate phosphorus sources in catchments. Journal of Hydrology, v. 350, n. 3-4, p. 274-289, 2008. https://doi.org/10.1016/j.jhydrol.2007.10.047
» https://doi.org/10.1016/j.jhydrol.2007.10.047 -
WANG, Ying; SHEN, Zhenyao; NIU, Junfeng; LIU, Ruimin. Adsorption of phosphorus on sediments from the Three-Gorges Reservoir (China) and the relation with sediment compositions. Journal of Hazardous Materials, v. 162, p. 92-98, 2009. https://doi.org/10.1016/j.jhazmat.2008.05.013
» https://doi.org/10.1016/j.jhazmat.2008.05.013 - WILLIAMS, Jimmy R. The EPIC Model. In: SINGH, Vijay P. (Ed.). Computer models of watershed hydrology Highlands Ranch, CO: Water Resources Publications, 1995. p. 909-1000.
- WISCHMEIER, Walter H.; SMITH, Dwight D. Predicting rainfall erosion losses: a guide to conservation planning. Maryland: United States Department of Agriculture, 1978. (Agriculture Handbook, n. 537).
-
ZHOU, Ya; LI, Shiyu; HUANG, Yingru; CHEN, Minghong; HUANG, Lei. Modeling of rainfall induced phosphorus transport from soil to runoff with consideration of phosphorus-sediment interactions. Journal of Hydrology, v. 609, p. 127732, 2022. https://doi.org/10.1016/j.jhydrol.2022.127732
» https://doi.org/10.1016/j.jhydrol.2022.127732

 Source: elaborated by the authors (2024).
 Source: elaborated by the authors (2024).
 Source: elaborated by the authors (2024).
 Source: elaborated by the authors (2024).
 Source: elaborated by the authors (2024).
 Source: elaborated by the authors (2024).
 Source: elaborated by the authors (2024).