 Prototype of an autonomous artificial cooling and psychrometric control system for grain storage
ABSTRACT
Environmental conditions in hot and humid climates are highly unfavorable for grain storage, often leading to pest infestations that can cause irreversible damage to the stored product. This study evaluated the effects of compressor and blower rotations on the psychrometric properties of air in a cooling system designed for grain storage. Conducted in Dourados, Mato Grosso do Sul, Brazil, the experiment utilized an Autonomous System for Cooling and Psychrometric Control of Grain Storage Conditions (SIARCONPAG), which adjusts exit air conditions to maintain the hygroscopic balance of grains in tropical environments. Tests were performed in three different operating modes, varying the temperature and relative humidity of the inlet air. Results showed that compressor and blower rotations significantly affected the temperature and relative humidity of the output air. The system, tested under controlled conditions, reduced the average storage temperature by up to 5 °C and maintained relative humidity between 60-65%, which is ideal for grain preservation. The system’s energy consumption was optimized, achieving 20% greater efficiency compared to traditional cooling systems. SIARCONPAG effectively manipulated psychrometric air conditions, with the isothermal humidifier and secondary condenser adapting to both low and high humidity levels. The results suggest that the system provides an efficient solution for controlling grain storage conditions in tropical regions, reducing post-harvest losses and contributing to food security. This study advances the development of grain storage technologies and supports more sustainable agricultural practices.
Index terms:
Smart agriculture; sustainable agriculture; humidity control; energy efficiency; post-harvest technology.
RESUMO
Condições ambientais de clima quente e úmido são extremamente desfavoráveis ao armazenamento de grãos, favorecendo o ataque de pragas que causam danos irreversíveis ao produto estocado. Este estudo avaliou a influência das rotações do compressor e do insuflador nas propriedades psicrométricas do ar em um sistema de resfriamento utilizado para controle das condições de armazenagem de grãos. Realizado em Dourados, Mato Grosso do Sul, Brasil, o experimento usou um Sistema Autônomo para Resfriamento e Controle Psicrométrico das Condições de Armazenagem de Grãos (SIARCONPAG), que ajusta as condições do ar de saída para manter o equilíbrio higroscópico dos grãos em ambientes tropicais. A metodologia envolveu testes em três modos de operação distintos, variando a temperatura e a umidade relativa do ar de entrada. Os resultados indicaram que as rotações do compressor e do insuflador influenciam significativamente a temperatura e a umidade relativa do ar de saída. O sistema, testado em condições controladas, reduziu a temperatura média de armazenamento em até 5 °C e manteve a umidade relativa entre 60-65%, adequadas à conservação dos grãos. O consumo de energia do sistema foi otimizado, resultando em uma eficiência 20% superior aos sistemas tradicionais. O SIARCONPAG demonstrou eficácia na manipulação das condições psicrométricas do ar, com o umidificador isotérmico e o condensador secundário adaptando-se a variações de umidade. Os resultados mostram que o sistema oferece uma solução eficiente para controle das condições de armazenamento, reduzindo perdas pós-colheita, promovendo segurança alimentar e contribuindo para o desenvolvimento de tecnologias avançadas de armazenamento de grãos.
Termos para indexação:
Agricultura inteligente; agricultura sustentável; controle de umidade; eficiência energética; tecnologia pós-colheita.
Introduction
Grains are the primary source of food energy worldwide. According to Poutanen et al. (2022), only 41% of grains are currently used for human consumption. Grain storage is a significant challenge for food security, particularly in tropical regions where unfavorable environmental conditions, such as high temperatures and elevated humidity, promote the development of pests and microorganisms that can compromise grain quality (Alconada & Moure, 2022).
Artificial cooling and psychrometric control have proven to be effective strategies to mitigate the adverse effects of climatic conditions during grain storage. This technique reduces the temperature and humidity of grains, decreasing the metabolism of microorganisms and pests while preventing deterioration associated with grain respiration and moisture accumulation (Müller et al., 2022).
Traditionally, grain coolers have been used to maintain the proper temperature of stored grains, minimizing biological activity and microbial growth (De Sousa et al., 2023). However, the major limitation of traditional cooling systems is their inability to simultaneously control the relative humidity of the air, which can lead to issues such as condensation or grain dehydration (Liu, Yu, & Yan, 2024). Excess humidity in the storage environment can result in condensation, leading to increased microbial activity and grain degradation. Conversely, low humidity can lead to grain dehydration, compromising their physical and nutritional properties (Mattos et al, 2023).
Studies on grain conservation in tropical climates have shown that a relative humidity of 60% to 70% is recommended to maintain the hygroscopic balance of grains, with 65% relative humidity being the ideal equilibrium point to prevent excessive drying, which can cause a loss of grain quality and weight, as well as excessive moisture, which promotes microorganism proliferation and grain deterioration (Naik et al., 2024).
The most evident issue with conventional grain cooling technologies is their limitation in maintaining appropriate relative humidity during prolonged storage. Müller et al. (2022) and Liu et al. (2024) highlight the need for more advanced psychrometric control systems that can operate autonomously and efficiently, especially in regions where environmental variations are intense and unpredictable.
The need for technological solutions to maintain grain quality during storage has driven research aimed at developing more efficient environmental control systems that reduce post-harvest losses and ensure the longevity of stored products (Chen et al., 2023).
The scientific literature highlights various studies focused on grain processing and storage, underscoring the importance of this field (Santos et al., 2020; Jianyao et al., 2023; Goulart et al., 2024). However, despite technological advances, most studies have limitations when addressing climatic, financial, and spatial issues simultaneously, reinforcing the need for innovations such as those presented in this study.
The importance of this research lies in the development of an innovative prototype of an autonomous cooling system that, in addition to controlling temperature, effectively adjusts relative humidity conditions, optimizing the grain storage environment, which justifies this investigation.
The central hypothesis of this study is that simultaneous and autonomous control of temperature and relative humidity in the grain storage environment provides a more stable setting, reducing deterioration caused by fungi and pests compared to traditional cooling systems. Additionally, the use of a psychrometric automation system may improve energy efficiency and reduce operational costs, making the storage process more economically viable, particularly in regions where environmental conditions are more challenging.
Thus, the aim of this study was to present a grain cooler prototype that incorporates a humidity control system. The objectives also included evaluating the influence of compressor and blower rotation speeds on the psychrometric conditions of the outlet air (temperature and relative humidity) under operating conditions where the inlet air was below and above the equilibrium moisture condition required for grain conservation.
Material and Methods
Description of the experimental area
The research was conducted in the municipality of Dourados, in the state of Mato Grosso do Sul, Brazil, at 22° 11’ 52.28’’ South Latitude and 54° 55’ 58.29’’ West Longitude, with an average altitude of 464 meters (Figure 1). The climate classification according to Köppen-Geiger is Am (monsoon climate) with dry winters and hot summers. The average annual precipitation is 1500 mm per year and the average temperature is 22 ºC per year (Alvares et al., 2013). The experimental area was located at the Faculty of Agricultural Sciences (FCA) of the Federal University of Grande Dourados (UFGD).

Geographic location of the experimental area. Source: (Instituto Brasileiro de Geografia e Estatística - IBGE, 2024).
The experiment was conducted with the equipment positioned in the Laboratory of Thermodynamics, Refrigeration, and Energy (LTRE) at a service door allowing access to the external environment.
Equipment design
The Autonomous System for Cooling and Psychrometric Control of Grain Storage Conditions (SIARCONPAG) was designed to operate autonomously, using in its logic programming equations that describe the hygroscopic equilibrium of grains in relation to the psychrometric conditions of the air, based on the concept of sorption isotherms, which are commonly used to predict the equilibrium moisture content of grains. In this study, the Chung-Pfost Equations (Chung & Pfost, 1967) and the Modified Halsey Equation (Boquet & Chirife; Iglesias, 1978) were used.
Equation 1, proposed by Chung-Pfost and incorporated into the PLC programming, was used to establish the relationship between the relative humidity (RH) of the air and the equilibrium moisture content (EMC) for grains such as coffee, corn, paddy rice, and wheat:
where:
T: air temperature (°C);
RH: relative air humidity (decimal);
EMC: equilibrium moisture content, decimal (d.b.);
a, b, and c: constants depending on the physical conditions of the product.
Equation 2, the Modified Halsey Equation (Boquet, Chirife, & Iglesias, 1978), incorporated into the PLC programming, was used to establish a relationship between relative air humidity (RH) and equilibrium moisture content (EMC) specifically for soybean grains:
where:
e: exponential
T: air temperature (°C);
RH: relative air humidity (decimal);
EMC: equilibrium moisture content, decimal (d.b.);
a, b, and c: constants depending on the physical conditions of the product.
In this study, we chose to use a distinct equation for soybeans because the literature indicates that the Modified Halsey model is best suited for predicting the equilibrium water content of agricultural products with high oil and protein content, including soybean seeds (Maciel et al., 2020).
The SIARCONPAG system operated by drawing ambient air into the cooling duct, passing it through the evaporator to cool it below the dew point. The relative humidity and temperature of the cooled air, monitored by the RHT sensor in the blower, determined three different operating modes of the equipment (Figure 2).

During the tests conducted on the SIARCONPAG prototype, the system was evaluated in three different operating modes, with controlled variations in both the compressor and blower speeds. These variations directly affected the temperature and relative humidity of the output air, as explained below:
Operating Mode 1 (Without the use of the humidifier or secondary condenser):
In Operating Mode 1, if the relative humidity of the cooled air was adequate, with an ideal value of around 65% according to Naik et al. (2024), to maintain the hygroscopic equilibrium of the grains, the system functioned solely as a cooler. In this mode, only the effects of compressor and blower speed were evaluated.
Operating Mode 2 (With the use of the isothermal humidifier):
In Operating Mode 2, if the relative humidity was below the ideal range (between 60% and 70%), desorption (drying) could occur, and the system activated the isothermal humidifier to increase the air’s relative humidity and maintain the hygroscopic balance. In this mode, the effects of compressor and blower speed were evaluated under the influence of the isothermal humidifier.
Operating Mode 3 (With the use of the secondary condenser):
In Operating Mode 3, if the relative humidity was above the ideal range (between 60% and 70%), sorption (moistening) could occur, and the system activated the secondary condenser to reduce relative humidity, balancing vapor pressures and maintaining hygroscopic equilibrium. In this mode, the effects of compressor speed, blower speed, and the main condenser fan were evaluated under the influence of the secondary condenser.
A flowchart was developed to better illustrate the three distinct operating modes of the equipment, as shown in Figure 3.

The prototype was constructed with dimensions of 2.40 m in length, 0.73 m in width, and 0.90 m in height, on a tubular steel frame with casters for easy movement. The condenser unit, oil separator, suction accumulator, isothermal humidifier, and solenoid valves for refrigerant flow control were installed at the bottom of the structure. The air treatment duct, containing the evaporator, linear vapor distributor, and secondary condenser, was mounted on top. The blower was installed at the other end of the duct. The general design of the system can be seen in Figure 4.

A UCM 2150 condenser unit, 220V, three-phase, with R22 refrigerant and a cooling capacity of 1 TR (3,204 kcal/h), from the Brazilian manufacturer Elgin, was used. The system assembly included one evaporator and two condensers: an external (main) condenser, part of the condenser unit, and an internal (secondary) condenser in series with the evaporator inside the air treatment duct. The initial assembly of SIARCONPAG is illustrated in Figure 5, showing from left to right, the blue air blower, the secondary condenser, and the evaporator (a). Below the air treatment duct, the condenser unit is visible (b).

Relative humidity control was performed by the isothermal humidifier model KUE*R*, 230 V, 60 Hz, with drainage pump and steam production of up to 3 kg/h, from the Italian manufacturer Carel. This device used electrodes to heat water to boiling, with the generated steam directed through a duct to the linear vapor distributor, located inside the air treatment duct between the evaporator and secondary condenser. The humidifier operation was managed by the CPY Terminal controller, with a wide modulation range (20 to 100%) through a demand of 0 to 10 V, 0 to 20 mA also from the Italian manufacturer Carel. Figure 6 shows the humidifier components.

Humidifier (a), linear steam distributor (b) and steam production controller (c). Source: The Authors.
Continuous data collection of temperature and relative humidity was performed by three RHT sensors, model RHT-WM-485-LCD, with working temperature between -40 °C to 70 °C, measurement range from -40 °C to 100 °C and relative humidity from 20 to 80%, from the Brazilian manufacturer Novus., positioned as follows: at the air treatment duct inlet to record ambient air temperature and humidity, inside the duct to record the air temperature drop after passing through the evaporator, and at the blower outlet to monitor the air exit conditions. Figure 7 illustrates the sensor installation at their respective points.

RHT sensors at the inlet (a), between the evaporator and the secondary condenser (b) and at the blower outlet (c). Source: The Authors.
For equipment control and automation, a programmable logic controller (PLC) model c.pCO Large, with 9 digital inputs and 9 digital outputs, 10 universal inputs and outputs and 6 analog outputs from the Italian manufacturer Carel, with Modbus communication protocol, was used. This system controlled two frequency inverters (compressor and blower), the isothermal humidifier, and three RHT sensors, among other components. The frequency inverters, model Drive 10, 220V, three-phase, with a power of 1.5 kW, current of 7 amps, from the Brazilian manufacturer Novus, regulated the rotation speed of the compressor and blower, with minimum and maximum frequencies set at 30 Hz and 60 Hz, respectively.
Statistical analysis
Statistical tests were performed to analyze the effects of three main factors (compressor speed, blower speed and condenser fan speed) on the output variables, namely temperature and relative humidity. The factors were evaluated in three different operating modes, defined based on the relative humidity of the storage environment.
Operation Mode 1 (ideal relative humidity):
In this mode, there was no need to use a humidifier or secondary condenser, since the relative humidity was within the levels considered adequate. The factors evaluated were:
• Factor 1: Compressor rotation (at 5 levels: 30 Hz, 38 Hz, 45 Hz, 53 Hz and 60 Hz).
• Factor 2: Blower rotation (at the same 5 frequency levels).
In total, 25 tests were performed (2 factors, 5 levels each), with 4 repetitions for each test, totaling 100 experiments in this mode.
Operation Mode 2 (suboptimal relative humidity):
In this scenario, the isothermal humidifier was activated to increase relative humidity. The factors tested were the same as in Mode 1:
• Factor 1: Compressor rotation (5 frequency levels: 30 Hz, 38 Hz, 45 Hz, 53 Hz and 60 Hz).
• Factor 2: Blower rotation (5 frequency levels).
25 tests were also performed (2 factors, 5 levels each), with 4 repetitions for each test, totaling 100 experiments in this mode.
Operating Mode 3 (relative humidity above ideal):
When relative humidity exceeded the ideal level, the secondary condenser was activated. In this mode, a third factor was introduced to control the main fan speed:
• Factor 1: Compressor speed (5 frequency levels: 30 Hz, 38 Hz, 45 Hz, 53 Hz and 60 Hz).
• Factor 2: Blower speed (5 frequency levels).
• Factor 3: Main condenser fan speed (5 frequency levels).
In this mode, 125 tests were performed (3 factors, 5 levels each), with 4 repetitions for each test, totaling 500 experiments.
Statistical Methods
The experimental design was conducted using a five-level factorial design for each factor. The data obtained were analyzed using the R software, with an analysis of variance (ANOVA) to verify the existence of significant differences between the treatments, ensuring the homogeneity of the variances of the groups. The coefficient of variation (CV) was interpreted according to the classification of Gomes (2023), being considered low when less than 10%, medium between 10% and 20%, high between 20% and 30%, and very high when greater than 30%.
Furthermore, the Response Surface Methodology (RSM) was applied to evaluate the effects of the factors on the output variables (temperature and relative humidity). Quadratic models were fitted for each response variable, and the significance of the factors was determined using Student’s t-test, with a 95% confidence level (Pr > |t|). The analysis allowed identifying the linear and interaction effects between the factors, as well as determining the optimal operating conditions for each mode.
Results and Discussion
The operating modes of the SIARCONPAG prototype directly affected the temperature and relative humidity values of the outgoing air, as demonstrated in the following results:
In Operating Mode 1 (without the humidifier or secondary condenser), the incoming air temperature ranged from 27 °C to 35 °C, with an initial relative humidity between 60% and 80%. Under these conditions, the compressor rotation varied between 30 Hz and 60 Hz, and the blower rotation also ranged from 30 Hz to 60 Hz. The system adjusted the outgoing temperature between 12°C and 20°C, with the outgoing relative humidity varying from 55% to 75%.
Operating Mode 2 (using the isothermal humidifier) resulted in an incoming air relative humidity range of 50% to 70% and an incoming temperature varying between 25 °C and 33 °C. In this mode, the system added vapor to the cooled air, with the compressor and blower rotation controlled within the same ranges (30 Hz to 60 Hz). The outgoing temperature ranged from 15°C to 18°C, with the outgoing relative humidity adjusted to 60% to 80%, depending on the incoming conditions.
In Operating Mode 3 (utilizing the secondary condenser), the incoming air had a relative humidity above 80% and a temperature between 30 °C and 35 °C. The system used the secondary condenser to reduce relative humidity, while the compressor and blower operated within the same rotation ranges. The outgoing temperature varied between 10 °C and 18 °C, with the relative humidity adjusted to values between 65% and 75%.
The three operating modes of SIARCONPAG demonstrated different levels of efficiency in controlling psychrometric conditions. Operating Mode 1 was limited in environments with adequate relative humidity. Operating Mode 2 effectively adjusted the initial low relative humidity, maintaining better storage conditions, while Operating Mode 3, with the secondary condenser, was more effective in environments with relative humidity above 80%, providing optimal control of temperature and humidity. Recent studies, such as Venkateswarlu and Reddy (2024), state that the use of auxiliary energy sources increases average drying efficiency by up to 77.45%, which is comparable to the performance observed in Operating Mode 3 of the SIARCONPAG prototype.
Operation Mode 1:
The analysis of variance for the test in mode of operation 1 involving the compressor and blower, as shown in Table 1, revealed significant effects for the compressor and blower speed factors, as well as for their interaction on the observed variables. According to Silva et al. (2020), a low Coefficient of Variation suggests that the data has little dispersion, reflecting high precision in the results.
Figure 8a shows the response surface of the output temperature as a function of the compressor and blower speed. A quadratic model was fitted, achieving an adjusted R² of 0.94. The identified inflection points were 46.59 Hz for the compressor speed and 97.32 Hz for the blower speed, despite the maximum operating frequency of the components being 60 Hz.

Response surfaces of the outlet temperature (a) and temperature difference (b) as a function of the effects of blower and compressor rotation in operating mode 1.
Upon analyzing the response surface of the output temperature (Figure 8a), it was observed that the lowest temperature was achieved when the compressor operated at 60 Hz and the blower at 30 Hz. In contrast, the highest temperature was recorded when the compressor operated at 30 Hz and the blower at 60 Hz. In the response surface of the temperature difference (Figure 8b), the patterns of higher and lower temperature differences were consistent with those previously observed.
Observation of the air flow in the cooling duct revealed that increasing the compressor speed resulted in a temperature reduction due to more intense heat transfer in the evaporator, caused by the increased refrigerant flow. However, increasing the blower speed raised the output air temperature due to the increased air flow through the evaporator. This behavior is consistent with Wu et al. (2022), who state that increasing the inlet air speed gradually reduces the heat transfer performance in the evaporator. According to these authors, this occurs due to the formation of frost on the heat exchanger fins, which impedes airflow and efficient heat exchange.
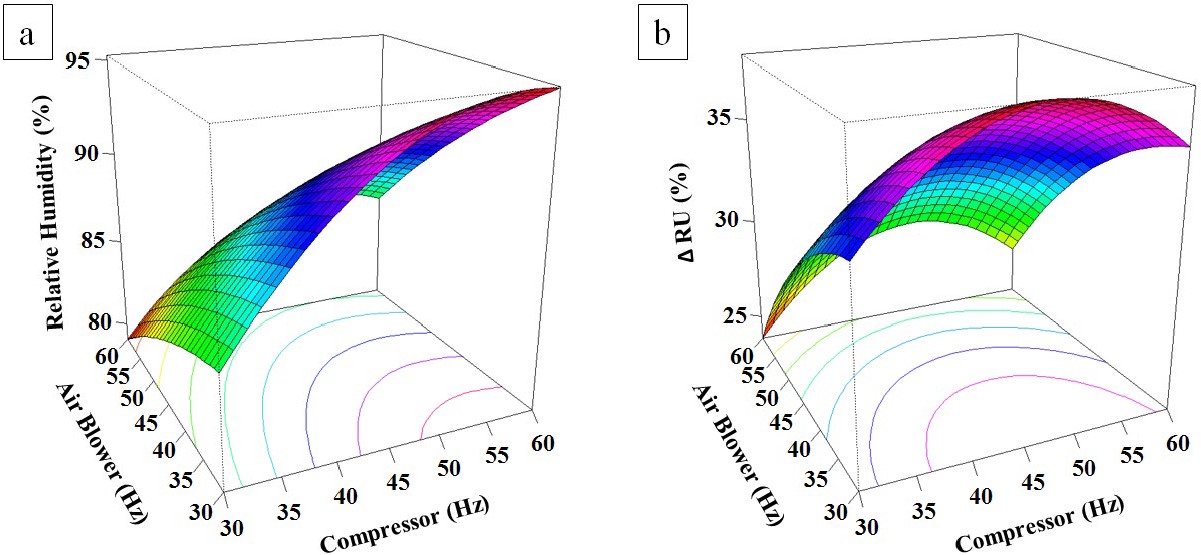
The response surface fit to the relative humidity data (Figure 9a) indicated that the interaction between factors was not significant. Thus, a new model without the interaction was fitted, presenting a moderate R² of 0.50. The inflection points were 40.187 Hz for the compressor speed and 42.537 Hz for the blower speed.

Response surfaces of the exit relative humidity (a) and difference between the entry and exit relative humidity (b) as a function of the effects of blower and compressor rotation in operating mode 1.
Analysis of the response surface of the output relative humidity (Figure 9a) revealed that the highest humidity value occurred at the inflection point, with the compressor at 40 Hz and the blower at 42.5 Hz, presenting a concave surface. In contrast, the response surface of the relative humidity difference (Figure 9b) was characterized as a saddle surface, indicating that the critical point coordinates do not provide either the highest or the lowest relative humidity difference.
During the tests, it was observed that increasing the compressor rotation raised the relative humidity of the outgoing air due to the temperature drop in the evaporator. According to Ayad et al. (2021), the evaporator temperature must not fall below the dew point of the humid air, as this leads to the condensation of water vapor on the evaporator surface. This condensation process results in the dehumidification of the air, reducing the relative humidity of the air passing through the system. In the context of the present study, this dynamic is crucial for maintaining the hygroscopic equilibrium of the grains, as an inadequately reduced relative humidity may cause the grains to dry out, leading to weight loss and diminished quality. Increasing the blower rotation raised the air temperature, a behavior also observed by Yajima, Ohkubo and Seki (2021), who investigated the performance of air source heat pumps (ASHPs) during winter operation with defrost-free external heat exchangers (DFHEX). Consequently, the relative humidity decreased, as the increased air flow through the evaporator kept the water vapor content constant while raising the vapor retention capacity.
Operation Mode 2:
The analysis of variance for the test in mode of operation 2 involving the compressor, blower, and isothermal humidifier drive, as shown in Table 2, revealed significant effects for the compressor and blower speed factors, as well as for their interaction on the observed variables. As noted by Alawee et al. (2024), a low Coefficient of Variation indicates lower data variability, evidencing the reliability of the measurements taken.
Figure 10a presents the response surface of the output temperature as a function of the compressor and blower speed, adjusted by the linear model with an adjusted R² of 0.942. In the temperature differential adjustment (Figure 10b), the compressor speed followed a significant linear model, while the blower speed followed a significant quadratic term, with an adjusted R² of 0.849.

Response surfaces of the outlet temperature (a) and temperature difference (b) as a function of the effects of blower and compressor rotation in operating mode 2.
The analysis of the response surface of the output temperature (Figure 10a) revealed that the lowest temperature was obtained with the compressor at 60 Hz and the blower at 30 Hz, while the highest temperature occurred with the compressor at 30 Hz and the blower at 60 Hz. The response surface of the temperature difference (Figure 10b) showed similar behavior, with the highest and lowest temperature differences observed under the same conditions.
The increase in compressor rotation enhanced the cooling capacity, lowering the output temperature. However, in operation mode 2, the isothermal humidifier influenced this dynamic by mixing hot vapor with the cooled air, diminishing the cooling effect. The rise in blower rotation resulted in an increase in the air’s output temperature, a behavior consistent with the study by Hu et al. (2023) on the performance of airflow in finned tube heat exchangers. The authors emphasize that, under low-temperature conditions without freezing, heat transfer efficiency is directly related to the airflow speed. When airflow is increased, it reduces the air’s contact time with the heat exchange surfaces, thus decreasing the effectiveness of heat transfer.
The response surface analysis of relative humidity (Figure 11a) indicated that both the interaction between factors and the linear and quadratic models were significant, with an adjusted R² of 0.961. The inflection points were 64.819 Hz for the compressor and -12.242 Hz for the blower.

Response surfaces of the exit relative humidity (a) and difference between the entry and exit relative humidity (b) as a function of the effects of blower and compressor rotation in operating mode 2.
The response surface analysis of the output relative humidity (Figure 11a) showed that the highest relative humidity value occurred with the compressor operating between 48 Hz and 60 Hz and the blower between 30 Hz and 35 Hz, while the lowest value was observed with the compressor at 30 Hz and the blower at 60 Hz. For the relative humidity difference (Figure 11b), the highest value was achieved with the compressor between 36 Hz and 58 Hz and the blower between 30 Hz and 37 Hz.
It was observed that increasing compressor rotation reduced air temperature, leading to elevated relative humidity, a behavior similar to that reported by Bozkula and Demir (2022), who investigated heat transfer and pressure drop in finned-tube heat exchangers under dry and wet conditions, evaluating parameters such as air velocity and relative humidity.
Using the Box-Behnken Response Surface Model, Bozkula and Demir (2022) observed that increasing compressor speed reduced Colburn’s j factor, indicating greater heat exchange efficiency at reduced air speeds. These results are directly related to the present study, since the higher compressor speed in the SIARCONPAG system increases the heat exchange of the air in the evaporator due to the greater evaporation of refrigerant fluid, reducing the air temperature and consequently increasing the relative humidity of the outlet air. This understanding allows more precise adjustments in the system operation, optimizing psychrometric control and avoiding excessive humidification or inadequate drying of stored grains. In contrast, increasing the blower speed and the consequent reduction in relative humidity, as observed by Liu, Yu and Yan (2020) in their experimental study on finned-tube heat exchangers, was counteracted by the humidifier’s vapor.
Operation Mode 3:
The analysis of variance for the test in mode of operation 3 involving the compressor, blower, main condenser fan, and secondary condenser drive, as shown in Table 3, revealed significant effects for the compressor, blower, and fan speed factors, as well as for the double and triple interactions between these factors. According to Cesca et al. (2021), who conducted a detailed statistical analysis of comfort and animal welfare parameters in Mato Grosso do Sul, Brazil, a low Coefficient of Variation (CV) indicates consistency in the data and robustness in the experimental results.
The response surfaces of the output temperature (Figure 12a, c, e) showed an adjusted R² of 0.914, with inflection points adjusted at 47.677 Hz, 57.880 Hz, and 154.681 Hz for the compressor, blower, and fan speeds, respectively. For the temperature differential (Figure 12b, d, f), the effects of the three factors were highly significant, with an adjusted R² of 0.97 and inflection points adjusted at 58.445 Hz, 83.319 Hz, and 99.612 Hz for the compressor, blower, and condenser fan speeds, respectively.

Response surfaces for outlet temperature (a, c, e) and temperature difference (b, d, f) as a function of the effects of compressor, blower and condenser fan rotation in operating mode 3.
The response surface analysis of the output temperature (Figure 12a) showed that the lowest temperature was achieved with the compressor at 50 Hz and the blower at 30 Hz. For the surface in Figure 12c, the lowest temperature occurred with the compressor at 47.5 Hz and the main condenser fan at 60 Hz. In Figure 12e, the lowest temperature was recorded with the blower at 30 Hz and the main condenser fan at 60 Hz. Regarding the temperature difference, the highest difference was observed in Figure 12b with the compressor at 60 Hz and the blower at 30 Hz; in Figure 12d with the compressor at 60 Hz and the main condenser fan at 60 Hz; and in Figure 12f with the blower at 30 Hz and the main condenser fan at 60 Hz.
It was observed during tests in Mode of Operation 3 that increasing the compressor speed in the SIARCONPAG reduced the output temperature; however, the heat rejected by the secondary condenser mitigated the cooling effect. This behavior is similar to the findings of Venegas et al. (2023), who performed formal analysis and experimental testing of liquid desiccant systems (LDD) integrated with heat pumps, where they found that residual heat impacted cooling efficiency. Although LDD systems are effective in dehumidification, they still require additional cooling to maintain efficiency. In this study, the heat rejected by the secondary condenser has a similar effect, influencing psychrometric control and the stability of grain storage conditions.
Increasing the blower speed raised the output temperature due to the higher air flow through the evaporator, as discussed by Alnakeeb, Saad and Hassab (2021) in their work on heat exchanger performance as a function of air flow speed. This effect was intensified by the heat rejection in the secondary condenser. Increasing the main condenser fan speed resulted in lower heat rejection within the air treatment duct, reducing the output air temperature.
In the response surface adjustments to the relative humidity data, no significant effects of the fan speed were observed, which is why the adopted model included only the compressor and blower speeds (Figure 13). The quadratic model proved highly significant, with an adjusted R² of 0.953. The inflection points were 59.674 Hz and 27.816 Hz for the compressor and blower speeds, respectively.

Response surface of the exit relative humidity as a function of the effects of compressor and blower rotation in operating mode 3.
The response surface analysis of the output relative humidity (Figure 13) showed that the highest relative humidity value occurred near the inflection point, with the compressor operating at 59 Hz and the blower at 30 Hz.
The increase in compressor speed raised the relative humidity of the output, as also observed by Zhao, Wang, and Ge (2021) in their study on desiccant-coated heat exchangers (DCHE), which enhance dehumidification efficiency and latent heat handling capacity. The DCHE proved more effective than traditional methods, such as fixed beds and rotary wheels, offering greater energy and cooling efficiency. In the present study, the heat rejected by the secondary condenser mitigated this effect, showing a resemblance to the DCHE results, where dehumidification is optimized through efficient thermal exchange, which contributed to psychrometric control in the SIARCONPAG. Increasing the blower speed resulted in a reduction in relative humidity, as discussed by Eleiwi et al. (2021), who state that increasing the air speed reduces the heat transfer coefficient in thermal exchangers, lowering the relative humidity. This effect was also amplified by the heat rejected in the secondary condenser.
The reduction in the rotation speed of the main condenser fan, by increasing the heat rejected by the secondary condenser, resulted in a decrease in the relative humidity of the output, as also observed by Wang et al. (2021) in their study of a heat pump drying system with partial air dehumidification (PADHPD). The proposed system exhibited an average COP of 3.58, with an SMER of 2.282 kg kW−1 h−1, indicating energy efficiency in moisture removal. However, exergy analyses revealed that the greatest loss of efficiency occurred in the evaporator, a behavior also observed in the present study, where moisture control was shown to be dependent on the optimization of airflow and heat rejection, although without statistical significance in the effects of the fan.
Conclusions
This study introduced the Autonomous System for Cooling and Psychrometric Control of Grain Storage Conditions (SIARCONPAG), a prototype capable of autonomously adjusting outlet air conditions. Compressor and blower rotation variations significantly influenced temperature and humidity, enabling effective control of inlet air conditions. With precise statistical models, the system proved effective across various climates, reducing post-harvest losses and enhancing food security. SIARCONPAG is a viable, energy-efficient solution that promotes sustainable practices in grain storage.
References
- Alawee, W. H. et al. (2024). Predicting the cumulative productivity of a solar distillation system augmented with a tilted absorber panel using machine learning models. Journal of Engineering Research, In Press, Corrected Proof.
- Alconada, T. M., & Moure, M. C. (2022). Deterioration of lipids in stored wheat grains by environmental conditions and fungal infection: A review. Journal of Stored Products Research, 95:101914.
- Alnakeeb, M. A., Saad, M. A., & Hassab, M. A. (2021). Numerical investigation of thermal and hydraulic performance of fin and flat tube heat exchanger with various aspect ratios. Alexandria Engineering Journal, 60(5):4255-4265.
- Alvares, C. A. et al. (2013). Köppen’s climate classification map for Brazil. Meteorologische Zeitschrift, 22(6):711-728.
- Ayad, F. et al. (2021). Thermal-hydraulic experimental study of louvered fin-and-flat-tube heat exchanger under wet conditions with variation of inlet humidity ratio. Applied Thermal Engineering, 183:116218.
- Baidhe, E., & Clementson, C. L. (2024). A review of the application of modeling and simulation to drying systems for improved grain and seed quality. Computers and Electronics in Agriculture, 222:109094.
- Boquet, R., Chirife, J., & Iglesias, H. A. (1978). Equations for fitting water sorption isotherms of foods: II. Evaluation of various two-parameter models. International Journal of Food Science & Technology, 13(4):319-327.
- Bozkula, G., & Demir, H. (2022). Experimental investigation of heat transfer and pressure drop of fin and tube heat exchanger under dry and wet conditions. International Journal of Thermal Sciences, 177:107580.
- Cesca, R. S. et al. (2021). Thermal comfort of beef cattle in the state of Mato Grosso do Sul, Brazil. Ciência e Agrotecnologia, 45:e008321.
- Chen, K. et al. (2023). Inner cyclic cooling aeration on stored maize in large commercial warehouses in Northeast China. International Journal of Food Properties, 26(2):3376-3389.
- Chung, D. S., & Pfost, H. B. (1967). Adsorption and desorption of water vapor by cereal grains and their products. Transactions of the ASAE, 10:549-557.
- De Sousa, I. G. et al. (2023). Advances in environmentally friendly techniques and circular economy approaches for insect infestation management in stored rice grains. Foods, 12(3):511.
- Eleiwi, M. A. et al. (2021). Effect of front air attack angles on heat transfer coefficient of the cross-flow of four flat tube. Heat Transfer, 50(1):638-654.
- Gomes, F. P. (2023). Curso de estatística experimental 15 ed. Piracicaba: Editora FEALQ.
- Goulart, D. F. et al. (2024). The predictors driving farmers’ decision on drying and storage technology adoption. Journal of Stored Products Research, 105:102216.
- Hu, W. et al. (2023). Air side performance of fin-and-tube heat exchangers with a hydrophilic layer under low-temperature frost-free conditions. Applied Thermal Engineering, 219:119532.
-
Instituto Brasileiro de Geografia e Estatística - IBGE. (2024). Banco de dados de informações ambientais: Mapeamento de Recursos Naturais (MRN) Available in: <https://biblioteca.ibge.gov.br/visualizacao/livros/liv102042.pdf. 2024>.
» https://biblioteca.ibge.gov.br/visualizacao/livros/liv102042.pdf. 2024 - Jianyao, Y. et al. (2023). Technical methods of national security supervision: Grain storage security as an example. Journal of Safety Science and Resilience, 4(1):61-74.
- Liu, S. et al. (2024). Performance analysis of a temperature and humidity independent control system with high temperature chilled water cooling and condensing heat regenerating for office buildings. Energy Conversion and Management, 308:118400.
- Liu, X., Yu, J., & Yan, G. (2020). An experimental study on the air side heat transfer performance of the perforated fin-tube heat exchangers under the frosting conditions. Applied Thermal Engineering, 166:114634.
- Maciel, G. et al. (2020). Determination of safe storage moisture content of soybean expeller by means of sorption isotherms and product respiration. Journal of Stored Products Research, 86:101567.
- Mattos, D. G. et al. (2023). Precooling and cold storage effects on antioxidant system in calla lily postharvest. Ciência e Agrotecnologia, 47:e018022.
- Naik, M. et al. (2024). Grain drying. In C. K. Sunil. et al. Unit operations in food grain processing Academic Press, (pp. 129-159).
- Müller, A. et al. (2022). Rice drying, storage and processing: Effects of post-harvest operations on grain quality. Rice Science, 29(1):16-30.
- Poutanen, K. S. et al. (2022). Grains-a major source of sustainable protein for health. Nutrition Reviews, 80(6):1648-1663.
- Santos, R. C. et al. (2020). Expert systems as a tool to manage accident risks in grain storage facilities. Semina: Ciências Exatas e Tecnológicas, 41(1):87-94.
- Silva, N. C. D. et al. (2020). Enthalpy thematic map interpolated with spline method for management of broiler chicken production. Revista Brasileira de Engenharia Agrícola e Ambiental, 24(7):431-436.
- Venegas, T. et al. (2023). Review of liquid desiccant air dehumidification systems coupled with heat pump: System configurations, component design, and performance. Energy and Buildings, 279:112655.
- Venkateswarlu, K., & Reddy, S. K. (2024). Recent trends on energy-efficient solar dryers for food and agricultural products drying: A review. Waste Disposal & Sustainable Energy, 6:335-353.
- Wang, D. et al. (2021). Experimental investigation of a part air dehumidification cascade-like heat pump drying system. International Journal of Refrigeration, 131:235-243.
- Wu, W. et al. (2022). Experimental investigation of heat transfer performance of a finned-tube heat exchanger under frosting conditions. Sustainable Cities and Society, 80:103752.
- Yajima, T., Ohkubo, H., & Seki, M. (2021). Research on defrost free air-source heat pump with surface stripe concavo-convex fins. Energy and Buildings , 231:110568.
- Zhao, L. H., Wang, R. Z., & Ge, T. S. (2021). Desiccant coated heat exchanger and its applications. International Journal of Refrigeration, 130:217-232.