
 Impact of different biochar doses and irrigation levels on buckwheat grain yield, quality and water productivity: Artificial neural network (ANN) modeling approach
ABSTRACT
The effective use of water and the role of soil amendments are gaining increasing importance in sustainable agricultural practices. This study examined how changing irrigation water levels and biochar dosages affect the production and quality of buckwheat. In the study, 5 different irrigation water levels (100%,75%, 50%, 25% and 0%) and 5 biochar doses (1000 kg, 750 kg, 500 kg, 250 kg and 0 kg per decare) were applied in Bilecik conditions. Grain yield, water productivity, mineral content (Mg, K, P, Fe, Zn, Cu), total starch, crude protein, crude oil content, fibre and ash were analyzed. Application result show that the average grain yield increased when the irrigation water level and biochar dose increased. The highest grain yield was determined from the B100×I75 (2311.6 kg ha-1) interaction. Irrigation water and water use efficiency values increased with decreasing irrigation water level and plant water consumption. The analysis indicated that under stressful conditions, some quality criteria increased. Biochar enhances soil water retention, reduces evaporation losses, and improves irrigation efficiency, thereby supporting plant growth under water stress and enabling higher yields with reduced irrigation. In addition, according to the analysis results using the ANN model, the issue where 92% irrigation and biochar application was applied came to the fore.
Index terms:
Fagopyrum esculentum; water stress; water productivity
RESUMO
O uso eficiente da água e o papel dos melhoradores do solo estão se tornando cada vez mais importantes nas práticas agrícolas sustentáveis. Este estudo examinou como a variação nos níveis de irrigação e nas doses de biocarvão afeta a produção e a qualidade do trigo-sarraceno. Foram aplicados cinco níveis diferentes de irrigação (100%, 75%, 50%, 25% e 0%) e cinco doses diferentes de biocarvão (1000 kg, 750 kg, 500 kg, 250 kg e 0 kg por decare) nas condições de Bilecik. Foram analisados o rendimento de grãos, a produtividade da água, o conteúdo mineral (Mg, K, P, Fe, Zn, Cu), o teor de amido total, proteína bruta, óleo bruto, fibra e cinzas. Os resultados mostraram que o rendimento médio dos grãos aumentou com o aumento dos níveis de irrigação e das doses de biocarvão. O maior rendimento foi obtido na interação B100×I75 (2311,6 kg ha-¹). A eficiência do uso da água aumentou à medida que os níveis de irrigação e o consumo de água pelas plantas diminuíram. A análise indicou que, sob condições de estresse hídrico, algumas características de qualidade foram melhoradas. O biocarvão melhora a retenção de água no solo, reduz as perdas por evaporação e aumenta a eficiência da irrigação, apoiando assim o crescimento das plantas sob estresse hídrico e permitindo maiores rendimentos com menor irrigação. Além disso, de acordo com os resultados da análise utilizando o modelo de Rede Neural Artificial (RNA), destacou-se a condição em que foram aplicados 92% de irrigação e biocarvão.
Termos para indexação:
Fagopyrum esculentum; estresse hídrico; produtividade da água
Introduction
The agricultural sector is one of the largest water consumers globally, accounting for approximately 70% of total water use. Considering the growing population, climate change, and the limited nature of water resources, efficient and effective water use in agriculture has become more critical than ever (Food and Agriculture Organization of the United Nations - FAO, 2017). Improving agricultural water management is essential to ensure sustainable food production and minimize environmental impacts. Water efficiency encompasses a set of strategies aimed at increasing the amount of agricultural yield per unit of water, and in this context, smart water management enhances agricultural productivity while preserving water resources (Jägermeyr et al., 2021). Particularly in arid and semi-arid regions, where water resources are dwindling, water efficiency practices are indispensable for addressing water scarcity. New methods and advanced technologies developed in this field enable more efficient use of water.
Biochar, with its carbon-rich and porous structure, contributes to agricultural water efficiency by increasing the soil’s water retention capacity. When applied to soil, this organic material helps retain water in the root zone for longer periods, reducing plant water stress and enhancing crop yields, especially in arid and semi-arid regions (Lehmann & Joseph, 2024). Additionally, biochar prevents nutrient loss by retaining plant nutrients in the soil for extended periods, making fertilizer use more efficient. Its ability to regulate soil pH creates a more favorable environment for plant growth in acidic soils. Furthermore, by improving the physical structure of the soil, biochar increases infiltration rates, thereby reducing water loss and decreasing irrigation frequency (Jeffery et al., 2015; Lima et al., 2024). These positive effects of biochar on water and nutrient retention capacities offer significant advantages for the sustainability of agriculture, particularly in regions heavily impacted by climate change and water scarcity.
Buckwheat (Fagopyrum esculentum) stands out in agriculture due to its ease of cultivation and environmental resilience. Adaptable to harsh climatic conditions, this crop can thrive even in soils with low nutrient content, offering a wide range of planting opportunities. Moreover, its rapid growth and ability to suppress weeds help reduce the need for pesticides (Campbell, 1997). These characteristics make buckwheat a favored crop in environmentally friendly agriculture, strengthening its role in sustainable farming (Borgonovi et al., 2023).
Buckwheat, a pseudocereal, is particularly noteworthy for being gluten-free, having high nutritional value, and offering various health benefits (Zhang et al., 2024). Its composition, rich in dietary fiber, protein, and essential amino acids, especially lysine, makes it a highly nutritious food source (Tomotake et al., 2002). The high levels of lysine and other amino acids make this pseudocereal a more balanced protein source compared to traditional cereals (Watanabe, 1998). Additionally, the bioactive components in buckwheat grains, such as rutin, possess antioxidant properties and may exhibit anti-inflammatory effects (Kim, Kim, & Park, 2004). These components help prevent cellular damage in the body, strengthen blood vessels, and contribute to the health of the circulatory system.
For field experiments in agricultural activities to yield acceptable findings, additional time, effort, land, and financial resources are required. The Artificial Neural Network (ANN) model can accurately assess the degree of influence by generating high-precision predictions (Arslan, 2011; Arslan, 2014). Since ANN is a modeling approach capable of forecasting values it has not previously encountered, it serves as a valuable tool for limited datasets. The difficulty of data acquisition due to the extensive study area required, prolonged experimental periods, and variable environmental conditions represents one of the novel aspects of this study. In this research, an ANN model was developed and applied for the first time to predict the effects of different biochar doses and irrigation water levels on buckwheat grain yield. This approach enables obtaining more reliable results with fewer field experiments. In addition, irrigation water use efficiency value and some quality characteristics were determined and correlation analysis was performed between the quality characteristics.
Material and Methods
Field experiments
Field study was carried out in 2024 in an experimental field located in Bilecik (40° 09’ N, 29° 59’ E), Turkey. The study was carried out under controlled conditions in a greenhouse. The research site is located in the semiarid climate zone of Bilecik Province, which has an average annual temperature of 12.5°C and an average yearly precipitation of 459.3 mm. Meteorological data were obtained from the Bilecik State Meteorological Station and the average temperature during the growing period was 20.1°C and the total precipitation was 118 mm. The chemical properties of the soil in the experimental area are summarized in Table 1. The soil texture varied from ‘sandy-clay-loam (SCL)’ at the top layers to ‘sandy-clay-loam (SCL)’ at the deeper layers. Soil analyses were conducted at the Soil, Plant and Water Analysis Laboratory of Bilecik Şeyh Edebali University. The data obtained from the chemical analysis revealed that the soil is suitable for growing buckwheat.
Experimental design
The Güneş buckwheat was used as the crop material in this study. The Güneş cultivar was registered by the Bahri Dağdaş International Agricultural Research Institute. It is a variety with a plant height ranging from 85 to 100 cm, white flower color, a thousand grain weight of 22-30 g, a hectoliter weight of 60-68 kg, and a protein content of 11-14%. It can be cultivated in all regions of Turkey, with an average yield of approximately 120 kg da-1. The split plot experiment followed a randomized complete block design with three replications. Buckwheats were planted on April 16 and harvested on July 13. At planting, 10 kg of DAP base fertilizer was applied per decare. A randomized block design was adopted with plots of 5.4 m2 (1.8 × 3 m) with three replications. Each parcel consists of 6 rows (30 cm between rows, 5 cm between plants). The main plots consist of 5 biochars amount and the subplots consist of 5 irrigation levels. (Table 2). Irrigation scheduling was based on cumulative evaporation measured using a Class A Pan (Atlas-MET, İstanbul, Türkiye). Irrigation was done at 15-day intervals and irrigation issues were made as 100% of total evaporation and restrictions. Biochar was applied to the plots at 1000 kg, 750 kg, 500 kg, 250 kg and 0 kg per decare (Table 2).
Biochar and irrigation water level subjects who constitute the upper main parcels and subparcels.
Irrigation water amount and plant water consumption
In the current experiments, the drip irrigation method was used. During the first irrigation, enough water was applied to bring the soil’s available moisture to field capacity. Afterward, equal amounts of irrigation water were provided to all treatments for a period of three weeks, allowing the seedling root systems to develop. Once the plants reached sufficient growth, the irrigation treatments began. The amount of water to be applied to each treatment was determined using a Class-A evaporation pan placed on the experimental fields. The cumulative open water surface evaporation values were measured and applied at intervals of 15 days. The irrigation levels were set at 100%, 75%, 50%, 25% and 0% of the cumulative evaporation values.
The irrigation amounts were calculated using Equation 1 (Eylen et al., 1986).
where I is the irrigation amount (mm), kp is the pan coefficient, Epan is the total cumulative evaporation measured from the Class A pan (mm).
The key indicators used to describe the relationships between plant yield and water use include irrigation water use efficiency (IWUE). IWUE reflects the yield obtained per unit of water applied to the plant. The IWUE values were calculated using the Equation 2 (Howell, 2001).
where IWUE is the irrigation water use efficiency (kg ha-1mm-1), Y is the yield (kg ha-1), and I is the volume of seasonal irrigation water applied (mm).
Quality parameters
As a result of this study, samples taken from the harvested grains were prepared to determine their quality characteristics. Crude fat, crude protein, total starch, fibre and ash parameters were determined. Starch content: Total starch content was determined with the aid of an enzymatic test kit (Megazyme International Ireland Ltd., Wicklow, Ireland). Fat content was determined by the Soxhlet method. Nitrogen contents were determined in accordance with the Kjeldahl method and resultant values were converted into protein contents by multiplying by a coefficient of 6.25. This method is accepted by the AACC method 46.12.01 (American Association of Cereal Chemists - AACC, 1995). Ash content was determined 1 g of the samples dried at 60 ºC until they reach a constant weight and ground will be taken and burned at 550 ºC for 8 hours to express the ash content as a percentage.
Mineral composition
For mineral analysis (P, K, Mg, Fe, Zn and Cu), about 0.5 g of sample was supplemented with 10 mL of a nitric + perchloric acid mixture, and the resultant mixture was subjected to wet digestion until approximately 1 mL of sample remained. Resultant solutions were diluted with distilled water, and readings were performed using an ICP OES spectrophotometer (inductively coupled plasma spectrophotometer) (Perkin- Elmer, Optima 4300 DV, ICP/OES, Shelton, CT 06484-4794, USA) (Mertens et al., 2005).
Grain yield
To record the grain yield, the buckwheat crop was manually harvested from three randomly selected 1 m × 2 m areas within the central area of each plot. The grain yield is expressed for 12% moisture content.
Artificial neural network (ANN) modelling
ANN is successfully used for modeling many processes (Arat & Arslan, 2017; Arslan et al. 2024; Boukelia, Arslan, & Mecibah, 2016). ANN is a useful tool since it enables to viewing the problems on a large scale with limited data (Arslan, 2011; Arslan, 2014). ANN also has the capability for the modelling of agricultural problems (Karaer et al., 2024). In this study, the yield variation by the irrigation and biochar levels were analyzed through ANN modeling. The feed forward back propagation learning algorithm was used in this sense. The Levenberg-Marguardt (LM) algorithm was used as the training algorithm. The data was normalized in the range of 0.3 and 0.7 to scale all parameters to the equivalent degree for faster and more sensitive results (Tugcu; Arslan 2017). The logarithmic sigmoid (logsig) Equation 3 was used for the forecasting:
Here, w is the weight, y is the output value, and b is the bias. The ANN topology comprised three layers: input, hidden and output. In the training stage, different numbers of neurons were run to obtain the best structure. According to this, the best structure was obtained as the topology with five neurons. The ANN structure is given in Figure 1.
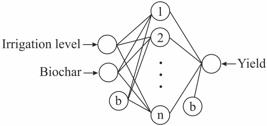
The accuracy of the network was separately measured for the training and testing stages by the coefficient of multiple determinations (R2), mean percentage error (MPE), Root Mean Square Error (RMSE), and co-variation (CoV). According to statistical evaluation, R2, MPE, and CoV values were obtained as 0.939, 4.757, and 13.31 for the training stage, respectively. These values were obtained as 0.991, 3.139, and 3.764 for the testing stage. The comparison of the experimental and ANN outputs is given in Figure 2.

Statistical analyses
Yield, IWUE and quality parameters were subjected to analysis of variance (ANOVA) using Minitab 19 software. The significance of irrigation and biochar was determined using the F test. When the F-test was significant, the Tukey test (P < 0.05) was used to compare group means of irrigation and biochar treatments and their interactions. Descriptive statistics and correlation analysis were employed to identify patterns.
Results and Discussion
Plant water consumption and irrigation
The amounts of irrigation water applied to the I100, I75, I50, I25 and I0 treatments were 511.25 mm, 393.40 mm, 275.57 mm, 157.79 mm and 0 mm respectively. All plots in the experiment were given an equal amount of water (40 mm) after planting until the plant height reached approximately 10 cm. Later, themed irrigation applications were started.
Grain yield
The data indicate that both irrigation levels and biochar applications have a significant effect on buckwheat grain yield (Table 3). The lowest average grain yield was observed at the non-irrigated (I0) level, with an average of 461.81 kg ha-1, while a significant increase in yield was recorded as irrigation levels increased. The highest average grain yields were obtained at the I75 (1582.86 kg ha-1) and I100 (1442.02 kg ha-1) levels, showing the crucial role of water in buckwheat growth. The literature also indicates that buckwheat is sensitive to water stress and that sufficient irrigation increases yield. Podolska et al. (2019) reported that abiotic stress factors, such as water stress, significantly affect plant growth and yield.
A general upward trend in yield was observed as the biochar level increased. While the average grain yield was 733.92 kg ha-1 at the B0 level, this value reached 1393.00 kg ha-1 at the B100 level. The interaction between irrigation and biochar levels was found to be statistically significant (p<0.01). Grain yield ranged between 274.6 kg ha-1 and 2311.6 kg ha-1, with the highest yield obtained from the B100×I75 interaction and the lowest from the B0×I0 interaction. The results indicate that biochar enhances soil water retention capacity, thereby mitigating drought stress and increasing yield, which is consistent with previous studies (Laird et al., 2010; Jeffery et al., 2017). Moreover, the findings suggest that biochar applications can improve yield, particularly under low irrigation conditions, reducing the adverse effects of water deficiency. This supports studies demonstrating that biochar enhances soil water retention capacity (Schmidt et al., 2021). Numerous previous studies have demonstrated the positive impact of applying biochar, as a commonly used soil amendment, in enhancing crop yield (Li et al., 2022; Han et al., 2023), although this is dependent on the initial fertility status of the soil (Vijay et al., 2021).
ANN modeling for grain yield
According to the trends in Figure 2, the ANN structure has a high capability to figure out the yield output. The statistical evaluations show that the ANN model is highly agreeable for the handled problem. Using the ANN model, the yield variation is observed for the different irrigation levels as given in Figure 3.

According to Figure 3, the yield increases with the increase of irrigation level till a certain point, then it starts to decrease sharply. The maximal yield output is obtained at the higher biochar levels. Also, the highest yield is obtained at the irrigation level ranging between 92 and 96. The yield outputs were recorded as 3090.9, 2987.7, 2823.8, and 2702.9 kg ha-1 for biochars, levels of 100, 90, 80, and 70, respectively. The yield variation is also observed for the different biochar as given in Figure 3.
According to Figure 4, the yield increases with the increase of biochar level. The maximal yield output is obtained at 92 and 93 irrigation levels (Figure 4). The yield outputs were recorded as 3095.3, and 3090.9 kg ha-1 for irrigation levels of 93, and 92, respectively.

Water productivity
Irrigation Water Use Efficiency (IWUE) is a crucial indicator that represents the yield obtained per unit of water used (Zwart; Bastiaanssen, 2004). The findings indicate that both irrigation level and biochar application significantly affect IWUE (Figure 5). The IWUE values calculated from the interaction of irrigation and biochar ranged between 2.08 and 6.04 kg ha⁻¹ mm⁻¹, with the highest IWUE recorded in the B100×I25 interaction, while the lowest was observed in the B0×I100 interaction. Although the second highest IWUE value was obtained from the B100×I75 interaction, no statistically significant difference was found between this treatment and B100×I25. Overall, higher IWUE values were observed under lower irrigation levels (I25), which can be attributed to the tendency of plants to use water more efficiently under drought conditions (Karam et al., 2007). Notably, IWUE values were highest at the B100 biochar level, suggesting that biochar enhances soil water retention capacity, thereby improving water availability to plants (Laird et al., 2010). A study conducted by Duraktekin et al. (2017) examined the effects of different irrigation levels on grape yield and water use efficiency (IWUE). Their findings demonstrated that while maximum yield was obtained under full irrigation conditions, IWUE was higher under deficit irrigation. This supports the idea that controlled irrigation strategies can enhance IWUE, particularly in water-limited environments.

Lower IWUE values were generally observed at low biochar levels (B0 and B25), with the lowest IWUE recorded in the B0×I100 interaction. These findings are similar to previous studies indicating that excessive irrigation can lead to substantial water losses, thereby reducing water use efficiency (Farooq et al., 2009). Similarly, a study by Yu, Raichle and Sink (2013) reported that biochar application improves the water retention capacity of sandy loam soils, making plants more resilient to water stress. This further supports the positive impact of biochar on IWUE. The results suggest that biochar application can enhance IWUE, particularly under low irrigation levels. Notably, the highest IWUE value was obtained in the B100×I25 interaction, highlighting the potential of biochar application to sustain buckwheat production in water-scarce regions.
Quality features
As shown in Table 4, an overall decreasing trend in protein content is observed as irrigation levels increase. For instance, while the average protein content at the I0 level is 18.90%, it decreases to 18.05% at the I100 level. This phenomenon can generally be attributed to the dilution effect, where increased irrigation reduces protein synthesis in plants. Indeed, previous studies have demonstrated that higher irrigation levels lead to a decrease in protein content (Zhang et al., 2017). Regarding biochar levels, the highest protein content (19.24%) was recorded in the B100 treatment. Biochar may enhance protein synthesis by improving soil structure and increasing nitrogen retention (Lehmann & Joseph, 2024). Additionally, biochar is known to support microbial activity in the soil, which can positively influence protein content. When examining the interaction between biochar and irrigation, protein content varies between 16.26% and 20.78%. The highest value was observed in the B100×I25 interaction, while the lowest was recorded in the B0×I100 interaction. These findings further confirm that biochar enhances protein content. Furthermore, it is evident that protein content increases in response to water stress.
In terms of total starch content, an increasing trend is observed as irrigation levels increase. While the average total starch content is 26.05% at the I0 level, it rises to 32.42% at the I100 level. This indicates that carbohydrate metabolism intensifies in parallel with the decline in protein synthesis. It is well known that there is an inverse relationship between protein content and starch accumulation (Guo et al., 2023). As irrigation increases, protein synthesis weakens, leading to a greater accumulation of photosynthetic products in the form of carbohydrates (starch). Regarding biochar levels, the highest total starch content is observed at the B75 level (33.40%). Biochar may enhance carbohydrate synthesis by improving soil water retention capacity. Additionally, the organic compounds present in biochar may support plant physiological activity, positively influencing starch synthesis (Jeffery et al., 2017). When examining the biochar-irrigation interaction, total starch content varies between 11.96% and 44.11%. The highest starch content is recorded in the B50×I100 interaction, whereas the lowest is observed in the B100×I100 interaction. Previous studies have also reported similar findings. Daryanto, Wang and Jacinthe (2016) observed that under drought conditions (limited irrigation), the protein content of cereals increased, while starch content decreased. Similarly, Ghobadi et al. (2013) reported that increased water restriction enhanced protein synthesis but reduced starch accumulation. Laird et al. (2010) stated that biochar application contributes to protein synthesis by increasing soil organic matter content while also enhancing starch accumulation through carbon fixation. Glaser et al. (2001) emphasized that biochar increases protein content under water-limited conditions, whereas it promotes carbohydrate (starch) accumulation under sufficient irrigation levels. Moreover, Vaccari et al. (2015) reported that biochar improves quality parameters in cereals by enhancing soil water retention capacity.
According to the table, crude fat content varies with both irrigation levels (IL) and biochar levels (BL). The highest crude fat content was observed in the B50×I25 interaction (5.65%), while the lowest value was found in the B0×I100 combination (2.98%). These results indicate that biochar and irrigation levels have significant effects on crude fat content. The lowest average crude fat content (3.37%) was obtained from the treatment without biochar application, whereas biochar application led to an increase in crude fat content, with the highest average crude fat content recorded in the B50 treatment (4.08%). Previous studies have demonstrated that biochar applications improve soil properties, enhance nutrient uptake by plants, and consequently affect quality parameters such as crude fat content (Lehmann & Joseph, 2024). Some studies suggest that water stress can alter crude fat composition and that these changes can be modulated by biochar application (Xu et al., 2014).
Fiber content also varies with both irrigation levels (IL) and biochar levels (BL). The highest fiber content was observed in the B100×I100 combination (20.95%), whereas the lowest value was found in the B50×I100 combination (8.13%). Biochar application caused changes in fiber content. The highest mean fiber content was observed in B25 (17.08%) and the lowest mean fiber content was observed in B50 (13.32%). The results indicate that irrigation water levels are influential. Under stress conditions, fiber content increased, whereas it decreased with higher irrigation levels. The highest average fiber value was obtained from the I0 treatment (16.80%), while the lowest average fiber value was recorded in the I100 treatment (13.88%). Biochar applications are known to improve soil structure, enhance water retention capacity, and contribute to the synthesis of plant compounds (Lehmann & Joseph, 2024). However, the effect of irrigation levels on fiber content has shown mixed results in various studies. For instance, some studies have reported that water stress can enhance fiber synthesis (Zhou et al., 2014). The effect of irrigation levels on fiber content remains complex; while some research suggests that water restriction increases fiber content, others indicate that optimal irrigation supports fiber synthesis (Maina et al., 2021; Li et al., 2024). As irrigation levels increased, a decrease in ash content was observed. The highest average ash content was recorded in the I25 treatment (5.20%), whereas the lowest ash content was obtained from the I100 treatment (3.80%). Biochar had a positive effect on ash content, with the highest average ash content found in the B100 treatment (4.76%) and the lowest in the B50 treatment (4.01%). The interaction between biochar and irrigation water resulted in ash content ranging from 2.96% to 6.63%. The highest ash content was observed in the B100×I25 interaction, while the lowest ash content was recorded in the B0×I100 interaction. The literature suggests that excessive irrigation can lead to nutrient leaching in the soil, causing imbalances in plant nutrition. Several studies have reported that biochar improves soil physical and chemical properties, thereby positively influencing plant growth and nutrient uptake (Günal & Erdem, 2018).
Mineral content
The findings indicate that biochar and irrigation levels have varying effects on the content of Fe, Zn, K, Mg, P, and Cu, as shown in Table 5.
Iron (Fe) content exhibited a broad range of variation depending on biochar and irrigation levels. The highest Fe concentration was observed in the B75×I25 (141.54 ppm) and B50×I100 (136.45 ppm) treatments. This suggests that moderate to high levels of biochar applications may enhance Fe content. However, in the I100×B100 interaction, Fe content significantly decreased (40.79 ppm). This reduction may be attributed to the potential effect of biochar in increasing soil cation exchange capacity (CEC), thereby influencing the availability of micronutrients to plants (Lehmann & Joseph, 2024).
Zinc (Zn) content ranged between 9.22 ppm and 46.46 ppm. The highest Zn concentration was recorded in the B25×I75 interaction, while the lowest Zn content was found in the B100×I25 treatment. This suggests that high biochar doses may have an antagonistic effect on certain nutrient elements.
Potassium (K) content also varied across treatments. The highest K concentration was observed in the B75×I25 interaction (9240.63 ppm), whereas the lowest was in B50×I100 (6517.22 ppm). It is well known that biochar application can enhance soil structure, thereby improving potassium uptake (Major et al., 2012). However, the effect of excessive biochar application on K uptake may depend on interactions with other soil nutrients.
Magnesium (Mg) content was found to be sensitive to changes in irrigation levels, with the highest value recorded in B75×I25 (2145.86 ppm). A decline in Mg concentration was observed under full irrigation conditions, specifically in B50×I100 (1694.25 ppm) and B0×I100 (1483.82 ppm). This reduction suggests that excessive irrigation may lead to leaching of Mg, thereby decreasing its bioavailability in the soil (Glaser, Lehmann, & Zech, 2002).
Phosphorus (P) content was influenced by both biochar and irrigation applications. The highest P concentration was found in the B75×I25 interaction (10,860.19 ppm), while the lowest was in B0×I100 (7,281.26 ppm). Moderate biochar application appears to enhance phosphorus uptake, potentially due to its ability to increase soil phosphorus retention capacity and improve plant availability (Vaccari et al., 2015).
Copper (Cu) content remained relatively low, ranging from 0.39 ppm to 6.54 ppm. The highest Cu concentrations were recorded in the B100×I25 (6.54 ppm) and B75×I25 (6.44 ppm) interactions, possibly due to the enhancing effect of biochar on micronutrient availability.
Overall, the results indicate that biochar and irrigation levels exert differential effects on nutrient content. Moderate biochar applications (B50-B75) generally enhanced certain nutrient elements, whereas excessive biochar application (B100) or its absence (B0) resulted in decreased concentrations of specific nutrients. Irrigation levels also played a crucial role, with excessive irrigation leading to reductions in certain mineral contents. Biochar applications can enhance nutrient uptake and thereby improve plant productivity. For instance, biochar derived from livestock manure has been shown to increase maize stem biomass and dry biomass while also enhancing potassium (K) and phosphorus (P) contents in plants. These effects are attributed to biochar’s ability to improve soil nutrient availability and support root development (Gümüş, Negiş & Şeker, 2022).
These findings suggest that biochar and irrigation levels significantly influence the mineral composition of buckwheat grains. Determining the optimal biochar dosage and irrigation level is critical for maximizing nutrient uptake by plants. However, excessive biochar applications may reduce the bioavailability of certain nutrients. Therefore, appropriate biochar and irrigation strategies should be developed, taking into account regional soil properties and plant requirements.
Correlation Analysis
In this study, the effects of biochar and different irrigation levels on the nutrient content and yield of buckwheat seeds were investigated using Pearson correlation analysis. The results of the study indicate that there are significant correlations between certain components (Figure 6).

A negative correlation was found between crude protein and total starch (r = -0.273, p = 0.018). This suggests that an increase in starch content leads to a decrease in protein content. Similarly, a significant negative correlation was observed between protein content and zinc (Zn) (r = -0.480, p < 0.001). This result indicates that an increase in zinc levels may have a suppressive effect on protein content. On the other hand, strong positive correlations were observed between protein content and nutrient elements such as magnesium (Mg) and phosphorus (P) (r = 0.689 and r = 0.529, p < 0.001). These findings support previous studies that have indicated that Mg and P contribute to protein synthesis in buckwheat (Wang et al., 2015).
Negative correlations were detected between total starch and magnesium and phosphorus (r = -0.494 and r = -0.572, p < 0.001). This suggests that high levels of Mg and P may adversely affect starch accumulation. Iron (Fe) showed a positive correlation with total starch (r = 0.515, p < 0.001). Considering Fe’s role in carbohydrate metabolism, this relationship is biologically significant.
A negative correlation was found between grain yield and crude protein (r = -0.363, p < 0.001). This finding suggests that an increase in protein content generally decreases yield, indicating a balance between protein and carbohydrate accumulation. In contrast, strong positive correlations were observed between grain yield and Mg and P (r = 0.780 and r = 0.862, p < 0.001). This result suggests that Mg and P are essential macronutrients that support grain development and can increase yield. A positive correlation was also found between zinc (Zn) and grain yield (r = 0.262, p = 0.023). Given the critical role of Zn in protein and enzyme synthesis, the physiological basis of this relationship is clear (Marschner, 2011).
A positive but weak correlation was detected between fiber content and protein (r = 0.157, p = 0.178). However, the relationship between fiber and starch content was found to be strong and negative (r = -0.942, p < 0.001). This strong negative correlation between fiber and starch is consistent with previous studies indicating that grains with higher fiber content tend to have lower starch content (Zhang et al., 2019).
These results highlight the importance of balanced management of nutrient elements and chemical components in buckwheat for both quality and yield. Specifically, it has been determined that Mg and P have significant effects on yield and protein content.
Conclusions
This study revealed that applying 1000 kg ha⁻¹ biochar with 75% irrigation significantly improved buckwheat grain yield, WUE, and grain quality. Biochar, promoted water and nutrient retention, and alleviated drought stress. The increased yield and IWUE values with rising biochar doses demonstrate this. Quality traits also improved under limited water conditions. ANN modeling indicated that maximum yield does not necessarily require full irrigation or the highest biochar doses. Integrating optimized biochar and irrigation strategies supports sustainable and efficient buckwheat production.
Data Availability Statement
Data available upon request to authors.
References
-
American Association of Cereal Chemists - AACC. (1995). AACC method 32-07: Determination of soluble, insoluble and total dietary fiber in foods and food products Approved Methods of the American Association of Cereal Chemists, 9th ed. The Association, St. Paul, MN. Available in: <https://www.cerealsgrains.org/resources/Methods/Pages/32Fiber.aspx>
» https://www.cerealsgrains.org/resources/Methods/Pages/32Fiber.aspx - Arat, H., & Arslan, O. (2017). Optimization of district heating system aided by geothermal heat pump: A novel multistage with multilevel ANN modelling. Applied Thermal Engineering, 111: 608-623.
- Arslan, A. E. et al. (2024). Hybrid modeling for the multi-criteria decision making of energy systems: An application for geothermal district heating system. Energy, 286:129590.
- Arslan, O. (2014). ANN-based determination of optimum working conditions of residential combustors with respect to optimum insulation. Energy Sources, Part A: Recovery, Utilization, and Environmental Effects, 36(23):2603-2612.
- Arslan, O. (2011). Power generation from medium temperature geothermal resources: ANN-based optimization of Kalina cycle system-34. Energy, 36(5):2528-2534.
- Borgonovi, S. M. et al. (2023). Effect of sprouting on biomolecular and antioxidant features of common buckwheat (Fagopyrum es-culentum). Foods, 12(10):2047.
- Boukelia, T. E., Arslan, O., & Mecibah, M. S. Ç. (2016). ANN-based optimization of a parabolic trough solar thermal power plant. Applied Thermal Engineering, 107:1210-1218.
- Campbell, C. G. (1997). Buckwheat: Fagopyrum esculentum Moench Bioversity International, v. 19. 73p.
- Daryanto, S., Wang, L., & Jacinthe, P. A. (2016). Global synthesis of drought effects on maize and wheat production. PLOS ONE, 11(5):e0156362.
- Duraktekin, G. et al. (2017). Different irrigation strategies effect on yield and wateruse efficiency of subsurface drip irrigated table grape variety of Yalova İncisi. Journal of Agricultural Faculty of Gaziosmanpasa University, 34:67-72.
- Eylen, M., Kanber, R., & Tok A. (1986). Çukurova koşullarında karık ve damla sulama yöntemleri ile sulanan çileğin verim ve su tüketimi Köy Hizmetleri Araştırma Enstitüsü Yayınları, 135(77):39.
- Farooq, M. et al. (2009). Plant drought stress: Effects, mechanisms and management. Agronomy for Sustainable Development, 29:185-212.
- Food and Agriculture Organization of the United Nations - FAO. (2017). The future of food and agriculture: Trends and challenges Rome, 180p.
- Ghobadi, M. et al. (2013). Antioxidant capacity, photosynthetic characteristics and water relations of sunflower (Helianthus annuus L.) cultivars in response to drought stress. Industrial Crops and Products, 50:29-38.
- Glaser, B. et al. (2001). The ‘terra preta’ phenomenon: A model for sustainable agriculture in the humid tropics. Naturwissenschaften, 88:37-41.
- Glaser, B., Lehmann, J., & Zech, W. (2002). Ameliorating physical and chemical properties of highly weathered soils in the tropics with charcoal-a review. Biology and Fertility of Soils, 35:219-230.
- Gümüş, İ., Negiş, H., & Şeker, C. (2022). Effects of barnyard manure biochar on some soil properties and yield of maize plant. Ziraat Mühendisliği, 374:24-33.
- Günal, E., & Erdem, H. (2018). Biochar; definition, utilization and effects on agricultural soil. Journal of Adnan Menderes University Agricultural Faculty, 15(2):87-93.
- Guo, Y. et al. (2023). Genetic dissection of protein and starch during wheat grain development using QTL mapping and GWAS. Frontiers in Plant Science, 14:1189887.
- Han, S. et al. (2023). Biochar application promotes crops yield through regulating root development and the community structure of root endophytic fungi in wheat-maize rotation. Soil and Tillage Research, 234:105827.
- Howell, T. A. (2001). Enhancing water use efficiency in irrigated agriculture. Agronomy Journal, 93(2):281-289.
- Jägermeyr, J. et al. (2021). Climate impacts on global agriculture emerge earlier in new generation of climate and crop models. Nature Food, 2(11):873-885.
- Jeffery, S. et al. (2017). Biochar boosts tropical but not temperate crop yields. Environmental Research Letters, 12(5):053001.
- Jeffery, S. et al. (2015). Quantitative review of the effects of biochar application to soils on crop productivity using meta-analysis. Agriculture, Ecosystems & Environment, 144(1):175-187.
- Karaer, M. et al. (2024). Artificial neural network modeling for ınvestigation on the effect of deficit ırrigation and nitrogen levels on yield and quality of hay remaining after seed harvest of sorghum sudangrass hybrid. Communications in Soil Science and Plant Analysis, 55(17):2565-2577.
- Karam, F. et al. (2007). Evapotranspiration, seed yield and water use efficiency of drip irrigated sunflower under full and deficit irrigation. Agricultural Water Management, 90(3):213-223.
- Kim, S. L., Kim, S. K., & Park, C. H. (2004). Introduction and nutritional evaluation of buckwheat sprouts as a new vegetable. Food Research International, 37(4):319-327.
- Laird, D. A. et al. (2010). Impact of biochar amendments on the quality of a typical Midwestern agricultural soil. Geoderma, 158(3-4):443-449.
- Lehmann, J., & Joseph, S. (2024). Biochar for environmental management: An introduction 3rd Edition. Science, Technology and Implementation, Taylor & Francis. 14p.
- Li, W. et al. (2024). Cereal dietary fiber regulates the quality of whole grain prod-ucts: Interaction between composition, modification and processing adaptability. International Journal of Biological Macromolecules, 274:133223.
- Li, Y. et al. (2022). Biochar incorporation increases winter wheat (Triticum aestivum L.) production with significantly improving soil enzyme activities at jointing stage. Catena, 211:105979.
- Lima, A. M. et al. (2024). Phosphorus adsorption after the incubation of clay soil with different doses of biochar. Ciência e Agrotecnologia, 48:e016724.
- Maina, N. H. et al. (2021). Process-Induced changes in the quantity and characteristics of grain dietary fiber. Foods, 10(11):2566.
- Major, J. et al. (2012). Biochar effects on nutrient leaching. In J. Lehmann., & S. Joseph. Biochar for environmental management Routledge. pp. 303-320.
- Marschner, H. (2011). Marschner’s mineral nutrition of higher plants. Academic press. Australia, 649p.
- Mertens, J., Luyssaert, S., & Verheyen, K. (2005). Use and abuse of trace metal concentrations in plant tissue for biomonitoring and phytoextraction. Environmental Pollution, 138(1):1-4.
- Podolska, G. et al. (2019). Abiotic stress affects the yield and nutrients of buckwheat grains. Zemdirbyste-Agriculture, 106(3):233-240.
- Schmidt, H. P. et al. (2021). Biochar in agriculture: A systematic review of 26 global meta analyses. GCB Bioenergy, 13(11):1708-1730.
- Tomotake, H. et al. (2002). Physicochemical and functional properties of buck-wheat protein product. Journal of Agricultural and Food Chemistry, 50(7):2125-2129.
- Tugcu, A., & Arslan, O. (2017). Optimization of geothermal energy aided absorption refrigeration system GAARS: A novel ANN-based approach. Geothermics, 65:210-221.
- Vaccari, F. P. et al. (2015). Biochar stimulates plant growth but not fruit yield of processing tomato in a fertile soil. Agriculture, Ecosystems & Environment, 207:163-170.
- Vijay, V. et al. (2021). Review of large-scale biochar field-trials for soil amendment and the observed influences on crop yield variations. Frontiers in Energy Research, 9:710766.
- Wang, C. et al. (2015). Effects of nitrogen fertilizer and planting den-sity on the lignin synthesis in the culm in relation to lodging resistance of buckwheat. Plant Production Science, 18(2):218-227.
- Watanabe, M. (1998). Catechins as antioxidants from buckwheat (Fagopyrum esculentum Moench) groats. Journal of Agricultural and Food Chemistry, 46(3):839-845.
- Xu, G. et al. (2014). Biochar had effects on phosphorus sorption and desorption in three soils with differing acidity. Ecological Engineering, 62:54-60.
- Yu, O. Y., Raichle, B., & Sink, S. (2013). Impact of biochar on the water holding capacity of loamy sand soil. International Journal of Energy and Environmental Engineering, 4:44.
- Zhang, P. et al. (2017). Effect of irrigation and nitrogen application on grain amino acid composition and protein quality in winter wheat. PLoS One, 12(6):e0178494.
- Zhang, W. et al. (2024). Proteins from legumes, cereals, and pseudo-cereals: Composition, modifica-tion, bioactivities, and applications. Foods, 13(13):1974.
- Zhang, Y. et al. (2019). In vitro hydrolysis and estimated glycemic index of jackfruit seed starch prepared by improved extrusion cooking technology. International Journal of Biological Macromolecules, 121:1109-1117.
- Zhou, M. et al. (2014). Cotton proteomics for deciphering the mechanism of environment stress response and fiber development. Journal of Proteomics, 105:74-84.
- Zwart, S. J., & Bastiaanssen, W. G. (2004). Review of measured crop water productivity values for irrigated wheat, rice, cotton and maize. Agricultural Water Management, 69(2):115-133.
-
Editor de seção:
Renato Paiva


