 Climate variability induced the impact of El-Niño Southern Oscillation events on rice-growing areas in the Mekong Delta region
ABSTRACT
The variation of rainfall features under the El-Niño-Southern Oscillation (ENSO) phenomenon, as part of the impacts of climate variability, enhances the potential risk of rice yield decline for rice cultivation regions around the world. The impact of ENSO events on rice cultivation regions in the Mekong Delta (MD) is examined. The study explores how ENSO affects rainfall patterns and subsequently influences rice yield in the region. Analysis of rainfall data from 12 stations between 1985 and 2022 reveals significant shifts in wet season timing due to ENSO events. La-Niña events lead to an average 22-days earlier onset of the wet season, while strong El-Niño events cause delays of up to 24 days. These changes directly impact rice yield, with La-Niña being associated with slight yield increases and El-Niño with substantial yield reductions. The study highlights the vulnerability of rice cultivation regions in the MD to ENSO-driven climate variability, emphasizing the need for proactive adaptation strategies to ensure food security.
Key words:
Oryza sativa; agricultural resilience; weather fluctuations; wet season; adaptation strategies
HIGHLIGHTS:
ENSO events significantly impact Mekong Delta’s rainy season.
La-Niña events correlate with an earlier rainy season onset while intense El-Niño events delay it.
Mekong Delta region’s rice production is sensitive to ENSO-driven rainfall variability.
RESUMO
A variação das características de precipitação sob o fenômeno El-Niño-Oscilação Sul (ENSO), como parte dos impactos da variabilidade climática, aumenta os potenciais riscos de declínio da produtividade nas áreas de cultivo de arroz ao redor do mundo. O impacto dos eventos ENSO em áreas de cultivo de arroz no Delta do Mekong (MD) foi examinado. O estudo explorou como o ENSO afeta os padrões de precipitação e, subsequentemente, influencia a produtividade do arroz na região. A análise de dados de precipitação de 12 estações entre 1985 e 2022 revela mudanças significativas no tempo da estação chuvosa devido aos eventos ENSO. Eventos La-Niña levam a um início médio de 22 dias antes da estação chuvosa, enquanto eventos fortes de El-Niño causam atrasos de até 24 dias. Essas mudanças impactam diretamente a produtividade do arroz, com La-Niña associado a ligeiros aumentos de produtividade e El-Niño com reduções substanciais. O estudo destaca a vulnerabilidade das áreas de cultivo de arroz no MD à variabilidade climática causada pelo ENSO, enfatizando a necessidade de estratégias proativas de adaptação para assegurar a segurança alimentar.
Palavras-chave:
Oryza sativa; resiliência agrícola; flutuações climáticas; estação chuvosa; estratégias de adaptação
Introduction
The Mekong Delta (MD) plays a crucial role in agriculture and sustains a population of over 17 million people, contributing more than half of Vietnam’s total rice output (Dinh & Dang, 2022; Nguyen et al., 2022). This agricultural production region is vital for both food security and Vietnam’s economy (Lee & Dang, 2020). However, the area faces significant challenges due to climate variability, particularly due to the El-Niño Southern Oscillation (ENSO) phenomenon and saltwater intrusion (Asadi et al., 2015). ENSO’s occurrence cycle, characterized by alternating warm and cool phases in the tropical Pacific Ocean, is influenced by global climate variability (Asadi et al., 2015; Limsakul et al., 2019). This recurring climate pattern impacts weather systems worldwide, including the Asian monsoon crucial for MD agriculture (Pham-Thanh et al., 2021). El-Niño events typically bring dry and hot weather conditions, while La-Niña events are associated with increased rainfall (Anderson et al., 2017).
The frequency and intensity of ENSO events have been on the rise (Oryza sativa) in Asia due to climate variability (Bereket et al., 2021), posing serious challenges to farmers in the MD (Lee & Dang, 2019). Extreme events linked to ENSO often disrupt agricultural activities (Lee & Dang, 2020), leading to crop damage and yield reductions (Asadi et al., 2015). The timing of the wet season’s onset, cessation, and duration are critical for agricultural activities like sowing, growth stages, and harvest schedules in the MD (Limsakul, 2019; Lee & Dang, 2020). Delayed onset or premature cessation of the wet season can result in decreased crop yields (Nguyen et al., 2022; Phung, 2024). Changes in rainfall during the rainy season can impact water availability for rain-fed agriculture, aquaculture, and other water-dependent sectors (Abbas & Mayo, 2020; Abby et al., 2022).
The rainy season in the MD is predominantly influenced by the Southwest monsoon, with rainfall steadily increasing from mid-May to a peak in October, accounting for the majority of the annual precipitation (Lee & Dang, 2019). Following this peak, rainfall sharply decreases by February, with the lowest amounts typically recorded in January and occasionally February. These climatic conditions create an optimal environment for agricultural activities, particularly rice cultivation, which thrives with multiple crop sowing seasons (Lee & Dang, 2019; Dang, 2021).
While previous studies have explored the relationship between ENSO and various aspects of regional climate, such as temperature (Abbas & Mayo, 2020), rainfall distribution (Bereket et al., 2021; Cherian et al., 2021), and global crop yields (Al-Amin et al., 2016), the specific impacts of ENSO on rainy season rainfall patterns in the MD remain underexplored in the existing literature. This study aims to bridge this gap in knowledge by analyzing extensive rainfall data from 12 observation stations across the MD. The research seeks to characterize the spatial and temporal variability of the rainy season, examining its connections with ENSO events and crop yields. By delving into this analysis, we aim to gain a deeper understanding of how ENSO influences rainfall patterns during the rainy season in the MD and its implications for agricultural productivity.
Material and Methods
Located in South Vietnam (Figure 1), the Mekong Delta is a significant delta region covering a vast area and playing a crucial role in national rice production (Lee & Dang, 2019). The study area spans from 8° 34’ to 11° 10’ N latitude and 104° 25’ to 106° 48’ E longitude, covering 40,577.6 km² and represts 12.8% of Vietnam’s total land area (Lee & Dang, 2019).

Map of the topographic elevation of Mekong Delta and the green circles represent rainfall observation stations
The MD is characterized by a humid tropical monsoon climate, exhibiting a high mean temperature of approximately 27.5 °C (Lee & Dang, 2020). Humidity of the air typically fluctuate around 82% and annual rainfall over 1,800 mm, contributing to the region’s lush vegetation, with more than 90% occurring during the wet season (Figure 2). In years when the El-Niño phenomenon occurs, the MD tends to experience higher-than-mean temperatures, while both humidity and rainfall levels drop below the long-term mean (Lee & Dang, 2020). Conversely, during La-Niña years, the weather conditions reverse, leading to cooler temperatures and increased precipitation, which can enhance agricultural yields (Phung, 2024). These climatic variations significantly impact the livelihoods of local communities, making it essential to understand their implications for agriculture and water management in the region (Lee & Dang, 2020; Phung, 2024).

Mean monthly rainfall distribution during the period 1985-2022 at observation stations across the Mekong Delta
With a population exceeding 17 million people, the MD is home to a large community heavily reliant on agriculture for livelihood and sustenance (Lee & Dang, 2020). The combination of geographical advantages and climatic conditions makes the MD a crucial agricultural hub within Vietnam (Kontgis et al., 2019).
Daily rainfall data series from 12 observation stations (Figure 1), representing the study area (Table 1), were collected for the years 1985 to 2022 from the National Center for Hydrometeorological Forecasting (NCHF). The selection of these observation stations was based on their geographical representation and the availability of long-term rainfall records. In addition to the rainfall data, crop yield data for the years 2009 to 2022 were obtained from the Department of Agriculture and Rural Development (DARD) of An Giang, Soc Trang, Long An and Ca Mau. This dataset provided valuable information on agricultural output and served as a crucial component for analyzing the relationship between the ENSO events with rainfall patterns and crop yield (Figure 3).

Illustration of the spatial distribution of mean annual rainfall (A) and rice cultivation regions (B) across the Mekong Delta (Nguyen et al., 2017)
To ensure the quality and reliability of the input data, a thorough assessment was conducted. The dataset underwent rigorous checks for data homogeneity, ensuring consistency and comparability across the entire time series. Furthermore, the percentage of missing data at any given station did not exceed 10% of the entire data series, as it was crucial to have a comprehensive and complete dataset.
Various studies have focused on determining the date of wet season onset (DWSO), length of the rainy season (LRS) and the date of wet season cessation (DWSC), utilizing different methodologies (Pham-Thanh et al., 2021). Given the intricate nature of monsoon circulations in the region, this study chooses to utilize the accumulated rainfall of five consecutive days (PEN- criterion) to define these key wet season parameters (Pham-Thanh et al., 2021).
The onset date is identified as the day when the 5-day moving mean of the rainfall index surpasses 5 mm per day and maintains this level for a continuous period of at least five days (Pham-Thanh et al., 2021). Additionally, within the following 20-day period, the number of days with rainfall exceeding 5 mm must be more than 10 days. This methodology underscores the significance of both the intensity and continuity of rainfall as crucial factors in determining the commencement of the wet season in the MD (Pham-Thanh et al., 2021).
The Mann-Kendall test is used to obtain a significant determinant of the change trend in the DWSO, DWSC and LRS of the long-term sequence can be regarded as a set of independent sample data. The test statistic (S) is defined as the sum of the integers as given in Eq. 1.
Where S is the number of positive differences minus the number of negative differences. If S is a positive number, observed rainfall data in time to be increased compared to observed data earlier. If S is a negative number, observed rainfall data in time to be decreased compared to observed data earlier. When the absolute value of S is small, no trend is recorded. Dj and Di are the annual rainfall data series.
The test statistic (τ) can be defined as Eq. 2.
Were τ in Eq. 2 has a range of -1 to +1. The null hypothesis of no trend is rejected when S and τ in Eq. 1 and Eq. 2 are significantly different from zero.
When the Mann-Kendall test is defined by Eq. 3.
With the variance of S is calculated by Eq. 4.
Where var(S) is adjusted by a tie correction method, m is the number of tied groups and tj is the number of observations rainfall data in the jth group.
Where sign(Dj - Di) in Eq. 1 is defined by Eq. 5.
Where Dj and Di are the annual rainfall data series; j and i have the condition of j >i.
In Eq. 5, the sign(Dj - Di) is a function symbol. For a given α, if |Z| ≥ Z1-α/2, there is a significant trend in the date of onset of wet season. In this paper, the confidence level α is taken as 0.05, and the corresponding |Z| is 1.96.
The standardized precipitation index (SPI) is widely utilized for predicting long-term drought patterns (Lee & Dang, 2020). It quantifies precipitation deficits or surpluses across various timescales, aiding in the early detection of meteorological drought events and assessing their severity, duration, and intensity (Lee & Dang, 2019). The SPI methodology involves fitting a probability distribution function (PDF), such as the Gamma or Pearson Type III distributions, to historical precipitation data (Nguyen et al., 2022). This PDF is then standardized to a normal distribution, allowing precipitation values to be expressed as standardized anomalies from the mean (Lee & Dang, 2020). By transforming the data in this manner, the SPI offers a consistent metric for comparing precipitation deviations across different regions and timeframes (Lee & Dang, 2020). The PDF representation is defined by Eq. 6 to facilitate the standardization process and enhance the comparability of precipitation anomalies.
Where, β and α in the Eq. 6 are the scale and shape parameters, x is the precipitation amount and Γ(α) is a Gamma function.
Whereby, the cumulative distribution function G(x) is defined through integrating the PDF as given in Eq. 7.
In the Eq. 7, the α, β parameters are defined through Eq. 8 and Eq. 9.
A parameter in Eq. 8 is calculated through Eq. 10.
Where x, x and n in the Eq. 10 are sample average value, sample value and number of observed precipitation samples.
Since the gamma function (G(x)) is undefined for x = 0 and a rainfall distribution can contain zeros, the cumulative probability (H(x)) can write as Eq. 11:
Where q in the Eq. 11 is the probability of a zero and the values of G(x) were obtained from the study issued by Lee and Dang (2019).
The SPI classification system establishes a standardized framework for interpreting index values (Table 2). Positive SPI values denote precipitation surpluses, categorizing areas as moderately wet, very wet, or extremely wet for SPI values between 1.0 and above 2.0 (Lee & Dang, 2020). Conversely, negative SPI values indicate precipitation deficits, classifying regions as moderately dry, severely dry, or extremely dry for SPI values from -1.0 to below -2.0 (Juliani et al., 2017). This classification system facilitates the monitoring of both wet and dry conditions, enabling early drought warning and effective water resource management (Lee & Dang, 2020).
Results and Discussion
The rainfall characteristics and trends in the MD, from 1985 to 2022, are summarized in Table 3. The mean annual rainfall (MAR) for the entire study area is estimated at around 1780 mm, showing variation with standard deviation (SD) and coefficient of variation (CV) across different provinces. It is highly differentiated, with standard deviations (SD: 260.7 ÷ 356.2) and coefficients of variation (CV: 0.90 ÷ 1.00) of MAR for coastal provinces and mainland provinces, such as An Giang and Dong Thap. The Vinh Long, Tra Vinh and Can Tho provinces are less volatile, with SD (190.9 ÷ 208.9) and CV ranging from 0.87 to 0.93.
Coastal provinces exhibit slightly decreasing trends in annual rainfall, (Zs: -0.20 ÷ -1.56), while inland provinces also show a similar pattern, with Zs ranging from -0.59 to -1.67. Conversely, some provinces like Bac Lieu, Tra Vinh, Ben Tre, Vinh Long, Tien Giang, and Dong Thap, present non-significant increasing trends in rainfall (Zs: 0.12 ÷ 1.03). This result is consistent with a study on the impacts of climate change induce meteorological drought increase in the coastal fringes of the MD by Nguyen et al. (2022). They reported that a significant downward trend in annual rainfall indicates a notable increase in drought conditions in the coastal provinces
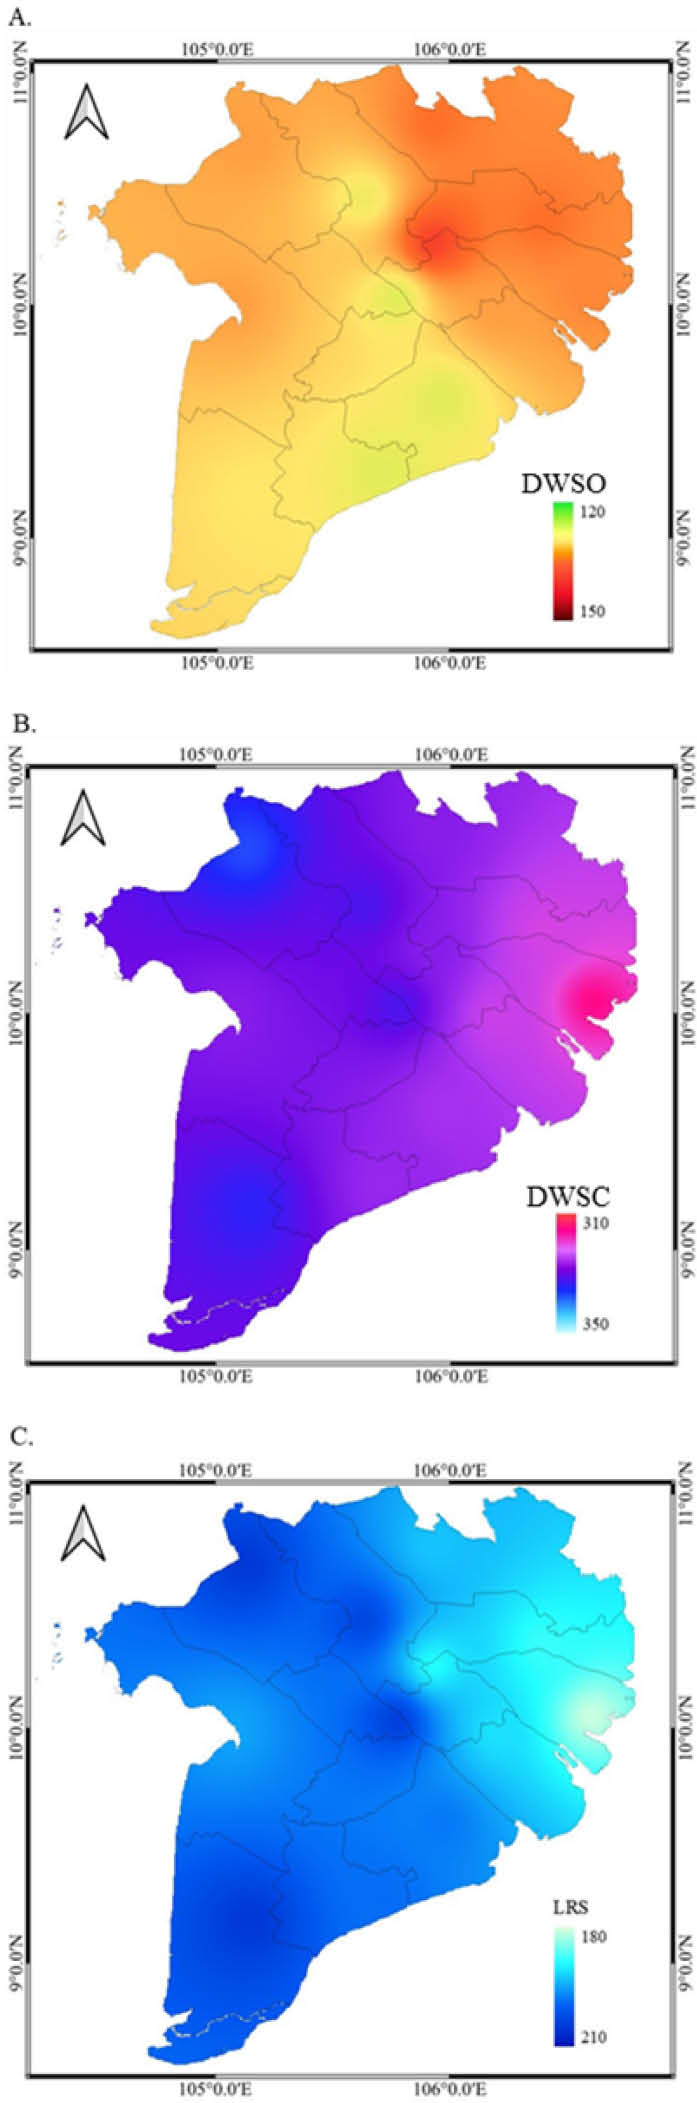
The analysis reveals the dates of the onset, length, and cessation of the wet season, with variations being observed among the different provinces (Figure 4A). The onset of the wet season ranges from late April to mid-May (April 27th and May 17th), with central (April 27th - May 8th) and southeastern coastal provinces (Ca Mau, Bac Lieu, Soc Trang, and Tra Vinh) experiencing early onsets (from May 4th to 7th), while eastern coastal (from May 11th to 17th) and western inland provinces have delayed onsets on May 4th. The cessation of the wet season occurs in November across the MD (Figure 4B), with differences in the LRS among various regions. Coastal southeastern provinces have a LRS ending in the third week of November, while western coastal and inland areas experience slightly shorter wet seasons. An Giang, Tien Giang, and Ben Tre are among the provinces with the earliest DWSC and the shortest LRS (Figure 4C). The results are quite similar to the study on changes of DWSO, LRS and DWSC under the impacts of climate variability conducted by Pham & Phan (2022). They reported that the DWSO and DWSC in the MD show a high degree of spatial similarity among the observation stations.

Simulation results of the date of the wet season onset (A), date of the wet season cessation (B) and lenght of wet season (C) during the period 1985-2022
The analysis aimed to explore the impact of ENSO events on the temporal patterns of rainfall characteristics in four representative sub-regions (northeast, northwest, southeast and southwest) in the MD, as illustrated in Figures (4A, B and C). By examining data from 1985 to 2022 presented in Table 4, the study investigated the correlation between ENSO events, identified through SPI12, and rainfall attributes like DWSO, DWSC, and LRS across the MD. Years characterized by exceptionally wet conditions, indicated by high positive SPI12 values, tended to have earlier rainy season onsets compared to drier years. For instance, in 1999, all stations experienced an extremely wet year with SPI12 values exceeding 1.6 (Figures 5A, B, A, and D), corresponding to a remarkably early wet season onset, ranging from 89 at Chau Doc to 114 at Moc Hoa.

Simulation results of ENSO events during the period 1985-2022 at northwest sub-region (A), southeast sub-region (B), northeast sub-region (C), and southwest sub-region (D) in the Mekong Delta
Conversely, extremely dry years, marked by strongly negative SPI12 values, often experienced delayed DWSO (Table 4). This is evident in the period 2014-2016, almost all stations recorded an extreme dry year, with SPI12 values of around -2.0 (Figures 5A, B, C, D), the DWSO was significantly delayed, ranging from 164 at Moc Hoa to 168 at Chau Doc. While certain patterns were observed, such as slightly shorter wet seasons in extremely wet years, the relationships between SPI12 and DWSO, DWSC, and LRS were not consistently clear. This implies that factors beyond ENSO events may play a more significant role in determining the wet season dynamics in the MD, necessitating further exploration into variables such as intra-seasonal rainfall variability and changes in evapotranspiration rates.
The analysis of relationship between ENSO events, as indicated by SPI12 and rainfall features with rice yield across representative stations in the MD in the stage of 2009-2022 are presented in Table 4. It is possible to discern several noteworthy trends. Firstly, across all stations, years with negative SPI12 values (indicating drier weather conditions), were generally associated with reduced rice yields. For instance, 2016 was, characterized by a strong El-Niño event and negative SPI12 values (-1.16, -1.87, -2.07 and, -0.86) across all stations; there were significantly lower rice yields (2.95, 3.94, 24.3, and 13.2%) compared to the mean values between 2009-2022. This negative correlation between SPI12 and crop yield underscores the vulnerability of rice yield to drought stress in the MD. A study on the impacts of climate variability on rice paddies in the Plain of Reeds by Phung (2024) reported that rice yield exhibits substantial changes during typical ENSO phases.
While SPI12 provides a valuable indicator of overall water availability, its relationship with rice yield is not always straightforward. For instance, in 2011, despite a moderate La-Niña event and positive SPI12 values at most stations (1.58, 2.34, 2.07 and, 0.67), rice yields were below mean values (1.44, 11.20, 11.10, and 8.47%). This implies that other factors, such as the timing and intensity of rainfall within the wet season, pest outbreaks, or cultivation practices, can also significantly influence rice yield. These findings highlight the complex interplay of factors influencing rice yield in the MD. While drought, as indicated by SPI12, plays a crucial role, its impact on crop yield is mediated by spatial variations in wet season characteristics and other local factors (Phung, 2024).
The analysis primarily examined the impact of rainfall variability on rice yield, it is essential to acknowledge that factors such as climate, soil characteristics, pests, diseases, and agricultural practices can also exert significant influences on rice yield. Relying on historical data for correlation establishment has its limitations.
Conclusions
-
La-Niña events correlate with an earlier wet season onset, while intense El-Niño events delay it, directly impacting rice cultivation cycles.
-
La-Niña phases are associated with increased rice yields while severe El-Niño phases are associated with substantial reductions.
-
The El-Niño-Southern Oscillation phenomenon exerts a significant influence on the characteristics of the rainy season throughout the study area.
Acknowledgements
The authors would like to sincerely thank the reviewers as well as the editorial board for reviewing and providing feedback to help improve the manuscript.
Literature Cited
-
Abbas, S.; Mayo, Z. A. Impact of temperature and rainfall on rice production in Punjab, Pakistan. Environment, Development and Sustainability, v.23, p.1706-1728, 2020. https://doi.org/10.1007/s10668-020-00647-8
» https://doi.org/10.1007/s10668-020-00647-8 -
Abby, G. F.; Bui, T. Y.; Malte, F. S.; Katherine, M. N.; Bjoern, O. S.; Michael, B.; Kantar, D. R. W. Impact of historical climate variability on rice production in Mainland Southeast Asia across multiple scales. Anthropocene, v.40, e100353, 2022. https://doi.org/10.1016/j.ancene.2022.100353
» https://doi.org/10.1016/j.ancene.2022.100353 -
Al-Amin, A. Q.; Alam, G. M. Impact of El-Niño on agro-economics in Malaysia and the surrounding regions: An analysis of the events from 1997-98. Journal of Asian Earth Sciences, v.9, p.1-8, 2016. https://scialert.net/abstract/?doi=ajes.2016.1.8
» https://scialert.net/abstract/?doi=ajes.2016.1.8 -
Anderson, W.; Seager, R.; Baethgen, W.; Cane, M. Crop production variability in North and South America forced by life-cycles of the El Niño Southern Oscillation. Agricultural and Forest Meteorology, v.239, p.151-165, 2017. https://doi.org/10.1016/j.agrformet.2017.03.008
» https://doi.org/10.1016/j.agrformet.2017.03.008 -
Asadi, Z. M. A.; Sivakumar, B.; Sharma, A. Droughts in a warming climate: a global assessment of SPI and RDI. Journal of Hydrology, v.526, p.183-195, 2017. https://doi.org/10.1016/j.jhydrol.2014.09.071
» https://doi.org/10.1016/j.jhydrol.2014.09.071 -
Bereket, T. H.; Tadesse, T. Z.; Kassahun, T. B.; Desalegn, Y. A.; Gudina, L. F. Analysis of El Niño Southern Oscillation and its impact on rainfall distribution and productivity of selected cereal crops in Kembata Alaba Tembaro zone. Climate Services, v.23, e100254, 2021. https://doi.org/10.1016/j.cliser.2021.100254
» https://doi.org/10.1016/j.cliser.2021.100254 -
Cherian, S.; Sridhara, S.; Manoj, K. N.; Gopakkali, P.; Ramesh, N.; Alrajhi, A. A.; Dewidar, A. Z.; Mattar, M. A. Impact of El-Niño Southern Oscillation on rainfall and rice production: A micro-level analysis. Agronomy, v.11, e1021, 2021. https://doi.org/10.3390/agronomy11061021
» https://doi.org/10.3390/agronomy11061021 -
Dang, T. A. Grain yield optimization in the Plain of Reeds in the context of climate variability. Revista Brasileira de Engenharia Agrícola e Ambiental, v.25, p.591-596, 2021. https://doi.org/10.1590/1807-1929/agriambi.v25n9p591-596
» https://doi.org/10.1590/1807-1929/agriambi.v25n9p591-596 -
Dinh, T. K. H.; Dang, T. A. Potential risks of climate variability on rice cultivation regions in the Mekong Delta, Vietnam. Revista Brasileira de Engenharia Agrícola e Ambiental , v.26, p.348-355, 2021. https://doi.org/10.1590/1807-1929/agriambi.v26n5p348-355
» https://doi.org/10.1590/1807-1929/agriambi.v26n5p348-355 -
Juliani, B. H. T.; Okawa, C. M. P. Application of a Standardized Precipitation Index for meteorological drought analysis of the semi-arid climate influence in Minas Gerais, Brazil. Hydrology, v.4, e26, 2017. https://doi.org/10.3390/hydrology4020026
» https://doi.org/10.3390/hydrology4020026 -
Kontgis, C.; Schneider, A.; Ozdogan, M.; Kucharik, C.; Pham, V. D. T.; Nguyen, H. D.; Schatz, Z. Climate change impacts rice productivity in the Mekong River Delta. Applied Geography, v.102, p.71-83, 2019. https://doi.org/10.1016/j.apgeog.2018.12.004
» https://doi.org/10.1016/j.apgeog.2018.12.004 -
Lee, S. K.; Dang, T. A. Extreme rainfall trends over the Mekong Delta under the impacts of climate change. International Journal of Climate Change Strategies and Management. v.12, p.639-652, 2020. https://doi.org/10.1108/IJCCSM-04-2020-0032
» https://doi.org/10.1108/IJCCSM-04-2020-0032 -
Lee, S. K.; Dang, T. A. Spatio-temporal variations in meteorology drought over the Mekong River Delta of Vietnam in the recent decades. Paddy and Water Environment, v.17, p.35-44, 2019. https://doi.org/10.1007/s10333-018-0681-8
» https://doi.org/10.1007/s10333-018-0681-8 -
Limsakul, A. Impacts of El Niño-Southern Oscillation (ENSO) on rice production in Thailand during 1961-2016. Environment and Natural Resources Journal, v.17, p.30-42, 2019.https://ph02.tci-thaijo.org/index.php/ennrj/article/view/194376
» https://ph02.tci-thaijo.org/index.php/ennrj/article/view/194376 -
Nguyen, D. B.; Clauss, K.; Cao, S.; Naeimi, V.; Kuenzer, C.; Wagner, W. Mapping rice seasonality in the Mekong Delta with multi-year Envisat ASAR WSM data. Remote Sensing. v.7, p.15868-15893, 2017. https://doi.org/10.3390/rs71215808
» https://doi.org/10.3390/rs71215808 -
Nguyen, T. T. T.; Hoang, P. H. Y.; Dang, T. A. Climate variability induced drought across the coastal fringes of the Mekong Delta, Vietnam. MAUSAM. v.73, p.525-536, 2022. https://doi.org/10.54302/mausam.v73i3.5373
» https://doi.org/10.54302/mausam.v73i3.5373 -
Pham-Thanh, H.; Phan-Van, T.; Fink, A. H.; Van der Linden, R. Local-scale rainy season onset detection: A new approach based on principal component analysis and its application to Vietnam. International Journal of Climatology. v.42, p.3726-3742, 2021. https://doi.org/10.1002/joc.7441
» https://doi.org/10.1002/joc.7441 -
Pham, T. H.; Phan, V. T. Objective criteria to determine the rainy season onset date for the central highlands and southern Vietnam. VNU Journal of Science: Earth and Environmental Sciences, v.38, p.85-94, 2022. https://doi.org/10.25073/2588-1094/vnuees.4772
» https://doi.org/10.25073/2588-1094/vnuees.4772 -
Phung, T. D. Climate change impacts on rice cultivation paddies in the Plain of Reeds, Vietnam. Research on Crops. v.25, p.247-252, 2024. https://doi.org/10.31830/2348-7542.2024.ROC-1086
» https://doi.org/10.31830/2348-7542.2024.ROC-1086
No additional data from the inquiry.