
 Physiological maturity of Crateva tapia seeds
ABSTRACT
Species like Crateva tapia, valued for its ecological and nutritional importance, with discontinuous flowering and fruiting, make it challenging to anticipate the harvest time of fruits and determine the physiological maturity of seeds due to the variety of maturation stages on a single plant. Thus, the objective in this study was to determine the physiological maturity of C. tapia seeds. A completely randomized design was used, in a split plot scheme with four replicates. In the plots was evaluated the production cycles 2020-2021 (cycle I) and 2021-2022 (cycle II), and in the split plot was evaluated the maturation stages: 25, 40, 55, 70, 85, 100, 115, 130, 145, 160, and 175 days after anthesis. The evaluated characteristics included the physical (fruit and seeds) and physiological (seeds) traits throughout their development. As the fruits matured, their color changed from deep green to yellow, while the seeds transitioned from pink to dark brown. The seeds reached maximum germination capacity and vigor at 153 and 126 days in cycle I, respectively, and at 149 and 136 days after anthesis in cycle II, respectively. C. tapia seeds reach physiological maturity between 142 and 150 days after anthesis. Morphological aspects of the fruits, such as green coloration with small yellow traces, indicate the physiological maturation of the seeds. The development of C. tapia seeds involves morphological and physiological changes that affect their quality and germination capacity. Climatic conditions (temperature and precipitation) during seed formation influence the germination process and vigor.
Key words:
trapiá; native species; physiological quality; vigor
HIGHLIGHTS:
The coloration of the fruits is an indicator of the physiological maturity of the seeds.
The length and width of Crateva tapia seeds decrease due to low precipitation.
C. tapia seeds exhibit germination capacity starting at 100 days after anthesis.
RESUMO
Espécies como a Crateva tapia, valorizadas por sua importância ecólogica e nutricional, apresentam floração e frutificação descontínuas, tornando difícil antecipar o momento da colheita dos frutos e determinar a maturidade fisiológica das sementes devido à diversidade de estádios de maturação em uma mesma planta. Assim, objetivou-se com este estudo determinar a maturidade fisiológica das sementes de C. tapia. O experimento foi conduzido em delineamento inteiramente ao acaso, em esquema fatorial de parcelas subdividas com quatro repetições. Nas parcelas foram avaliados os diferentes ciclos de produção: 2020-2021 (ciclo I) e 2021-2022 (ciclo II), e nas subparcelas, os diferentes estádios de maturação das sementes: 25, 40, 55, 70, 85, 100, 115, 130, 145, 160 e 175 dias após a antese. As características avaliadas foram físicas (frutos e sementes) e fisiológicas (sementes) ao longo do seu desenvolvimento. À medida que os frutos amadureceram percebeu-se uma alteração na coloração destes do verde intenso para amarelo, enquanto as sementes passam da coloração rosa ao marrom escuro. As sementes atingiram máxima capacidade germinativa e vigor aos 153 e 126 dias no ciclo I, respectivamente, e no ciclo II 149 e 136 dias após a antese, respectivamente. As sementes de C. tapia atingem a maturidade fisiológica entre os 142 aos 150 dias após a antese. Aspectos morfológicos dos frutos, como coloração verde e pequenos traços amarelos são indicativos de maturação fisiológica das sementes. O desenvolvimento das sementes de C. tapia envolve mudanças morfológicas e fisiológicas que afetam sua qualidade e capacidade de germinação. As condições climáticas (temperatura e precipitação) durante a formação das sementes de C. tapia interferem no processo germinativo e vigor.
Palavras-chave:
trapiá; espécie nativa; qualidade fisiológica; vigor
Introduction
The search for sustainable strategies for biodiversity conservation and the restoration of degraded ecosystems has driven a growing interest in understanding and utilizing plant species adapted to adverse environments. This interest has intensified during the UN-declared Decade on Ecosystem Restoration (2021-2030) (WRI Brasil, 2022). In this context Crateva tapia L. stands out as a prominent species due to its potential for the recovery of degraded areas and its frequent use in landscaping and ornamental arborization (Lorenzi, 2009). Beyond its ecological applications, C. tapia holds economic and social significance, being used by local communities for medicinal and ornamental purposes, thereby contributing to the local economy and the well-being of these communities.
This species is native to Brazil and is found in various regions, including the North, Northeast, Central-West, and Southeast (Soares Neto & Luber, 2023). In the state of Paraíba, its occurrence has been recorded specifically in the Agreste and Atlantic Forest mesoregions (Silva et al., 2022). Its unique characteristics make it an appealing choice for diverse applications: its bark has anti-inflammatory, analgesic, and antitumor properties (Araújo et al., 2011), its leaves are used in ethnopharmacology (Arruda et al., 2021), and its striking flowering and growth architecture make it highly valued for landscaping purposes (Lorenzi, 2009), enhancing the beauty of both urban and rural landscapes.
Despite the remarkable characteristics of C. tapia, including its importance in environmental conservation and its diverse applications, a comprehensive understanding of its seed maturation is essential for optimizing its use. Seed maturation is a critical process for plant survival, directly influencing reproduction and dispersal (Ali et al., 2022).
However, the irregular maturation of C. tapia represents a significant challenge, as the complexity of discontinuous flowering and fruiting makes it impossible to predict the ideal time to harvest the fruit and determine the physiological maturity of the seeds on the same plant (Justino et al., 2015). Premature harvesting results in poorly formed seeds with low vigor and limited storage capacity. On the other hand, after reaching physiological maturity, leaving seeds in the fruits under field conditions compromises their quality due to intense respiration and high moisture levels (Shaheb et al., 2015).
The lack of precise information on the fruit and seed maturation processes of this species limits not only its production and utilization but also hinders conservation efforts. Therefore, it is essential to invest in studies dedicated to understanding C. tapia seed maturation to identify when seeds reach physiological maturity, marked by peak germination and vigor. Such research will enable the development of effective management and conservation strategies, as well as unlock the species’ potential for future applications.
It is hypothesized that the physiological maturity of C. tapia seeds is influenced by specific maturation stages, marked by the peak of germination, vigor, and dry mass accumulation, which can be identified through systematic evaluation of their physical and physiological characteristics. In light of this, it is essential to investigate the factors affecting the production of C. tapia seeds with high physiological quality and to assess the physiological changes associated with their development. Therefore, the objetive in this research consist to determine the physiological maturity of C. tapia seeds.
Material and Methods
The parent trees were selected in the municipalities of Remígio and Esperança cities, located in the Semi-arid region of Paraíba state (Figure 1). The selection of the five parent trees considered phytosanitary characteristics and regular fruit production.

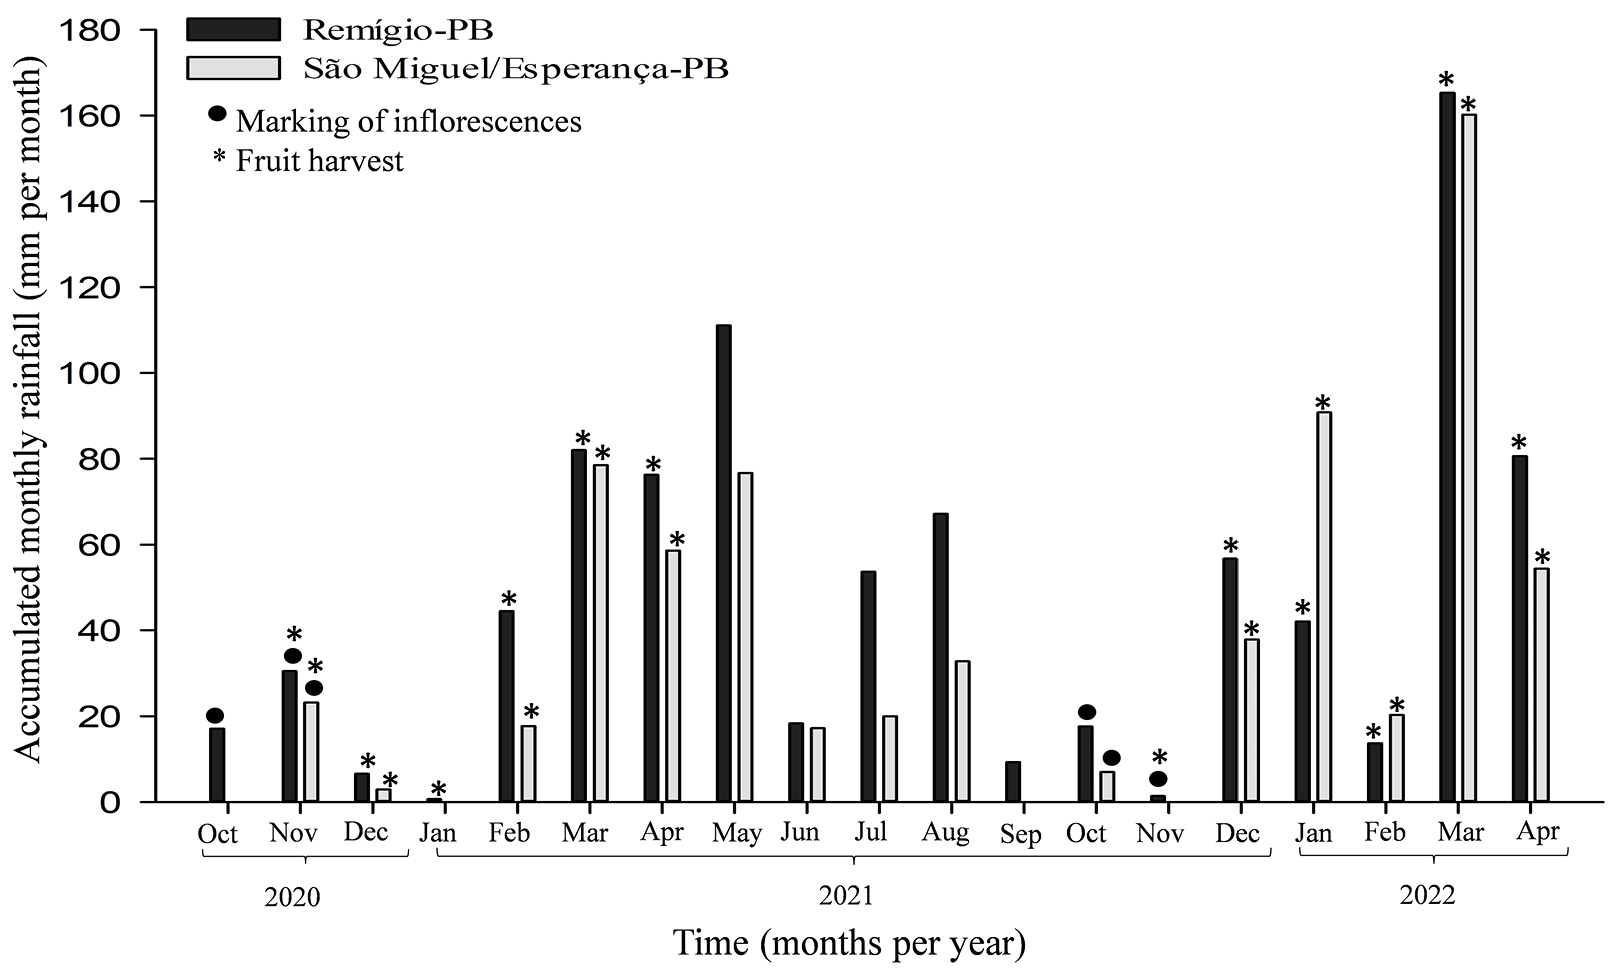
The municipalities are characterized by a As climate type, which is hot and dry, with an average annual precipitation of 700 to 900 mm, a temperature of 26.1 °C, and an average evapotranspiration of 1,000 to 1,100 mm (Alvares et al., 2014; Souza et al., 2018). During the experiment, it was observed that the rainy season in 2021 in the rural área for the municipalities of Remígio (Lagoa do Mato) and Esperança (São Miguel) was concentrated between March and May, with annual averages of 538.8 and 346.4 mm, respectively (Figure 2).

Accumulated monthly rainfall from October 2020 to April 2021 in the municipalities of Remígio and Esperança (São Miguel), PB, Brazil (AESA, 2022)
A completely randomized design was used, in a split plot scheme, with four replicates. In the plots was evaluated the production cycle 2020-2021 (cycle I) and 2021-2022 (cycle II), respectively, and maturation stages: 25, 40, 55, 70, 85, 100, 115, 130, 145, 160 e 175 days after anthesis.
During the 2020-2021 and 2021-2022 cycles, at the flowering stage (50% of flowers at anthesis), inflorescences were tagged daily with different colors of wool thread to mark each maturation stage. Fruits were harvested manually with pruning shears at predetermined intervals (25, 40, 55, 70, 85, 100, 115, 130, 145, 160, and 175 days after anthesis - DAA) placed in transparent polyethylene bags and packed in Styrofoam boxes with ice and taken to the Laboratory of Seed Analysis (LAS) at Universidade Federal da Paraíba, in Areia city, Paraíba state, Brazil, with analyzes carried out immediately after each harvest.
For processing, the fruits were opened with knives, and the seeds were manually extracted with scalpels, rinsed in running water for 2 min, and dried on paper towels for 24 hours. Before testing, the seeds were disinfected with a 2% sodium hypochlorite solution for 5 min and treated with Captan (240 g 100 kg-1 of seeds), manually shaken in a plastic bag for uniform application. After processing the fruits and seeds, the following variables were determined:
Coloration of the epicarp, mesocarp, and seed: was determined using the L*, a*, b* system through reflectometry with a Konica Minolta Chroma Meter CR-400 (Ferreira & Spricigo, 2017). A modification was made using a standard white plate, and readings were taken at the equatorial region of the fruits. Luminosity (L*) ranges from black (0) to white (100); the coordinate a* value ranges from green (-60) to red (+60), and coordinate b* from blue (-60) to yellow (+60). The chroma index (C*) was calculated as √(a² + b²), and the hue angle (°h) was determined using the formula arctan(a*/b*), yielding specific values for colors (red, yellow, green, and blue).
Fresh mass (fruit and seed): four replicates of 25 fruits and four replicates of 25 seeds were weighed on an analytical scale (Mittler toledo) with a precision of 0.001 g. Results were expressed in grams.
Length and diameter of frutis: measured using a digital caliper (Mitutoyo Sul Americana)
with an accuracy of 0.01 mm. The length was measured from the apex to the base, and the diameter was measured in the median region of the fruits. The results were recorded in millimeter.
Moisture content and dry mass (fruits and seeds): determined by the oven-drying method (BRASIL, 2009), with four replicates of five fruits and four replicates of 25 seeds at 105 ± 3 °C for 24 hours, with results expressed as a percentage. Simultaneously with moisture determination, fruit dry mass was assessed using the final average weight of four subsamples of five fruits each, while seed dry mass was measured with four subsamples of 25 seeds each.
Number of seeds per fruit: four replicates of 25 fruits each were used. After manually removing the pulp from the seeds, the number of seeds per fruit was counted.
Length, width, and thickness (seed): measured with a digital caliper (Mitutoyo Sul Amereicana) with 0.01 mm precision. Measurements were taken along the longest axis, the median line of the widest side, and the median line of the narrowest side, with results expressed in millimeter.
Thousand-seed weight: determined by randomly counting eight replicates of 100 seeds, which were weighed using an analytical balance (Mittler toledo) with a precision of 0.001 g, with values expressed in grams, following the RAS guidelines (BRASIL, 2009).
Germination test: the test was conducted in a BOD germinator (Eletrolab®) with a photoperiod of 8 and16 hours of light and dark, respectively, using daylight-type fluorescent lamps (4 × 20 W) (BRASIL, 2009), set at an alternating temperature of 20-30 °C, following the recommendations of Alves et al. (2012). For each treatment, 100 seeds were used, divided into four replicates of 25 seeds, and placed on two sheets of germination paper (Germitest type). They were then covered with a third sheet and rolled, with the paper moistened with distilled water in an amount equivalent to three times its dry weight. To reduce water loss from evaporation, the rolls were placed in plastic bags, and counts were made daily from 15 to 30 per days after test setup, as the number of germinated seeds stabilized. The criterion used was the presence of normal seedlings (primary root and hypocotyl), and results were expressed as the average percentage of normal seedlings.
Emergence test: seeds were sown at a depth of 2 cm in plastic trays with a 7-L capacity (44 cm × 28 cm × 7 cm), filled with medium-grain sand (particle diameters between 0.42 and 2.0 mm) sterilized in an autoclave. Four replicates of 25 seeds were used. The trays were kept in a greenhouse where the average temperature was 32 °C and relative air humidity was 60%, measured with a thermohygrometer (Incoterm). The substrate moisture was maintained by manual irrigation once a day with a watering can. The number of emerged seedlings was counted daily, starting on the 15th day and continuing until the 30th day after sowing, with results expressed as the average percentage of normal seedlings. First germination and emergence counts: conducted alongside the germination and emergence tests, with evaluation on the 15th day after sowing, and results expressed as a percentage.
Germination and emergence speed indices: this was also conducted alongside the germination test in the BOD and the emergence test in the greenhouse, with daily counts of normal seedlings over 30 per days at the same time each day, starting from the first count. The index was calculated using the formula proposed by Maguire (1962).
Mean germination and emergence times: conducted simultaneously with the germination and emergence tests. For the calculation, the number of normal seedlings counted between each interval (ni) and the time elapsed from the start of germination and emergence to the 30th count (ti) were used, as proposed by Labouriau (1983): MGT/E = Σ(ni*ti)/Σni, where MGT/E is the mean germination or emergence time, ni is the number of seeds germinated or emerged per day, and ti is the incubation time. Results were expressed in days.
Mean germination and emergence rate: calculated using the formula MGR/E = 1/t, where t represents the mean germination or emergence time. Results were expressed in days (Santana & Ranal, 2004).
Seedling length in germination and emergence tests (shoot, root system, and total): at the end of the germination and emergence tests, seedlings were measured using a ruler graduated in centimeters. The shoot length was measured from the root collar to the apex, while the primary root was measured from the base of its collar to its tip. Total seedling length was determined by summing the shoot and root measurements, with data expressed in centimeter per seedling.
Seedling dry mass in germination and emergence tests (shoot, root, and total): for both tests, seedlings were separated into shoots and roots, placed in kraft paper bags, separated by replicate, labeled, and dried in an oven set at 65 °C for 48 hours. After this period, samples were weighed on an analytical scale (0.001 g). Total dry mass was determined by summing the dry mass of the shoot and root system, with results expressed in grams per seedling.
The relative importance of the characteristics was evaluated using the method of Singh (1981), with data divided into three groups: Group I included variables of luminosity, chromaticity, and hue angle of the mesocarp and seeds, seed moisture content, and dry mass (from 40 to 175 DAA); Group II comprised variables of moisture content, length, diameter, fresh and dry mass of fruits, luminosity, chromaticity, and hue angle of the epicarp, number of seeds per fruit, thousand-seed weight, seed length, width, thickness, and fresh mass (from 25 to 175 DAA); Group III consisted of the percentage of germination and emergence, first germination count, germination and emergence speed index, length, and dry mass of shoot, root, and total seedlings from the germination and emergence tests (from 100 to 175 DAA). Variables that neither compromised the tests nor the study’s feasibility and that contributed less than 1% in Groups I and II and less than 0.3% in Group III were excluded from the results.
Following Singh’s test analysis, the data were subjected to variance analysis using Fisher’s test (p ≤ 0.05). When a significant interaction was identified, subsequent analyses included polynomial regression and Tukey’s test at p ≤ 0.05 were applied. All analyses were conducted using R software version 4.0 (R Core Team, 2018). Canonical correlations were performed between two climatic variables - temperature and precipitation - from Group I, and Group II comprised the other variables analyzed. These correlations were carried out using the methodology of Cruz & Carneiro (2003), using the Genes software (Cruz, 2013).
Results and Discussion
According to Singh’s method, the variables that contributed minimally or not at all to variability in Group I were chromaticity of the epicarp, mesocarp, and seed (Figure 3A). In Group II, these variables included fruit length, seed count per fruit, seed thickness, and thousand-seed weight (Figure 3B). In Group III, the variables were first germination count, germination rate, mean germination speed, total seedling length in the germination test, seedling dry mass in the germination test, first emergence count, emergence rate, emergence speed index, and seedling length and dry mass in the emergence test (Figure 3C). These results indicate that these variables have a limited impact on distinguishing between groups, potentially being considered redundant or less relevant in future analyses, allowing the focus to be directed toward more informative characteristics (Cruz et al., 2011).

Estimates of the relative contribution of each variable using Singh’s method (1981), based on the proportion of the total Mahalanobis generalized distance (D2), for 8 (A), 14 (B), and 22 (C) variables related to different maturation stages and production cycles of Crateva tapia
Although the germination percentage did not exceed the 0.3% contribution threshold in Singh’s analysis, it was retained in the results because it is an essential variable for determining the physiological maturity of the seeds (Carvalho & Nakagawaa, 2012; Oliveira & Silva, 2024). Variables were excluded based on Singh’s analysis as they were less relevant compared to others. Therefore, in future experiments on C. tapia seed maturation under similar conditions and using the same parent trees, these variables may be omitted. Between the different maturation stages and the production cycles, there was a significant interaction for all the variables analyzed, with the exception of the dry mass of the fruit, seed length and dry mass of the aerial part in the emergence test, with the significant effect observed only in the maturation stage factor (Table 1).
Summary of the variance analysis corresponding to the variables Fruit fresh mass (FFM); fruit length (FL); fruit diameter (FD); epicarp luminosity (EL); epicarp chromaticity (EC); epicarp hue angle (EH); fruit moisture content (FMC); fruit dry mass (FDM), seed length (SL), seed width (SW), seed thickness (ST), mesocarp luminosity (ML) and seed luminosity (SL); mesocarp chromaticity and seed chromaticity (MC; SC); mesocarp hue angle (HM) and seed hue angle (HS); seed moisture content (SNC); seed dry mass (SDM) and seed fresh mass (SFM), first germination count (FGC), germination percentage (GP); germination speed index (GSI); mean germination time (MGT); mean germination rate (MGR); seedling shoot length (SSL), root system length (RSL), and total length (TL) in the germination test; seedling shoot dry mass (SSDM), root system dry mass (RSDM), and total dry mass (TDM) in the germination test; first emergence count (FEC), emergence percentage (EP); emergence speed index (ESI); mean emergence time (MET); mean emergence rate (MER); seedling shoot length (SSL), root system length (RSL), and total length (TL) in the emergence test; seedling shoot dry mass (SSDM), root system dry mass (RSDL), and total dry mass (TDM) in the emergence test. length of the seedling aerial part (CPAE), root system (CSRE) and total (CTE) of the emergency test; dry mass of the aerial part (MSPAE), root system (MSSRE) and total (MSTE) of the emergency test of Crateva tapia L. to different maturation stages and production cycles
The epicarp luminosity data of C. tapia fit a quadratic model, reaching maximum values of 36.84 and 24.84 at 49 DAA for cycles I (2020-2021) and II (2021-2022), respectively, in which cycle I presented fruits with greater luminosity than cycle II regardless of the maturation stage evaluated (Figure 4A). The luminosity trend for the mesocarp also fit a quadratic model based on fruit development, with maximum values of 60.7 and 52.7 at 40 and 46 DAA, respectively, for cycles I and II, later decreasing to 21.37 and 15.04, respectively, when harvested at 175 DAA in both cycles, there being no statistical difference between the cycles at this stage of maturation (Figure 4B). Seed luminosity (SL) showed a linear decreasing trend, indicating a reduction as the seed developed, varying from 43.41 (Cycle I) and 35.63 (Cycle II) at 40 DAA to 16.84 (Cycle I) and 17.05 (Cycle II) when harvested at 175 DAA, in which cycle I provided seeds with more shine than those harvested in cycle II up to 130 DAA, after which there was no difference between the cycles (Figure 4C).

Epicarp luminosity (A), mesocarp luminosity (B), seed luminosity (C), Hue angle of the epicarp (D), Hue angle of mesocarp (E), Hue angle of seed (F), fresh mass (G), length (H), moisture content (I), and dry mass (J) of Crateva tapia fruits as a function of different maturation stages across two production cycles
The results indicate that C. tapia epicarp luminosity varies throughout development, attributed to changes in the fruit’s chemical composition. Fruits in early growth stages have a shinier surface, which is associated with immaturity. As they mature, biochemical transformations occur, such as chlorophyll degradation and the synthesis of compounds like carotenoids, which can reduce luminosity and give the epicarp a darker appearance (Kapoor et al., 2022). This observation is supported by the data in Figure 4, showing a clear trend of decreasing luminosity as fruits mature.
The difference observed between production cycles is associated with climatic conditions, such as light intensity and temperature, which can alter the rate of chlorophyll degradation and carotenoid synthesis (Muhammad et al., 2023). These variations directly influence the appearance of the fruits, resulting in changes in the color and luminosity of the epicarp throughout its development.
Analyzing the epicarp’s hue angle revealed a quadratic trend in Cycle I, with values decreasing during fruit development and reaching a minimum of 71° at 162 DAA. In Cycle II, however, the data did not conform to a regression model, averaging 71.69° (Figure 4D). For the hue angle of the mesocarp (HM) and seed (CS), a quadratic trend was also observed-with estimated maximum values of 64.42° at 80 DAA in Cycle I and 65.13° at 140 DAA in Cycle II, and estimated minimum values of 37.57° at 99 DAA in Cycle I and 40.12° at 83 DAA in Cycle II. Notably, Cycle I exhibited statistically higher hue angle values for the mesocarp and seeds up to 100 DAA compared to Cycle II; however, after this stage, Cycle II showed an increase in the hue angle of these structures, surpassing Cycle I up to 175 DAA, as shown in Figures 4E and F.
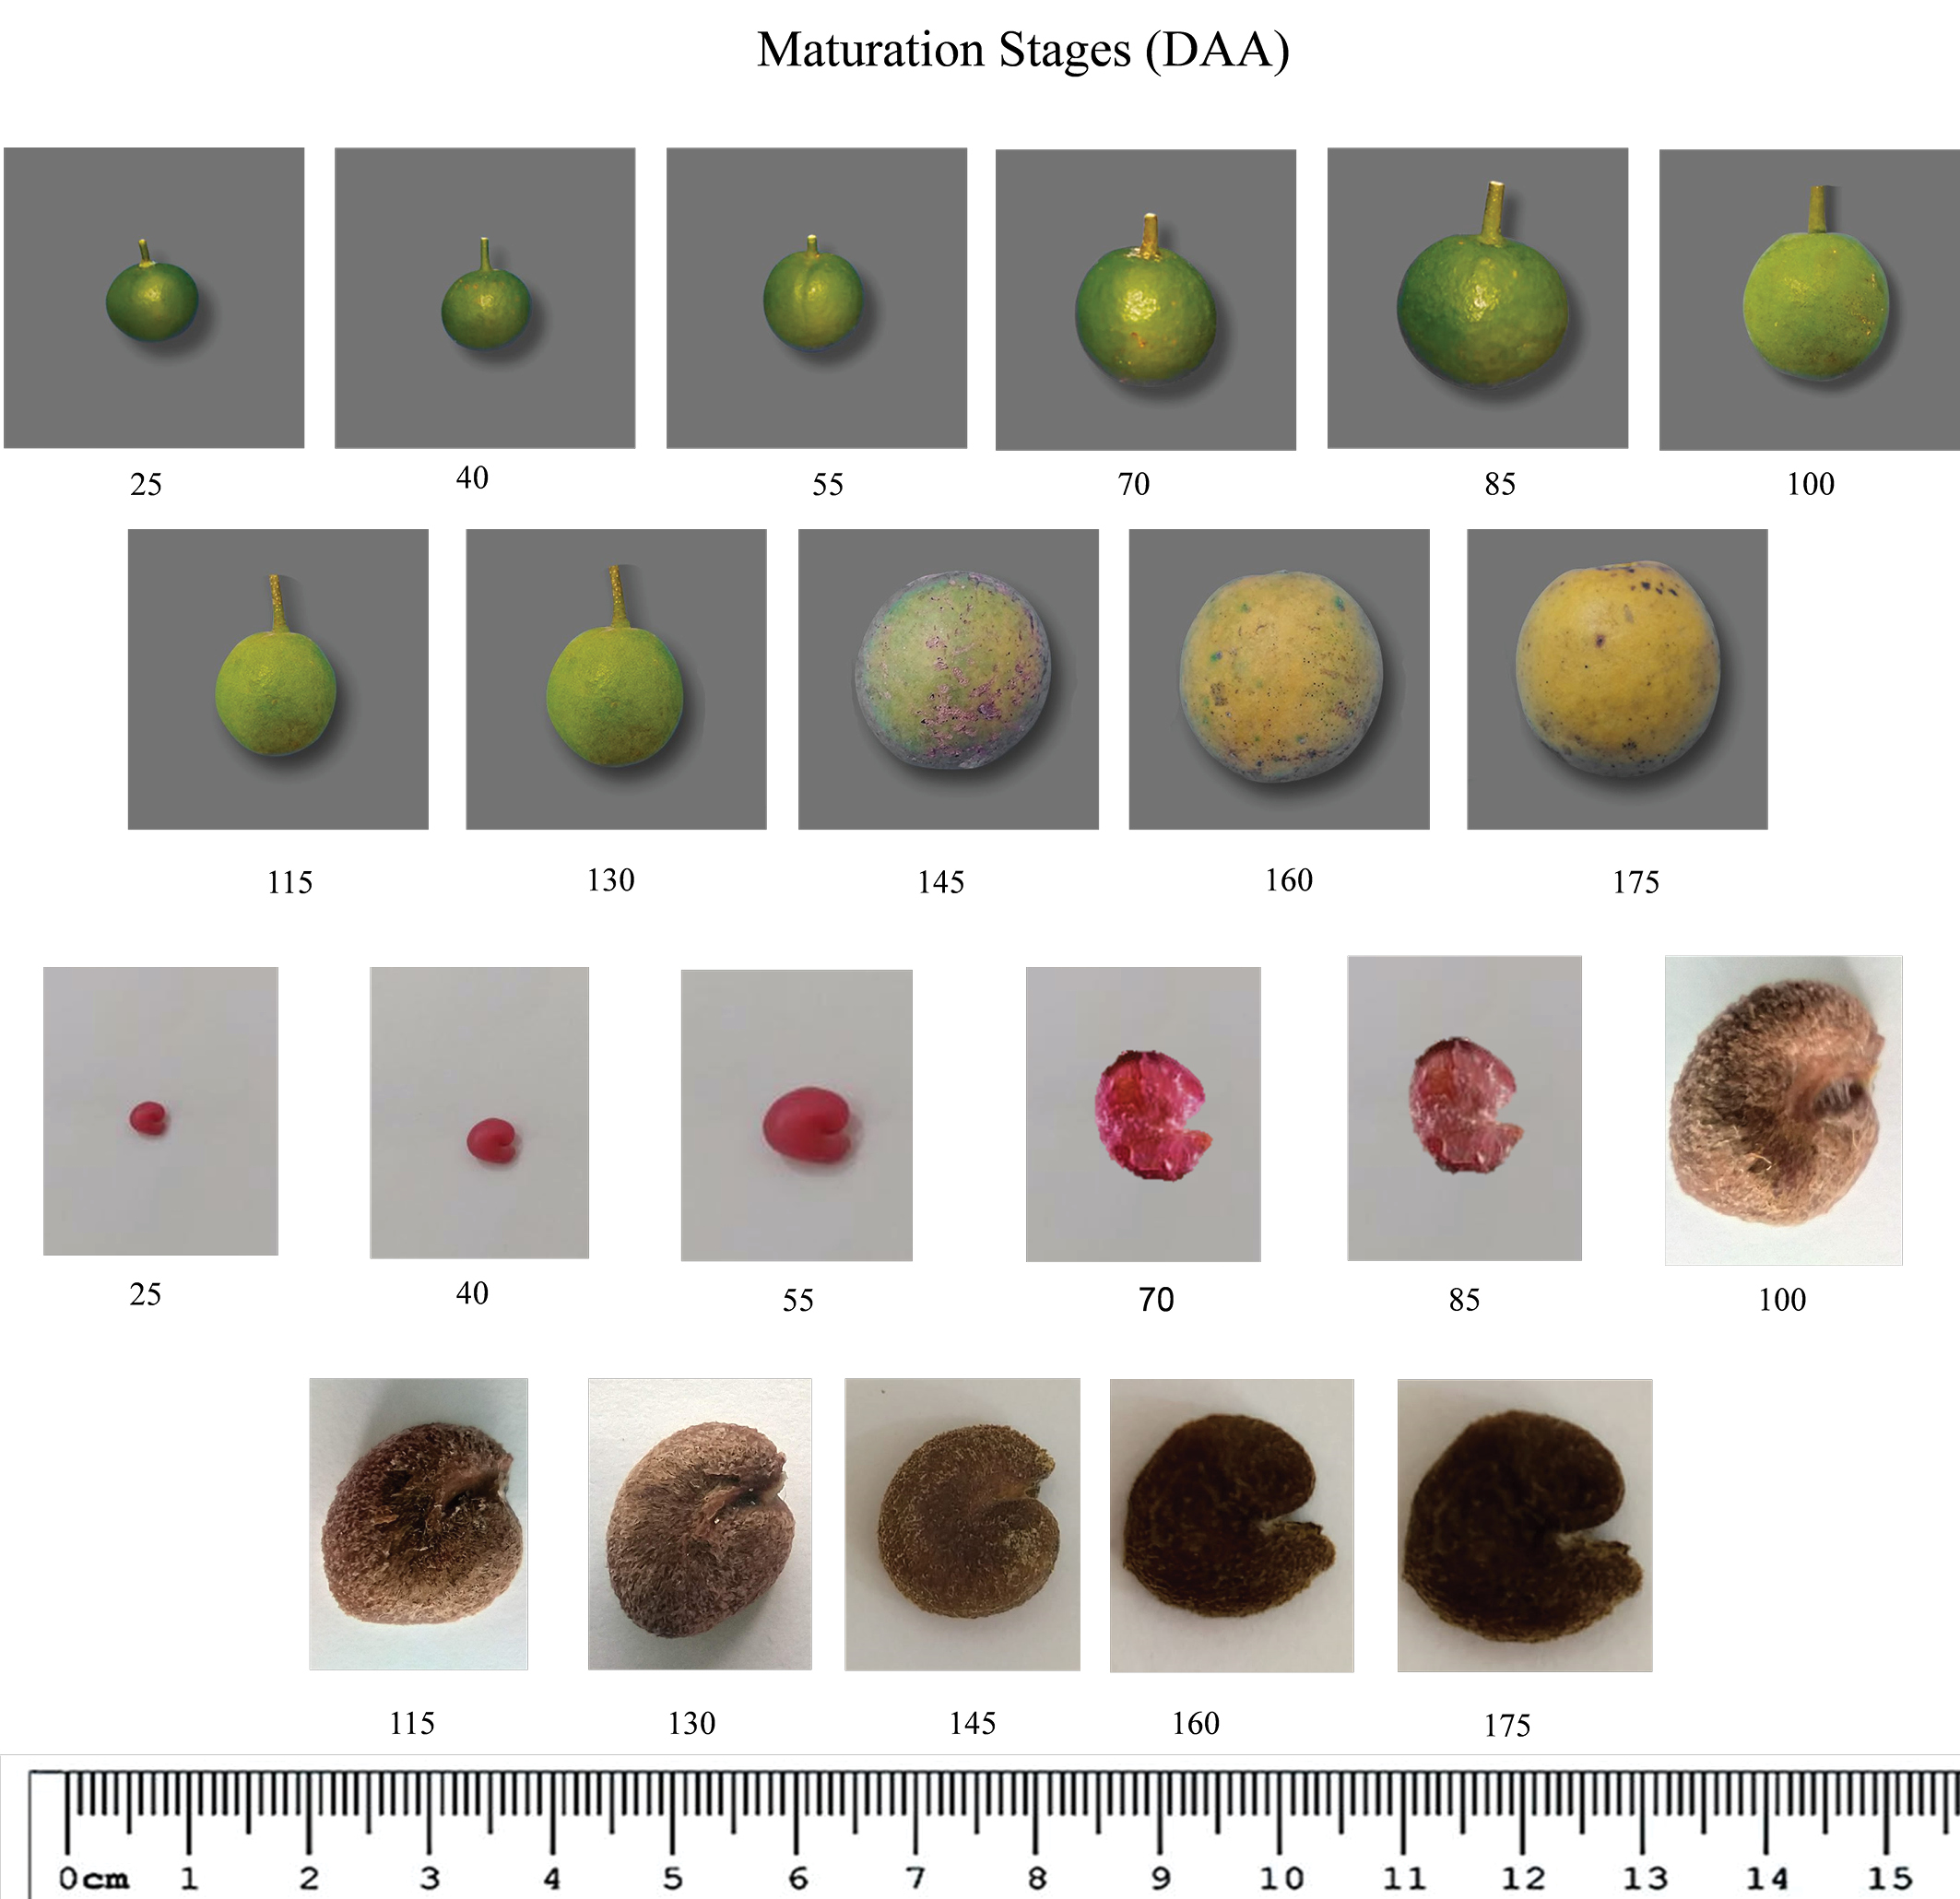
This reduction in epicarp hue angle values reflects a color change as the fruits mature. It indicates that the green hue, associated with early developmental stages, gradually fades, giving way to a more yellowish color indicative of maturation. In contrast, the seeds show the opposite trend, with the hue angle increasing over time as they shift from an initial pink hue to a dark brown color (Figure 5).

Visual aspects of the different stages of development and maturation of Crateva tapia fruits (A) and seeds (B)
The color change in fruits during development is due to the degradation of pigments like chlorophyll (Oliveira et al., 2021), as well as the breakdown of chromoplasts and their thylakoid membranes, allowing existing pigments to become visible or leading to the synthesis of new pigments responsible for the species-specific coloration (Keawmanee et al., 2023). The fresh mass of C. tapia fruits showed a quadratic trend across both production cycles, with an estimated maximum of 42.38 and 44.47 g at 134 and 131 DAA in cycles I and II, respectively, demonstrating the statistical difference between the two production cycles (Figure 4G). The increase in fresh mass results from cell division and fruit enlargement, as well as the deposition of sugars generated by photosynthesis and accumulated in the fruit during its formation (Wang et al., 2022; Wang et al., 2023).
Variability in production between consecutive years can be attributed to a combination of genetic and environmental factors. For instance, precipitation and temperature play a significant role in this context (Xie et al., 2024). These influences can lead to changes in various aspects, such as morphology, anatomy, and photosynthetic rate, among others (Lauriks et al., 2021; Roussos, 2024).
The length of C. tapia fruits followed a quadratic model throughout the maturation stages, with an estimated maximum of 42.24 mm at 130 DAA for the first cycle and 41.74 mm at 132 DAA for the second cycle, there is a difference between the cycles only at the 160 DAA maturation stage, with higher values for cycle II (Figure 4H). Changes in fruit length during development result from the translocation of photoassimilates for fruit formation (Rodrigues et al., 2021). Fruit moisture content also fit a quadratic model, decreasing with maturation stages, with the lowest values at 164 and 149 DAA, reaching an estimated minimum of 64 and 65.42% for cycles I and II, respectively, and throughout the development of the fruits, cycle II differed statistically from cycle I, with higher values, but there was no difference between the cycles at the stages of 55, 100, 115, 130, 160 and 175 DAA (Figure 4I).
As fruits develop their moisture content decreases due to the physiological processes involved in fruit and seed maturation this reduction is primarily associated with the mobilization and accumulation of assimilates which are transported and deposited in the fruit and seeds these processes promote the transition from a water-rich structure to a more compact composition optimizing seed storage and enhancing fruit quality at maturity (Silva et al., 2019). Genetic-environmental interactions regulate the growth of C. tapia fruits, influencing pulp deposition. Genetic composition determines the rate of development, while factors such as water, temperature and soil modulate these differences between populations and production cycles (Yangaza et al., 2024), which explains the difference between the production cycles of C. tapia. The estimated maximum dry mass values of the fruits were 11.91 and 11.31 g at 129 and 150 DAA, respectively, in the first and second evaluated cycles. After reaching this peak, the dry mass decreased to 8.99 (cycle I) and 10.77 g (cycle II) at 175 DAA. However, between the 70 and 100 DAA stages, cycle I presented higher values in dry mass of the fruits compared to cycle II, but then there was an inversely proportional behavior with higher values for the fruits harvested in the second cycle (Figure 4J).
During fruit development, the ovary undergoes multiple cycles of cell division following fertilization, followed by a phase of intense cell division, cellular expansion, and differentiation, which is responsible for the significant increase in volume as well as in the mass of fleshy fruits, as seen in C. tapia (Anwar et al., 2018). In this context, physiological and biochemical processes of synthesis and degradation occur during fruit maturation, which consequently lead to changes in the physical and chemical characteristics of the fruits (Pereira et al., 2014; Kaur et al., 2024).
The seed fresh mass gradually increased with fruit development, reaching an estimated maximum of 0.2422 and 0.2264 g at 123 and 136 DAA in cycles I and II, respectively (Figure 6A), due to the translocation of photoassimilates synthesized by the plant and transferred to the developing seed (Okada et al., 2021). The first production cycle presented seeds with greater weight between the 55 and 145 DAA stages, however, in the final stages (160 and 175 DAA) of seed development there was a more pronounced reduction for the seeds harvested in cycle I compared to cycle II (Figure 6A).

Fresh mass (A), length and width (B), moisture content (C), and dry mass of seeds (D); germination percentage (GP) and first germination count (FGC) (E), germination speed index (F), mean germination time (G), shoot length and root length (H), and shoot dry mass (SDM) and root dry mass (RDM) (I) of Crateva tapia seeds as a function of different maturation stages across two production cycles
At this stage, seeds also accumulate water because these reserve translocations from the plant to the seed only occur in an aqueous medium. This process causes the cotyledons and hypocotyl to occupy most of the seed’s internal space. After reaching maximum weight, the seed enters a desiccation phase, during which all internal structures begin to lose water (Teixeira et al., 2018), explaining the slight reduction in fresh mass in the final maturation stages.
The gradual increase in seed fresh mass throughout fruit development is due to the translocation of photoassimilates and water accumulation, offering valuable insights into seed development (Okada et al., 2021). This information is useful as it can help improve seed collection practices for reforestation and restoration of degraded areas. Understanding the timeline of seed development can be crucial for ensuring the availability of high-quality seeds for conservation and environmental recovery efforts (Dutra-Silva et al., 2024).
The length of C. tapia seeds did not differ between cycles I and II (Table 1), but a gradual increase was observed with seed development, reaching an estimated maximum of 9.42 mm at 122 DAA (Figure 6B). Seeds increase in size rapidly until they reach their maximum, which is due to cell multiplication and development within the embryo as well as in the reserve tissues. However, after reaching this peak, a slight reduction in seed size occurs due to water loss (Carvalho & Nakagawa, 2012; Zhang et al., 2021; Obura & Lamo, 2024).
The width of C. tapia seeds showed a quadratic trend in relation to development in both production cycles, reaching an estimated maximum of 8.96 mm at 126 DAA for the first cycle and 8.12 mm at 124 DAA for the second cycle, followed by a subsequent decrease (Figure 6B). Among the production cycles, it was found that from 40 to 85 DAA, there was a difference between cycles I and II, with higher values for cycle I, while between the stages of 100 and 130 DAA, the cycles did not differ statistically from each other (Figure 6B).Variations in seed size observed between the different production cycles are primarily due to environmental conditions. Factors such as geographic distribution and the biotic and abiotic characteristics of the environment during development directly influence phenotype, including seed size, according to the specific conditions of each year. Consequently, it is common to observe differences in size and mass between production cycles from one year to another (Gao et al., 2023). Seeds with larger dimensions in length, width, and thickness produce more vigorous seedlings, as they store more dry mass, which increases seedling survival (Goudégnon et al., 2022).
It was not possible to determine the moisture and dry mass of the seeds harvested at 25 DAA, since, at this stage, they are predominantly composed of water. Furthermore, removing the pulp resulted in the rupture of the structures. Therefore, these variables were analyzed only in the range of 40 to 175 DAA (Figures 6C and D).
The moisture content of C. tapia seeds gradually decreased with advancing maturation stages. In the first cycle, a linear decrease was observed, ranging from 81.41 to 27.39% between 40 and 175 DAA, a reduction of 66.35%. In the second cycle, a quadratic trend was noted, with moisture starting at 93.28% in the initial phase and reaching an estimated minimum of 34.55% at 175 DAA, differing statistically from cycle I in the stages from 130 to 175 DAA (Figure 6C).
The discrepancy in seed moisture between production cycles can be attributed to increased precipitation, as the second cycle experienced a significant rise in rainfall (Figure 1), resulting in greater water availability for the plants and, consequently, the seeds. The amount of water available in the environment plays a crucial role in seed development, as plant roots absorb soil water during growth.
The moisture content of fruits and seeds is high at the beginning of the maturation process, ranging between 70 and 80%, and may increase by an additional 5% before beginning to dehydrate. If the seeds remain in the field, this moisture content may fluctuate further toward the end of maturation due to the influence of ambient relative air humidity (Carvalho & Nakagawa, 2012).
The seed dry mass data showed no significant difference between cycles I and II (Table 1); however, was observed, with gradual increases across different maturation stages, reaching an estimated maximum of 0.144 g at 175 DAA (Figure 6D). The increase in dry mass in seeds is due to the synthesis and storage of reserves such as carbohydrates, lipids, and proteins, which develop in specific organelles located in the embryonic axis or endosperm (Shibata et al., 2020).
C. tapia seeds from fruits harvested between 25 and 85 DAA did not germinate. Thus, maturation stages from 100 to 175 DAA were evaluated, during which the seeds showed germinative capacity. A quadratic trend was observed in the data as maturation progressed, with germination peaks of 100 and 99% at 153 and 149 DAA for cycles I and II, respectively, cycle II presented higher values than cycle I, differing statistically between the 100 and 160 DAA stages, followed by a slight reduction in germination in the final maturation stages, with no statistical difference between the cycles at 175 DAA (Figure 6E).
The absence or low germination percentage in the early maturation stages is related to the physiological immaturity of the embryo, meaning the seeds need more time to reach physiological maturity and a higher germination percentage (Silva et al., 2022a). This slight reduction in germination at the end of the maturation process is due to intense seed respiration, which initiates the deterioration of the stored reserves within the seed (Silva et al., 2022b).
Regarding the first germination count, an exponential increase was observed as maturation stages progressed, rising from 0.90 to 88.67% between 107 and 175 DAA in the first cycle, reflecting a 98.9% increase over this period. In the second cycle, a quadratic trend was observed, reaching a peak of 60.7% at 175 DAA (Figure 6E). In the second cycle, the higher first germination count at the 100 and 115 DAA stages suggests that the seeds reached physiological maturity earlier, possibly due to factors such as better resource availability or more favorable temperatures (Obura et al., 2024), while at the 160 and 175 DAA stages, the first cycle presented higher values (Figure 6E).The first germination count reflects seed vigor, making it essential to determine the optimal harvest time to obtain high-quality seeds, characterized by maximum dry mass accumulation, high vigor, and greater germination potential (Carvalho & Nakagawa, 2012).
The highest germination speed index values were observed in seeds harvested at 126 and 136 DAA, with estimated indices of 0.91 and 1.008 for cycles I and II, respectively, followed by a decrease in these values in the final maturation stages, with a statistical difference between the production cycles, with a higher average speed for the seeds harvested in the second cycle from 115 to 175 DAA (Figure 6F). This decline in seed vigor in the later stages of maturation results from the physiological detachment between seed and mother plant. The seeds remain in field conditions, exposed to environmental factors, which leads to physiological changes such as deterioration, reducing seed physiological quality (Silva et al., 2019).
The mean germination time data for C. tapia seeds fit a quadratic model in both cycles, reaching a minimum average time of 13.24 and 14.62 per days at 148 and 147 DAA for the first and second cycles, respectively, with no difference between cycles I and II at stages 115, 130 and 175 DAA (Figure 6G). The accumulation of reserves during seed development is crucial for successful germination. Seeds with higher germination speed are consequently more capable of developing under direct sowing conditions in the field (Cruz et al., 2021).
Analyzing the performance of seedlings in the germination test, a quadratic trend was observed in shoot and root length data across both production cycles, with peak efficiency at 142 and 150 DAA (8.34 and 11.35 cm) and 152 and 175 DAA (10.45 and 10.80 cm) for cycles I and II, respectively, differing statistically at 175 DAA, with greater length for seeds harvested in the second cycle (Figure 6H). Cell elongation capacity is pre-established during embryogenesis (Losada, 2023). Thus, for C. tapia seeds, elongation and subsequent seedling growth capacity are acquired during reserve deposition in the seed, which occurs as part of its development.
In the dry mass of the shoot of seedlings in the germination test, a gradual increase was observed across maturation stages, with an estimated maximum of 0.041 and 0.062 g at 150 and 175 DAA for cycles I and II, respectively, with statistical difference between the cycles in the stages of 145 to 175 DAA, with maximum accumulation of dry mass for cycle II (Figure 6I). For the root dry mass of seedlings in the germination test for both cycles, the data did not fit any tested models (linear or quadratic), with an average value of 0.0171 and 0.0172 g for cycles I and II, respectively (Figure 6I).
Seedlings reach maximum dry mass when seeds contain peak reserves, likely coinciding with the point of physiological maturity (Silva et al., 2019). Seed vigor is directly associated with the ability to store reserves, and one of the best tests for assessing seed quality and vigor is seedling performance, which can be evaluated through tests that demonstrate reserve transfer, such as seedling growth and dry mass accumulation (Meneguzzo et al., 2021).
There was no seedling emergence when seeds were obtained between 25 and 85 DAA. Therefore, data were evaluated for maturation stages between 100 and 175 DAA, fitting a quadratic regression model, with an estimated maximum emergence of 84.6% (cycle I) and 100% (cycle II) at 157 and 152 DAA, respectively, in which the second cycle presented higher values than the first cycle, differing statistically in all the maturation stages evaluated (Figure 7A).

Emergence percentage (A), emergence time (B), and mean emergence speed (C), total seedling length (D), shoot dry mass across different cycles (E), total dry mass (F) of Crateva tapia seeds across different maturation stages in two production cycles
When seeds reach physiological maturity, there is a greater accumulation of reserves in the storage tissues, enhancing the capacity to convert these reserve materials into substances that can be assimilated by the embryo (Mata et al., 2013). This, in turn, results in a higher seedling emergence percentage, even under non-controlled conditions such as those in a greenhouse (Dode et al., 2012).
The mean emergence time data for seedlings from first-cycle seeds fit a quadratic model, with an estimated minimum of 18.1 per days at 156 DAA, while in the second cycle, an estimated minimum of 16.75 per days was reached at 165 DAA, based on seed maturation stages (Figure 7B). The mean emergence speed of seedlings (Figure 7C) increased as seed development progressed, reaching a maximum of 0.06 per days at 158 DAA and 0.06 per days at 165 DAA in cycles I and II, respectively, not differing only in the maturation stage of 145 DAA.This positive effect of seeds that have reached physiological maturity is due to the complete formation of their biochemical, morphological, and structural systems (Song et al., 2022). Fully developed seeds have an enhanced capacity to produce normal seedlings in a shorter average time and with a higher mean emergence speed (Nakada et al., 2011).
The absence of seedling emergence from seeds in the early maturation stages likely occurred because the embryonic axis was still developing, there was a lack or insufficiency of reserves to resume embryonic growth, or due to the high content of abscisic acid (ABA), which is typically present in seeds at early developmental stages (Nambara & Marion, 2005).
The total seedling length data from the emergence test fit a quadratic model, gradually increasing with seed development and reaching estimated maximum values of 18.35 and 19.13 cm at 149 DAA in Cycles I and II, respectively, however there was no difference between the cycles in the stages of 100 to 130 DAA, while at 145 and 160 DAA there were statistically significant differences (Figure 7D). A decrease in seedling length was observed after reaching these maximum values, indicating that prolonged exposure of seeds to field conditions negatively impacts their physiological quality.
Seeds that produce larger, normal seedlings are considered more vigorous (Meneguzzo et al., 2021) and consequently have a greater chance of emerging even under adverse conditions, such as those found in the field. According to Müller et al. (2016), longer seedlings indicate high vigor due to greater reserve accumulation. When the translocation of assimilates from the plant to the developing seed ceases, it indicates that the seed has accumulated the maximum it was genetically programmed to store, marking the point at which the seed reaches physiological maturity.
There was no significant interaction between the evaluated factors for shoot dry mass of seedlings in the emergence test (Table 1); however, significance was found for the maturation stages factors. Seedlings from seeds in cycle II showed higher shoot dry mass compared to cycle I (Figure 7E). For the total dry mass of seedlings in cycles I and II, the data fit a quadratic model, with estimated maximums of 0.258 and 0.202 g at 166 and 158 DAA for the first and second cycles, respectively, however, no difference was found between the cycles for the 100 and 130 DAA maturation stages, while in the 145 to 175 DAA stages the first cycle presented superior results, differing from the second cycle (Figure 7F).
This result indicates that C. tapia seeds at 142 DAA are in an advanced maturation stage with maximum dry mass accumulation in their tissues, which positively affects the dry mass content of the resulting seedlings, thereby increasing the likelihood of successful seedling establishment. According to Mondo et al. (2012), seedlings from seeds with high physiological potential have a greater capacity for dry mass accumulation. The magnitude of canonical correlations between climatic factors and C. tapia seed maturation characteristics evaluated from 40 to 175 DAA was high; however, both canonical pairs were not significant based on the chi-square test (Table 2).
During the period from 25 to 175 per days after anthesis (DAA), a significant correlation at the 1% probability level was observed in the first canonical pair between Group I traits, climatic variables, and other seed maturation characteristics of C. tapia (Table 3). This pair is of particular interest as it demonstrates the relationship between the evaluated groups (Rad et al., 2014). This correlation indicated that temperature had a low canonical correlation with all analyzed variables, suggesting that as temperature increases, both groups of variables are negatively affected. In contrast, regarding precipitation, reduced water availability for plants decreased seed length and width, as this condition lowers cell turgor, consequently limiting the plant’s metabolic activity. This reduction in metabolic activity affects the synthesis of organic compounds, resulting in smaller seeds produced by these plants.
The canonical pair analysis revealed significant correlations between temperature, relative air humidity, and C. tapia seed maturation variables (100 to 175 per days after anthesis - DAA) in both canonical pairs (Table 4). Temperature showed a positive, though low, correlation with germination and emergence percentages. Conversely, temperature had a negative correlation with all other analyzed variables, with the strongest negative correlation (moderate) observed for the first germination count (Table 4). This suggests that higher temperatures may support these processes, likely by accelerating biochemical reactions and activating enzymes essential for germination (Kijowska-Oberc et al., 2021).
Relative air humidity, in turn, correlated negatively with all germination and emergence test variables except for mean germination and emergence times and root system dry mass in the germination test (Table 3). This indicates that higher humidity levels may be detrimental to these processes, as excess moisture can create unfavorable conditions, such as oxygen deficiency, that may inhibit germination and early seedling development (Reed et al., 2022). However, mean germination and emergence times and root system dry mass were exceptions, showing no negative correlation. This suggests that these specific aspects of seed development may be less sensitive to variations in relative air humidity.
Thus, it is evident that during the development of C. tapia seeds, physical and physiological transformations occur, culminating in seed physiological maturity between 142 and 150 DAA. However, delaying harvest, allowing seeds to remain in fruits under field conditions beyond this period, directly affects their physiological quality.
Conclusions
-
Crateva tapia seeds reach physiological maturity between 142 and 150 per days after anthesis.
-
Morphological aspects of the fruits, such as green coloration with small yellow traces, indicate seed physiological maturity.
-
The development of Crateva tapia seeds involves morphological and physiological changes that affect their quality and germination capacity.
-
Climatic conditions, such as temperature and precipitation during Crateva tapia seed formation, influence the germination process and vigor.
Acknowledgments
We thank the Coordination for the Improvement of Higher Education Personnel - Brazil (CAPES - Finance Code 001).
Literature Cited
-
Agência Executiva de Gestão das Águas (AESA). Meteorologia por região. Disponível em: Disponível em: http://www.aesa.pb.gov.br/aesa-website/meteorologia-chuvas-grafico/?id_municipio=79&date_chart=2020-10-31.=month Acesso: 27/11/2022.
» http://www.aesa.pb.gov.br/aesa-website/meteorologia-chuvas-grafico/?id_municipio=79&date_chart=2020-10-31.=month -
Ali, F.; Qanmber, G.; Li, F.; Wang, Z. Updated role of ABA in seed maturation, dormancy, and germination. Journal of Advanced Research, v.35, p.99-214, 2022. https://doi.org/10.1016/j.jare.2021.03.011
» https://doi.org/10.1016/j.jare.2021.03.011 -
Alvares, C. A.; Stape, J. L.; Sentelhas, P. C.; Gonçalves, J. D. M.; Sparovek, G. Köppen’s climate classification map for Brazil. Meteorologische zeitschrift, v.22, p.711-728, 2014. https://doi.org/10.1127/0941-2948/2013/0507
» https://doi.org/10.1127/0941-2948/2013/0507 -
Alves, E. U.; Santos-Moura, S. S.; Moura, M. F.; Guedes, R. S.; Estrela, F. A. Germinação e vigor de sementes de Crataeva tapia L. em diferentes substratos e temperaturas. Revista Brasileira de Fruticultura, v.34, p.1208-1215, 2012. https://doi.org/10.1590/S0100-29452012000400030
» https://doi.org/10.1590/S0100-29452012000400030 -
Anwar, R.; Mattoo, A. K.; Handa, A. K. Ripening and senescence of fleshy fruits. In: Paliyath, G.; Subramanian, J.; Lim, L. T.; Subramanian, K. S.; Handa, A. K.; Mattoo, A. K. (Eds.) Postharvest biology and nanotechnology. Nova Jersey: Wiley Online Library, 2018. p.15-51. https://doi.org/10.1002/9781119289470.ch2
» https://doi.org/10.1002/9781119289470.ch2 -
Araújo, R. M. S.; Vaz, A. F. M.; Aguiar, J. S.; Coelho, L. C. B. B.; Paiva, P. M. G.; Melo, A. M. M.; Silva, T. G.; Correia, M. T. S. Lectin from Crataeva tapia bark exerts antitumor, anti-inflammatory and analgesic activities. Natural Products and Bioprospecting, v.1, p.97-100, 2011. https://doi.org/10.1007/s13659-011-0014-8
» https://doi.org/10.1007/s13659-011-0014-8 -
Arruda, M. D. M.; Paz, S. L. A.; Cruz Filho, I. J.; Sousa, G. F.; Silva, G. A. S.; Santos, D. K. D. N.; Lima, M. C. A.; Rocha, G. J. M.; Souza, I. A.; Melo, C. M. L. Characterization of a lignin from Crataeva tapia leaves and potential applications in medicinal and cosmetic formulations. International Journal of Biological Macromolecules, v.180, p.286-298, 2021. https://doi.org/10.1016/j.ijbiomac.2021.03.077
» https://doi.org/10.1016/j.ijbiomac.2021.03.077 - BRASIL. Ministério da Agricultura, Pecuária e Abastecimento. Regras para análise de sementes. Brasília: MAPA/ACS, 2009. 399p.
- Carvalho, N. M.; Nakagawa, J. Sementes: ciência, tecnologia e produção. Jaboticabal: FUNEP, 2012. 590p.
-
Cruz, C. D. Genes: A software package for analysis in experimental statistics and quantitative genetics. Acta Scientiarum. Agronomny, v.35, p.271-276, 2013. https://doi.org/10.4025/actasciagron.v35i3.21251
» https://doi.org/10.4025/actasciagron.v35i3.21251 - Cruz, C. D.; Carneiro, P. C. S. Modelos biométricos aplicados ao melhoramento genético. Editora UFV, 1.ed., 2003. 585p.
- Cruz, C. D.; Ferreira, F. M.; Pessoni, L. A. Biometria aplicada ao estudo da diversidade genética. Visconde do Rio Branco: Suprema, 620p, 2011.
-
Cruz, M. S. F. V.; Malavasi, M. M.; Ristau, A. C. P.; Malavasi, U. C.; Dranski, J. A. L. Maturidade de sementes de Anadenanthera colubrina (Vell.) Brenan. Revista Ciência Florestal, v.31, p.515-532, 2021. https://doi.org/10.5902/1980509835444
» https://doi.org/10.5902/1980509835444 -
Dode, J. S.; Meneghello, G. E.; Moraes, D. M.; Peske, S. T. Teste de respiração para avaliar a qualidade fisiológica de sementes de girassol. Revista Brasileira de Sementes, v.34, p.686-691, 2012.http://dx.doi.org/10.1590/S0101-31222012000400021
» http://dx.doi.org/10.1590/S0101-31222012000400021 -
Dutra-Silva, Rodrigo; Overbeck, Gerhard E.; Müller, Sandra C. How can Brazilian legislation on native seeds advance based on good practices of restoration in other countries?. Perspectives in Ecology and Conservation, v.22, p.224-231, 2024. https://doi.org/10.1016/j.pecon.2024.08.002
» https://doi.org/10.1016/j.pecon.2024.08.002 - Ferreira, M. D.; Spricigo, P. C.. Parte 4. Análises não destrutivas: calorimetria - princípios e aplicações na agricultura. Embrapa Instrumentação, v.4, p.1-16, 2017.
-
Gao, C.; Liu, F.; Miao, Y.; Li, J.; Liu, Z.; Cui, K. Effects of geo‐climate factors on phenotypic variation in cone and seed traits of Pinus yunnanensis Ecology and Evolution, v.13, e10568, 2023. https://doi.org/10.1002/ece3.10568
» https://doi.org/10.1002/ece3.10568 -
Goudégnon, E. O. A.; Salako, K. V.; Teka, O.; Gouwakinnou, G. N.; Gandji, K.; Tohoun, R.; Oumorou, M.; Sinsin, B. Effect of seed maturity and morphotype traits on seed germination of Lannea microcarpa in the dry Sudanian region of Benin. Bois et Forêts des Tropiques, v.352, p.3-12, 2022. https://doi.org/10.19182/bft2022.352.a36925
» https://doi.org/10.19182/bft2022.352.a36925 -
Henning, F. A.; Mertz, L. M.; Jacob Junior, E. A.; Machado, R. D.; Fiss, G.; Zimmer, P. D. Composição química e mobilização de reservas em sementes de soja de alto e baixo vigor. Bragantia, v.69, p.727-734, 2010. https://doi.org/10.1590/S0006-87052010000300026
» https://doi.org/10.1590/S0006-87052010000300026 -
Justino, E. V.; Boiteux, L. S.; Fonseca, M. E. N.; Silva Filho, J. G.; Nascimento, W. M. Determinação da maturidade fisiológica de sementes de pimenta dedo de moça Capsicum baccatum var. pendulum. Horticultura Brasileira, v.33, p.324-331, 2015. https://doi.org/10.1590/S0102-053620150000300008
» https://doi.org/10.1590/S0102-053620150000300008 -
Kapoor, L.; Simkin, A. J.; Doss, C. G. P.; Siva, R. Fruit ripening: dynamics and integrated analysis of carotenoids and anthocyanins. BMC Plant Biology, v.22, p.1-22, 2022. https://doi.org/10.1186/s12870-021-03411-w
» https://doi.org/10.1186/s12870-021-03411-w -
Kaur, J.; Singh, Z.; Mazhar, M. S.; Shah, H. M. S.; Woodward, A. Changes in Physical Attributes, Activities of Fruit Softening Enzymes, Cell Wall Polysaccharides and Fruit Quality of Jackfruit (Artocarpus heterophyllus Lam.) as Influenced by Maturation and Ripening. Horticulturae, v.10, e1264, 2024. https://doi.org/10.3390/horticulturae10121264
» https://doi.org/10.3390/horticulturae10121264 -
Keawmanee, N.; Ma, G.; Zhang, L.; Kato, M. Regulation of chlorophyll and carotenoid metabolism in citrus fruit during maturation and regreening. Reviews in Agricultural Science, v.11, p.203-216, 2023. https://doi.org/10.1016/j.hpj.2024.02.004
» https://doi.org/10.1016/j.hpj.2024.02.004 -
Kijowska-Oberc, J.; Staszak, A. M.; Ratajczak, E. Climate change affects seed aging? Initiation mechanism and consequences of loss of forest tree seed viability. Trees, v.35, p.1-10, 2021. https://doi.org/10.1007/s00468-020-02072-w
» https://doi.org/10.1007/s00468-020-02072-w - Labouriau, L. G. A germinação das sementes. Washington: Secretaria Geral da Organização dos Estados Americanos, 1983. 174p.
- Lorenzi, H. Árvores brasileiras: manual de identificação e cultivo de plantas arbóreas nativas do Brasil. 5.ed. Nova Odessa: Instituto Plantarum, 2009. 384 p.
-
Losada, J. M. Concluding embryogenesis after diaspora: Seed Germination in Illicium parviflorum Integrative and Comparative Biology, v.63, p.1352-1363, 2023. https://doi.org/10.1093/icb/icad078
» https://doi.org/10.1093/icb/icad078 -
Maguire, J. D. Speed of germination aid in selection and evaluation for seedling vigour. Crop Science, v.2, p.176-177, 1962. https://doi.org/10.2135/cropsci1962.0011183X000200020033x
» https://doi.org/10.2135/cropsci1962.0011183X000200020033x -
Mata, M. F.; Silva, K. B.; Bruno, R. D. L. A.; Felix, L. P.; Medeiros Filho, S.; Alves, E. U. Maturação fisiológica de sementes de ingazeiro (Inga striata) Benth. Semina: Ciências Agrárias, v.34, p.549-565, 2013. https://doi.org/10.5433/1679-0359.2013v34n2p549
» https://doi.org/10.5433/1679-0359.2013v34n2p549 -
Meneguzzo, M. R. R.; Meneghello, G. E.; Nadal, A. P.; Xavier, F. D. M.; Dellagostin, S. M.; Carvalho, I. R.; Gonçalves, V. P.; Lautenchleger, F.; Lângaro, N. C. Seedling length and soybean seed vigor. Ciência Rural, v.51, e20190495, 2021. https://doi.org/10.1590/0103-8478cr20190495
» https://doi.org/10.1590/0103-8478cr20190495 -
Mondo, V. H. V.; Cicero, S. M.; Dourado-Neto, D.; Pupim, T. L.; Dias, M. A. N. Vigor de sementes e desempenho de plantas de milho. Revista Brasileira de Sementes , v.34, p.143-155, 2012. https://doi.org/10.1590/S0101-31222012000100018
» https://doi.org/10.1590/S0101-31222012000100018 -
Muhammad, N.; Luo, Z.; Yang, M.; Liu, Z.; Liu, M. The underlying molecular mechanisms of external factors influencing fruit coloration in fruit trees. Scientia Horticulturae, v.309, n.5, p. 111615, 2023. https://doi.org/10.1016/j.scienta.2022.111615
» https://doi.org/10.1016/j.scienta.2022.111615 -
Müller, E. M.; Gibbert, P.; Binotto, T.; Kaiser, D. K.; Bortolini, M. F. Maturação e dormência em sementes de Peltophorum dubium (Spreng) Taub. de diferentes árvores matrizes. Iheringia Série Botânica, v.71, p.222-229, 2016. https://isb.emnuvens.com.br/iheringia/article/view/583
» https://isb.emnuvens.com.br/iheringia/article/view/583 -
Nambara E.; Marion-Poll, A. Abscisic acid biosynthesis and catabolism. Annual Reviews, v.56, p.165-185, 2005. https://doi.org/10.1146/annurev.arplant.56.032604.144046
» https://doi.org/10.1146/annurev.arplant.56.032604.144046 -
Nakada, P. G.; Oliveira, J. A.; Melo, L. C.; Gomes, L. A. A.; Pinho, E. V. R. V. Desempenho fisiológico e bioquímico de sementes de pepino nos diferentes estádios de maturação. Revista Brasileira de Sementes , v.33, p.113-122, 2011. https://doi.org/10.1590/S0101-31222011000100013
» https://doi.org/10.1590/S0101-31222011000100013 -
Obura, M.; Lamo, J. Influence of seed development and maturation on the physiological and biochemical seed quality. In Seed Biology-New Advances. IntechOpen, v.1, p.1-15, 2024. http://dx.doi.org/10.5772/intechopen.1002321
» http://dx.doi.org/10.5772/intechopen.1002321 -
Okada, M. H.; Oliveira, G. R. F.; Sartori, M. M. P.; Crusciol, C. A. C.; Nakagawa, J.; Amaral da Silva, E. A. Acquisition of the physiological quality of peanut (Arachis hypogaeaL.) seeds during maturation under the influence of the maternal environment. PloS One, v.16, e0250293, 2021. http://dx.doi.org/10.1371/journal.pone.0250293
» http://dx.doi.org/10.1371/journal.pone.0250293 -
Oliveira, C. D.; Gomes, B. A. F.; Furtado, M. L. B.; Barbosa, D. P.; Boas, E. V. B. V. Alterações nas características físicas e bioquímicas de frutos de Cordia superba durante a maturação. Research Society and Development, v.10, e503101019203, 2021. http://dx.doi.org/10.33448/rsd-v10i10.19203
» http://dx.doi.org/10.33448/rsd-v10i10.19203 -
Oliveira, G. R. F.; Silva, E. A. A. Tropical peanut maturation scale for harvesting seeds with superior quality. Frontiers in Plant Science, v.15, e1376370, 2024. https://doi.org/10.3389/fpls.2024.1376370
» https://doi.org/10.3389/fpls.2024.1376370 -
Pereira, F. E. C. B.; Torres, S. B.; Silva, M. I. L.; Grangeiro, L. C.; Benedito, C. P. Qualidade fisiológica de sementes de pimenta em função da idade e do tempo de repouso pós-colheita dos frutos. Revista Ciência Agronômica. v.45, p.37-44, 2014. https://doi.org/10.1590/S1806-66902014000400011
» https://doi.org/10.1590/S1806-66902014000400011 -
R Core Team. R: A language and environment for statistical computing. R Foundation for statistical computing, Viena, 2018. Disponível em: R: The R Project for Statistical Computing (Disponível em: R: The R Project for Statistical Computing (https://www.r-project.org ). Acesso em: 20 de outubro de 2022.
» https://www.r-project.org -
Rad, M. R. N. S.; Koohkan, S. H. R.; Fanaei, M. K. Multivariate analysis to determine relationship between phenological traits with yield components in native melon population (Cucumis melo L.). Scientific Journal of Crop Science , v.3, p.48-55, 2014. https://doi.org/10.14196/sjcs.v3i5.1370
» https://doi.org/10.14196/sjcs.v3i5.1370 -
Reed, R. C.; Bradford, K. J.; Khanday, I. Seed germination and vigor: ensuring crop sustainability in a changing climate. Heredity, v.128, p.450-459, 2022. https://doi.org/10.1038/s41437-022-00497-2
» https://doi.org/10.1038/s41437-022-00497-2 -
Rodrigues, M. H. B. S.; Lopes, K. P.; Bomfim, M. P.; Pereira, N. A. E.; Silva, J. G.; Paiva, F. J. S.; Santos, A. S. Characterization of physiological maturity of Physalis peruviana L. fruits. Revista Semina: Ciências Agrárias , v.42, p.929-948, 2021. https://doi.org/10.5433/1679-0359.2021v42n3p929
» https://doi.org/10.5433/1679-0359.2021v42n3p929 - Santana, D. G.; Ranal, M. A. Análise da germinação: um enfoque estatístico. 1.ed. Editora UnB. Brasília, 2004. 247 p.
-
Shaheb, M. R.; Islam, M. N.; Nessa, A.; Hossain, M. A. Effect of harvest times on the yield and seed quality of french bean. Saarc Journal of Agriculture, v.13, p.1-13, 2015. http://dx.doi.org/10.3329/sja.v13i1.24175
» http://dx.doi.org/10.3329/sja.v13i1.24175 -
Shibata, M.; Coelho, C. M. M.; Steiner, N.; Block, J. M.; Maraschin, M. Lipid, protein and carbohydrate during seed development inAraucaria angustifolia Cerne, v.26, p.301-309, 2020. http://dx.doi.org/10.1590/01047760202026022653
» http://dx.doi.org/10.1590/01047760202026022653 -
Silva, L. S.; Gentil, D. F. O.; Fereira, S. A. N. Maturation and germination of Trichosanthes cucumerina L. seeds. Journal of Seed Science, v.44, e202244027, 2022b. https://doi.org/10.1590/2317-1545v44261463
» https://doi.org/10.1590/2317-1545v44261463 -
Silva, P. C. C.; Alves, E. U.; Araújo, L. R.; Cruz, J. O.; Silva, N. C. C. Physiological maturation in seeds of Lophantera lactescens Ducke. Revista Ciência Agronômica , v.50, p.312-320, 2019. https://doi.org/10.5935/1806-6690.20190037
» https://doi.org/10.5935/1806-6690.20190037 -
Silva, P. M.; Moreira, J. W.; Barreira, S. Maturidade fisiológica e morfológica de sementes de quaresmeira (Tibouchina granulosa Cogn.). Revista Enciclopédia Biosfera, v.19, p.169-182, 2022a. https://doi.org/10.18677/EnciBio_2022C20
» https://doi.org/10.18677/EnciBio_2022C20 - Singh, D. The relative importance of characters affecting genetic divergence. Indian Journal of Genetics and Plant Breeding, v.41, p.237-245, 1981.
-
Soares-Neto, R. L.; Luber, J. Capparaceae in Flora e Funga do Brasil. Jardim Botânico do Rio de Janeiro. Disponível em: <Disponível em: https://floradobrasil.jbrj.gov.br/FB22300 >. Acesso em: 23 abr. 2023.
» https://floradobrasil.jbrj.gov.br/FB22300 -
Song, Y.; Rowland, D. L.; Tillman, B. L.; Wilson, C. H.; Sarnoski, P. J.; Zurweller, B. A. Impact of seed maturity on season-long physiological performance and offspring seed quality in peanut (Arachis hypogaea L.). Field Crops Research, v.288, e108674, 2022. https://doi.org/10.1016/j.fcr.2022.108674
» https://doi.org/10.1016/j.fcr.2022.108674 -
Souza, J. T.; Nunes, J. C.; Cavalcante, L. F.; Nunes, J. A. D. S.; Pereira, W. E.; Freire, J. L. D. O. Effects of water salinity and organomineral fertilization on leaf composition and production in Passiflora edulis Revista Brasileira de Engenharia Agrícola e Ambiental, v.22, p.535-540, 2018. https://doi.org/10.1590/1807-1929/agriambi.v22n8p535-540
» https://doi.org/10.1590/1807-1929/agriambi.v22n8p535-540 -
Teixeira, F. P.; Faria, J. M. R.; Pereira, W. V. S.; José, A. C. Maturation and desiccation tolerance in seeds of Sesbania virgata (Cav.) Pers. Revista Floresta Ambiente, v.25, e20160419, 2018. https://doi.org/10.1590/2179-8087.041916
» https://doi.org/10.1590/2179-8087.041916 -
Wang, W.; Wang, Y.; Chen, T.; Qin, G.; Tian, S. Current insights into posttranscriptional regulation of fleshy fruit ripening. Plant Physiology, v.192, p.1785-1798, 2023. https://doi.org/10.1093/plphys/kiac483
» https://doi.org/10.1093/plphys/kiac483 -
Wri - Brasil. 2022. ONU declara a Década sobre Restauração de Ecossistemas. Disponível em: Disponível em: https://brasil.un.org/pt-br/197897-década-para-restauração-de-ecossistemas-“é-hora-de-unir-esforços” Acesso em: 10-09-2024.
» https://brasil.un.org/pt-br/197897-década-para-restauração-de-ecossistemas-“é-hora-de-unir-esforços” -
Yangaza, I. S.; Nyomora, A. M.; Joseph, C. O.; Sangu, E. M.; Hormaza, J. I. Growth and Fruit morphometric characteristics of local avocado germplasm (Persea americana Mill.) grown in northern Tanzania. Heliyon, v. 10, n.7, p. e29059, 2024. https://doi.org/10.1016/j.heliyon.2024.e29059
» https://doi.org/10.1016/j.heliyon.2024.e29059 -
Zhang, S.; Yan, S.; An, P.; Cao, Q.; Wang, C.; Wang, J.; Zhang, H.; Zhang, L. Embryogenic callus induction from immature zygotic embryos and genetic transformation of Larix kaempferi 3x Larix gmelinii 9. PloS one, v.16, e0258654, 2021. https://doi.org/10.1371/journal.pone.0258654
» https://doi.org/10.1371/journal.pone.0258654
Supplementary documents:
All data generated or analyzed during this study will be provided upon request to the corresponding author.




 DAA - Days after anthesis

