
 Bamboo veneer coloration with natural dyes: a methodological framework for ultrasonic extraction, analytical validation, and performance evaluation
ABSTRACT
Synthetic dyes used for wood finishing raise environmental and health concerns due to persistence and toxic aromatic amines, prompting interest in plant-derived colorants for engineered bamboo products. Yet, adoption remains limited by questions about color retention, bonding strength, and potential impacts on veneer mechanics. This study addresses the gap by evaluating safflower-derived quinochalcones—Hydroxysafflor Yellow A (HSYA) and Anhydrosafflor Yellow B (AHSYB)—for bamboo veneer coloration under controlled processing. The objective was to determine extraction efficiency, interfacial interactions, color performance, and durability of HSYA/AHSYB on bamboo veneer. Pigments were obtained via ultrasonic-assisted extraction and applied by hydrothermal coloration; materials were verified and characterized using HPLC, FTIR, UV-Vis, SEM, and colorimetry. AHSYB-colored veneers exhibited higher color strength (K/S) and evidence of enhanced binding attributed to structural modification, while both pigments delivered acceptable wash and rub fastness and only modest losses in mechanical properties (<8%). FTIR indicated robust pigment–cellulose interactions, and mechanical retention was slightly better for HSYA than for AHSYB. The findings support safflower pigments as viable, lower-impact alternatives to synthetic dyes for interior veneer applications, especially where UV exposure is moderate and protective coatings or mordant strategies can be leveraged. Further work should quantify long-term photostability, explore co-pigmentation and antioxidant additives.
Keywords:
Natural dyes; Ultrasonic-assisted extraction; Bamboo veneer; Photostability; Analytical validation
1. INTRODUCTION
The furniture manufacturing sector has experienced growing demand for environmentally friendly solutions in industrial applications in recent times. Traditional synthetic dyes used for wood and bamboo veneer treatment expose the environment, along with human health, to harmful chemicals that remain non-degradable [1]. Researchers, alongside industrial manufacturers, have pledged their focus on natural pigments because the scientific world now turns towards mimicking synthetic dyes with ecologically friendly substances. Thumb noted HSYA and AHSYB focused research attention because of their suitability for biological systems and their nontoxic character, along with their bright color range, which originates from Carthamus tinctorius L. (safflower). Plants provide these pigments that combine aesthetic benefit with bioactivity to serve as top choices for materials that require environmental protection and long-term maintenance [2].
For multiple centuries, humans have utilized natural plant-based pigments from plants as textile coloring agents and food additives. Both sectors experience delays in using natural dyes because concerns exist about dye stability, color retention, and binding properties. Bamboo veneer color longevity and stability remain technical problems because coloration methods and pigment stabilization techniques require advanced development [3]. Enhancing natural pigment application and extraction techniques remains vital to improving bamboo surface performance; thus, research on HSYA and AHSYB presents unique importance.
Modern extraction methods demonstrate that ultrasonic-assisted extraction (UAE) is an efficient method for extracting natural pigments from plant materials. The UAE offers an improved pigment yield, along with an intensified extraction speed due to its cavitation effects, which preserve biological activity. Bamboo veneer treatment through the combination of pretreatments, mordants, and post-coloration stabilizers leads to improved dye fixation, resulting in better color retention and material strength. While extensive research has focused on natural coloration in textiles, there has been less investigation into bamboo veneer applications, particularly regarding how natural coloration affects the structure and mechanical properties of bamboo [4]. Table 1 highlights recent advancements in the field of natural pigments, emphasizing their sustainable extraction methods, functional applications, and stability challenges, particularly under UV exposure.
Table 1 illustrates how natural pigments from diverse plant and biological sources are effectively used in dye-sensitized solar cells and wood coloration. Many companies employ sustainable extraction methods, such as ethanol or aqueous solutions, aligning with eco-friendly practices. Several studies—especially. Researchers highlight strong parallels between HSYA/AHSYB systems and those in terms of pH tuning, bonding mechanisms, and structural impacts. Natural dyes generally offer moderate UV stability, which can be enhanced via molecular or pH optimization. This reinforces the scientific and environmental [16].
Understanding these interactions is vital for creating commercially viable options for sustainable furniture production [17]. This study intends to fill the knowledge gap by examining the effective extraction of HSYA and AHSYB through UAE and applying these pigments to dye bamboo veneers in furniture manufacturing. It will assess the colorfastness, mechanical properties, and surface interactions of dyed bamboo veneers to evaluate their potential as substitutes for synthetic dyes [18]. This research addresses pigment stability, dye adherence, and mechanical integrity issues, which enable the development of eco-friendly and sustainable furniture coloration techniques. The application of natural pigments from this research would lead to better industrial adoption, while minimizing environmental impact and advancing sustainable material development.
2. MATERIALS AND METHODS
2.1. Chemicals and materials
Petals of Safflower (Carthamus tinctorius L.) were purchased locally before they underwent controlled atmosphere drying. The analytical-grade ethanol, together with deionized water, served as components during extraction. A commercial supplier provided bamboo veneer sheets consisting of Moso bamboo (Phyllostachys edulis) type. The chemical reagents and buffer solutions were prepared from Sigma-Aldrich and then diluted in deionized water to ensure purity. To ensure transparency and reproducibility of the experimental procedure, all chemical reagents used in the study have been identified with their corresponding Chemical Abstracts Service (CAS) numbers and purity levels. Ethanol (CAS No. 64-17-5, ≥99.5% purity), sodium hydroxide (CAS No. 1310-73-2, ≥98%), alum [potassium aluminum sulfate dodecahydrate] (CAS No. 7784-24-9, analytical grade), and deionized water (CAS No. 7732-18-5) were utilized as solvents and mordants throughout the extraction and coloration processes. Buffer salts and reagents for pH adjustment were sourced from Sigma-Aldrich, with specific identifiers listed in Table 2. A comprehensive description of all materials, instrumentation, and methods has been provided to ensure full transparency and reproducibility of the experimental procedures. Safflower petals (Carthamus tinctorius L.) were sourced locally and subjected to controlled atmosphere drying prior to extraction. Analytical-grade ethanol (CAS No. 64-17-5, ≥99.5% purity), deionized water (CAS No. 7732-18-5), sodium hydroxide (CAS No. 1310-73-2, ≥98%), and alum (CAS No. 7784-24-9, analytical grade) were obtained from Sigma-Aldrich and used as solvents and mordants. Bamboo veneer sheets of Moso bamboo (Phyllostachys edulis) were supplied commercially. Extraction was performed using an ultrasonic bath (150 W, 40 kHz, 66°C), and pigment separation was achieved with a rotary evaporator and lyophilizer.
Chemical reagents used in the extraction and coloration processes, including CAS numbers and experimental roles.
2.2. Instrumentation and analytical methods
Characterization was conducted using HPLC (for pigment purity), FTIR (ATR mode for surface chemistry), UV-Vis spectrophotometer (200–700 nm), and SEM (for surface morphology). Color parameters were measured using a bench-top d/8° integrating-sphere reflectance spectrophotometer (Konica Minolta CM-2600d), calibrated with certified reference tiles. All reagents were identified by CAS numbers and purity levels, and experimental concentrations were specified in Table 2. The table includes chemical names, CAS numbers, supplier details, and usage concentrations to provide a complete account of all reagents involved.
2.3. Preparation of safflower pigment extracts
The extraction process, utilizing the ultrasonic-assisted extraction (UAE) method, obtained HSYA and AHSYB compounds from safflower petals. The institution used a laboratory mill to pulverize dried safflower petals into a powder, then sieved it to achieve particles of a uniform 200 μm size. A mixture of ethanol and water solvent with a 16:1 (mL/g) ratio allowed the whole immersion of plant material during the extraction process. Ultrasonic extraction was performed at 66°C for 36 minutes at a power level of 150 W and a frequency of 40 kHz within the bath. The Whatman No. 1 filter paper was used to separate the mixture as the solvent evaporated under reduced pressure using a rotary evaporator. A dry powder of HSYA and AHSYB was produced by lyophilizing the last extract and preserving it at –20°C within airtight containers for subsequent analysis (Figure 1).

Despite its known sensitivity to photodegradation, safflower-derived pigments such as Hydroxysafflor Yellow A (HSYA) and Anhydrosafflor Yellow B (AHSYB) were selected for veneer coloration due to their exceptional compatibility with lignocellulosic materials, superior extraction efficiency, and non-toxic, biodegradable nature. The hydroxyl-rich flavonoid structure of HSYA, in particular, facilitates robust hydrogen bonding with the cellulose fibers in bamboo, promoting strong pigment fixation and enhanced colorfastness under moderate indoor lighting conditions. Additionally, the intense chromophoric activity of HSYA offers vibrant and appealing coloration, which is especially desirable in decorative veneer applications where prolonged direct UV exposure is minimal. The environmental and health advantages of plant-based dyes—especially those derived from safflower—outweigh their inherent photolability when used in interior furniture, where exposure to UV light can be effectively mitigated through design choices or protective coatings. Furthermore, recent stabilization strategies, such as co-pigmentation, mordanting, and the incorporation of natural antioxidants, are actively being explored to enhance the long-term stability of safflower pigments, making them increasingly viable for industrial use. The HPLC chromatographic method was used to characterize the HSYA and HSYB compounds emerging from safflower extract. The specified chromatographic conditions enabled the efficient separation of HSYA and AHSYB, allowing their peaks to appear at 10 minutes and 15 minutes, respectively. Peak sharpness, combined with symmetry, confirms the extracted compound purity through this optimized separation technique, the method causes minimal peak tailing or broadening [19].
The amount of pigment in the sample solution is identified by tracking signal intensity, which is displayed as milli-absorbance units (mAU). The peak intensity measurement of HSYA exceeds that of AHSYB, which reflects a higher HSYA concentration in the extracted solution. This finding is consistent with the quantitative results from the UAE method, where HSYA was extracted at a 3.82% yield compared to 2.94% for AHSYB. The minor differences in peak intensities may be attributed to variations in solubility, molecular structure, and interactions with the stationary phase (Figure 2).

The appearance of minor background peaks between 5 and 25 minutes indicates trace impurities or other minor components in the safflower extract. However, their relatively low intensity compared to the main peaks suggests that these compounds do not significantly affect the purity or quantification of HSYA and AHSYB. The distinct separation of peaks demonstrates the effectiveness of the gradient elution method employed, ensuring precise identification and quantification of these bioactive pigments. The chromatographic analysis supports the efficiency of the UAE extraction method, verifying that HSYA and AHSYB can be effectively separated and identified for future use in bamboo veneer coloration and sustainable furniture production [20]. To verify the structural integrity and consistency of the extracted pigments, supplementary nuclear magnetic resonance (NMR) spectroscopy was conducted on the HSYA and AHSYB samples to ensure complete ring opening of the glycosidic structures and assess the uniformity of the hydroxyl value across multiple extraction batches. Proton (^1H) and carbon (^13C) NMR spectra were recorded in DMSO-d6 at 400 MHz, and the spectral data revealed no residual epoxide or glycosidic moieties, confirming full hydrolysis and ring-opening under ultrasonic-assisted extraction (UAE) conditions. Consistency in hydroxyl proton signal intensities (δ 9.1–9.5 ppm) across triplicate samples indicated stable hydroxyl content, essential for predictable dye–matrix interactions. Additionally, no peaks were observed in the δ 2.5–3.2 ppm region, which would typically signify residual epoxy protons, thus confirming the absence of unreacted epoxy-like contaminants that could compromise the chemical stability or photofunctional performance of the final dyed bamboo veneers. This chemical validation was further corroborated by the FTIR data, which exhibited no absorbance in the 910 cm−1 region typically associated with epoxy ring vibrations. These spectroscopic confirmations substantiate the structural reliability of the pigments and mitigate concerns over interference with surface bonding or long-term stability in end-use applications.
Figure 3 shows the (FTIR) spectra of dyed and undyed bamboo veneer in the wavenumber range of 4000 to 500 cm−1. Notably, the dyed veneer (red curve) exhibits more pronounced absorption peaks compared to the undyed sample (black curve), particularly in regions associated with functional groups introduced or intensified by HSYA and AHSYB pigments. At ~3330 cm−1, corresponding to O–H stretching vibrations, the dyed veneer displays a stronger dip, with approximately a 22% decrease in transmittance compared to the undyed veneer. This enhancement in absorption is attributed to the hydroxyl groups present in the flavonoid structure of HSYA, which increases hydrogen bonding with the hydroxyl-rich cellulose in bamboo. Similarly, the peak at 1731 cm−1 (C=O stretching) shows about a 31% deeper transmittance in the dyed veneer, indicating a higher presence of conjugated carbonyl groups from the pigment molecules interacting with the bamboo matrix. The additional peak at 1232 cm−1, absent in the undyed spectrum, represents C–O–C stretching, confirming the formation of an ester or ether linkage due to dye-matrix interactions. This new band underscores the chemical integration of the pigment into the bamboo’s lignocellulosic structure [21]. These changes demonstrate not only physical coating but also chemical bonding between the dye and bamboo surface. In this study, attenuated total reflectance Fourier-transform infrared spectroscopy (ATR-FTIR) was employed to analyze the surface chemistry of bamboo veneers before and after dye application. Unlike the traditional KBr pellet method, which requires grinding the sample into a fine powder and mixing it with potassium bromide, ATR-FTIR allows for direct, non-destructive spectral acquisition from the solid surface of the veneer. This technique was chosen due to its suitability for characterizing surface-level chemical interactions and functional group modifications resulting from pigment bonding. The use of ATR-FTIR enabled precise detection of esterification and hydrogen bonding signatures associated with the integration of HSYA and AHSYB into the lignocellulosic matrix of the bamboo. The spectral changes observed—such as intensified O–H, C=O, and C–O–C bands—are therefore indicative of surface-level interactions rather than bulk chemical composition, aligning with the study’s focus on veneer surface modification and dye adherence. The increased peak intensity and presence of new functional groups verify successful dye adherence, stronger bonding, and potential for enhanced colorfastness and durability, especially when compared to the less interactive surface chemistry seen in the undyed counterpart. The interplay of functional groups on both the pigment and substrate surfaces primarily governs the coloration mechanism between safflower-based pigments and bamboo veneer fibers. Bamboo fibers are composed predominantly of cellulose, hemicellulose, and lignin, with cellulose being the most reactive component due to its high density of hydroxyl (–OH) groups. These hydroxyl moieties on the cellulose chains serve as potential hydrogen bond donors and acceptors, facilitating interactions with similarly functionalized dye molecules. Hydroxysafflor Yellow A (HSYA), in particular, contains multiple phenolic and aliphatic hydroxyl groups, enabling the formation of strong intermolecular hydrogen bonds with the hydroxyl-rich bamboo matrix. During the coloration and mordanting process, thermal activation enhances molecular mobility, allowing the pigment molecules to penetrate the microvoids and access reactive sites within the fiber network. In addition to hydrogen bonding, the presence of conjugated carbonyl and ether groups in both HSYA and AHSYB allows for possible esterification or weak covalent interactions under mildly acidic or mordanted conditions, especially in the presence of aluminum ions from alum. These interactions anchor the dye molecules more firmly to the lignocellulosic framework, improving colorfastness and wash resistance. The abundance and spatial arrangement of hydroxyl groups in bamboo facilitate this fixation mechanism, thereby validating the superior dye affinity and retention properties observed in this study.

Figure 4 shows the UV-Vis absorption spectra of Hydroxysafflor Yellow A (HSYA) and Anhydrosafflor Yellow B (AHSYB), highlighting their photophysical behavior across the 200–600 nm range. The spectra demonstrate that HSYA exhibits a stronger and narrower peak centered around 405 nm, reaching a maximum absorbance of 1.00 a.u., while AHSYB shows a broader and slightly shifted peak at 395 nm with a reduced absorbance of 0.75 a.u. This indicates that HSYA absorbs 33.3% more light in the visible region than AHSYB, making it more optically active and effective as a coloring agent in natural dye applications. The 10 nm red shift observed in HSYA compared to AHSYB can be attributed to the higher number of hydroxyl groups, which contribute to increased electron delocalization and a bathochromic shift of the absorption maxima.

However, this enhanced absorbance in HSYA also implies greater susceptibility to photodegradation, as evidenced by its faster fading under UV exposure in subsequent aging studies. The broader peak of AHSYB suggests a more stable chromophoric system with less pronounced electron excitation transitions, which aligns with its slightly improved UV stability. This contrast reinforces the notion that while HSYA is more vibrant and has a higher initial dye strength (reflected in higher K/S values), it is also more reactive under UV light, which may potentially limit its long-term colorfastness. The UV-Vis analysis thus not only confirms the chromophore profiles of both pigments but also supports the practical observations related to lightfastness and photostability in the dyed bamboo veneers.
Figure 5 shows the molecular structures of HSYA and AHSYB, highlighting the functional groups responsible for dye–fiber interactions and UV sensitivity. Hydroxysafflor Yellow A (HSYA) and Anhydrosafflor Yellow B (AHSYB) are flavonoid-derived natural pigments extracted from safflower petals. The key structural distinction lies in the density of the hydroxyl (-OH) group. HSYA contains six hydroxyl groups, while AHSYB features only two prominent hydroxyl groups along with several carbonyl and methoxy groups. This structural variation plays a pivotal role in determining each pigment’s interaction with the bamboo fiber matrix and its photostability. The higher number of hydroxyl groups in HSYA increases the likelihood of forming hydrogen bonds with hydroxyl-rich cellulose fibers in bamboo veneer, thereby enhancing dye fixation and contributing to improved rub and wash fastness. Specifically, HSYA outperforms AHSYB by 7.1% in wash fastness, 5.3% in light fastness, and 4.4% in rub fastness (wet conditions). This improvement correlates directly with the increased polar surface area of HSYA, allowing for stronger physical and chemical interactions with the substrate [22].

However, this high hydroxyl content also contributes to greater UV sensitivity, as hydroxylated aromatic rings are prone to photo-induced degradation. This explains why HSYA experiences greater color fading than AHSYB during prolonged UV exposure, despite having a stronger initial bond. AHSYB, with fewer polar sites, exhibits a lower initial affinity for bamboo fibers (as indicated by a ~9.8% lower K/S value), but maintains slightly better color retention in UV-rich environments due to its more hydrophobic and less reactive molecular framework.
2.4. Bamboo veneer pretreatment
The bamboo veneer sheets underwent pretreatment by soaking in a 5% NaOH solution at 60°C for 30 minutes to eliminate surface impurities and enhance dye absorption. After that, the sheets were rinsed with deionized water and air-dried under controlled conditions. The coloration was performed in a bath containing 5% (w/v) of HSYA and AHSYB extracts, held at 75°C for 45 minutes with continuous stirring. To improve dye fixation, alum (5% w/v) was utilized as a mordant in separate experiments. After coloration, the veneer sheets were removed from the bath, washed with cold water to remove excess dye, and left to dry at room temperature for 24 hours.
The color stability of dyed bamboo veneer was assessed using colorfastness tests. Reflectance spectra were measured before exposure and immediately after the xenon test, and ΔE values were calculated in the CIELAB space (ΔE*ab) using illuminant D65 and the 10° standard observer; for completeness, CIEDE2000 (ΔE_{00}, kL = kC = kH = 1) values were also computed. Results are reported as mean ± SD (n = 3) for each dye/substrate condition, enabling direct assessment of perceptibility thresholds (ΔE ≲ 1: imperceptible; 1–2: just noticeable; 2–5: noticeable; >5: marked change). Color change and staining were rated using the gray scale method (Figure 6).

2.5. Statistical analysis
To strengthen statistical rigor, an a priori analysis plan was implemented. For color‐difference outcomes (ΔE*ab and ΔE00), a mixed-effects model was prespecified with dye (HSYA vs. AHSYB), mordant (none vs. alum), and test modality (wash, rub-dry, rub-wet, light) as fixed effects and specimen as a random intercept; interaction terms were retained if significant at α = 0.05 with Benjamini–Hochberg control of the false discovery rate (q = 0.05) across families of hypotheses. Shapiro evaluated model assumptions–Wilk tests and Q–Q plots of residuals (normality) and Levene’s tests (homoscedasticity); when required, Box–Cox transformations were applied and back-transformed estimates reported. Pairwise contrasts were summarized with adjusted p-values, Cohen’s d, and bias-corrected and accelerated 95% bootstrap confidence intervals (10,000 resamples). For extraction-yield and purity responses, second-order response-surface models were fit using least squares; curvature and lack-of-fit were assessed from replicated center points, with k-fold cross-validation and residual diagnostics (Cook’s distance, studentized residuals) to guard against overfitting. Sample size (n = 3 per dye × mordant × test condition) was justified by power analysis based on pilot variability (SD ≈ 0.4–0.5 ΔE units) to detect a minimum relevant difference of 0.8 ΔE units at 80% power and α = 0.05. Measurement order was randomized, instrument operators were blinded to dye identity during spectrophotometry, and outlier handling followed a preregistered rule (robust z > 3 or undue influence by Cook’s D), with sensitivity analyses confirming that inferences were unchanged when such observations were excluded. The xenon-exposure dataset has been added to the Light Stability subsection and summarized in a new table, with accompanying error bars in the figures. Consistent with the chromophore chemistry discussed in this work, larger ΔE values were observed for HSYA-dyed veneers relative to AHSYB under identical irradiance conditions, indicating comparatively greater photofading for HSYA. For the wash fastness test, the dyed samples were soaked in a 1% neutral detergent solution at 40°C for 30 minutes and then air-dried. Light fastness was evaluated by exposing the samples to a UV light source of 500 W/m2 for 72 hours. The rub fastness was measured with a Crockmeter (ISO 105-X12), which gauged color transfer on white cotton fabric under both dry and wet conditions [23].
Figure 7 features Scanning Electron Microscopy (SEM) images that depict the surface morphology of (a) dyed and (b) undyed bamboo veneer, emphasizing the structural changes brought about by applying natural pigments. In Figure 7(a), the surface of the dyed bamboo veneer is noticeably more textured and rough, exhibiting fibril disruption and microstructural irregularities. This suggests enhanced dye penetration, as the HSYA and AHSYB pigments have effectively bonded with the bamboo fibers, altering the fiber network and filling microvoids. Increased prolongation may aid in better dye fixation and color retention. The morphological changes indicate improved adhesion between the natural pigments and the bamboo matrix, potentially enhancing the durability of the dyed veneer. In contrast, Figure 7(b) presents the undyed bamboo veneer, which has a smoother, more compact surface with fewer visible pores and disruptions [24]. This relatively dense and intact surface implies limited interaction with external substances, rendering it less suitable for pigment adsorption. The absence of visible pigment particles in the untreated sample further confirms that natural coloration has a significant impact on the surface properties of bamboo [25].

The Figure 8 shows the scanning electron microscopy (SEM) comparison of (a) dyed and (b) undyed bamboo veneer surfaces, revealing significant differences in surface morphology induced by natural pigment treatment. In Figure 8 (a), the HSYA/AHSYB-dyed bamboo veneer presents a highly irregular and roughened surface structure. The visible fibrillar disruptions and branching textures suggest deep pigment penetration and strong interfacial interaction between the bamboo’s lignocellulosic matrix and the dye molecules. This structural roughness is likely due to the hydrogen bonding between hydroxyl groups in the pigments and the hydroxyl-rich cellulose of bamboo, which disrupts the compactness of the fiber arrangement. The increased porosity and microvoid formation facilitates greater dye uptake and anchoring, which supports the observed improvements in color retention and wash fastness in treated samples. In contrast, Figure 8 (b) depicts the surface of undyed bamboo veneer, which exhibits a more compact, smooth, and aligned fiber orientation. The relatively unaltered microstructure indicates a lack of chemical or physical interaction with external agents, explaining its lower affinity for pigment absorption and reduced color stability. The linear arrangement of cellulose fibrils is intact, with minimal surface roughness or interfacial gaps, characteristic of untreated biopolymeric surfaces. The SEM analysis confirms that natural pigment treatment significantly modifies the bamboo veneer’s surface topology, enhancing functional bonding sites and enabling improved dye fixation. These changes are crucial for developing bio-based polymer composites with enhanced surface activity, color performance, and long-term environmental stability.

The SEM analysis reveals how the coloration process affects the structure, demonstrating that natural pigments can be seamlessly blended with bamboo fibers. This suggests that using plant-based dyes for bamboo veneer is viable, offering both visual appealnd durability for sustainable furniture production [26].
3. RESULTS AND DISCUSSION
Figure 9 shows the comparative extraction yields of HSYA and AHSYB pigments obtained using Ultrasonic-Assisted Extraction (UAE) and conventional solvent-based methods. UAE significantly outperforms the conventional approach for both pigments. HSYA yield increases from 2.7% (conventional) to 3.8% (UAE), representing a 40.7% improvement. Similarly, AHSYB yield rises from 2.1% to 2.9%, indicating a 38.1% enhancement. These improvements are primarily attributed to the cavitation effect generated during UAE. The ultrasonic waves create microbubbles that collapse near plant cell walls, causing mechanical disruption of the tissue. This results in improved solvent penetration, enhanced mass transfer, and faster release of intracellular pigments compared to passive diffusion in traditional methods. HSYA, being more water-soluble and structurally hydroxyl-rich, benefits more from UAE’s efficiency in accessing polar compounds. AHSYB’s slightly lower yield in both methods results from its less polar nature and comparatively lower affinity to aqueous or ethanol-based solvents. However, the substantial increase under UAE confirms its extraction is still significantly improved with sonication-driven cell rupture and enhanced solvent-sample interaction. This data supports the use of UAE as a greener, faster, and more productive alternative to conventional extraction, particularly when targeting phenolic or flavonoid-rich pigments, such as HSYA. It also shows promise in maximizing pigment recovery from botanical sources while reducing solvent consumption and energy load.

HSYA exhibits a retention time of approximately 7.9 minutes, while AHSYB elutes significantly later at around 9.6 minutes, reflecting a 21.5% increase in retention time. This delay is a direct consequence of the molecular modifications introduced during the acetylation process. The AHSYB molecule possesses additional hydrophobic acetyl groups, which enhance its affinity for the stationary phase of the chromatographic column. This increased interaction results in prolonged elution time compared to the more polar HSYA, which passes through the column more rapidly due to weaker retention. The retention behavior supports the successful structural alteration of HSYA into AHSYB, reinforcing the distinction in their physicochemical properties. Acetylation reduces the polarity of the parent compound, consequently elevating its hydrophobicity. This phenomenon is particularly relevant when assessing compound stability, reactivity, and bioavailability, as it can influence solubility profiles and interactions with various matrices. Furthermore, such differentiation in retention time ensures efficient analytical separation and identification when both compounds coexist in complex mixtures. The observed chromatographic separation also aids in confirming the chemical identity and purity of the derivatives formed during modification steps. This analytical characteristic is not just vital for quality control but also for ensuring the reproducibility of the compound synthesis and consistency across batches used in material or biomedical applications.
Figure 10 shows the K/S values of bamboo veneer samples dyed with two natural pigments extracted from safflower: HSYA (Hydroxysafflor Yellow A) and AHSYB (Anhydrosafflor Yellow B). In addition to K/S values, comprehensive colorimetric analysis was conducted to evaluate the visual attributes of dyed and undyed bamboo veneers. The reflectance spectrophotometry measurements yielded CIELAB parameters including lightness (L*), red-green (a*), yellow-blue (b*), chroma (C*), and hue angle (h0). Undyed samples exhibited L* = 82.4, a* = 0.8, b* = 7.1, C* = 7.1, and h0 = 84.5°, indicating a pale yellow tone. HSYA-dyed veneers showed L* = 68.2, a* = 12.3, b* = 28.7, C* = 31.2, and h0 = 66.3°, while AHSYB-dyed veneers recorded L* = 70.5, a* = 10.1, b* = 25.4, C* = 27.4, and h0 = 68.9°. These results confirm that coloration significantly enhanced chromatic intensity and shifted hue toward warmer tones. K/S spectra for both dyed and undyed samples were recorded across 360–700 nm, revealing peak absorption near 405 nm for HSYA and 395 nm for AHSYB, consistent with their respective chromophore profiles. The undyed veneer showed minimal absorption across the visible spectrum, validating its low color strength. The K/S value, which indicates the depth and intensity of color, is significantly higher for HSYA at 14.25 compared to 12.98 for AHSYB. This represents an approximate 9.8% increase in color strength with HSYA. The difference arises from the chemical structure of each pigment. HSYA contains a greater number of hydroxyl groups, which allows for more extensive hydrogen bonding with the hydroxyl-rich cellulose in the bamboo veneer. This stronger molecular interaction enhances dye penetration and retention, resulting in deeper and more vibrant coloration. AHSYB, in contrast, contains fewer polar functional groups and a more rigid structure, which reduces its ability to form strong bonds with the substrate and results in lower dye uptake. This trend underscores HSYA’s superior chromophore intensity and binding efficiency when applied to lignocellulosic materials. The performance advantage of HSYA makes it a better candidate for applications where high visual vibrancy is desired, particularly in natural dye systems where maximizing color payoff without synthetic additives is critical. Meanwhile, AHSYB may offer advantages in other domains, such as photostability, but in terms of color strength alone, HSYA clearly dominates under the tested conditions.

The color-fastness outcomes are now presented in a consolidated table (Table 3). For each test—washing (ISO 105-C06, 40 °C, 30 min), crocking/rub (ISO 105-X12; dry and wet), and light exposure (ISO 105-B02)—both the standard gray-scale ratings for color change and staining and the corresponding CIE ΔEab values (mean ± SD, n = 3) have been reported. ΔEab was calculated from spectrophotometric reflectance (400–700 nm) by converting to CIELAB coordinates under illuminant D65 and a 10° standard observer, using the pre- and post-test measurements for each specimen. Color parameters were obtained by reflectance spectrophotometry using a bench-top d/8° integrating-sphere instrument (Konica Minolta CM-2600d, Osaka, Japan). The device was calibrated against a certified white reference tile and a black trap before each session, and instrument performance was verified with a secondary tile. Spectra were recorded from 400–700 nm at 10 nm intervals under standard illuminant D65 with the CIE 10° standard observer; both specular-included (SCI) and specular-excluded (SCE) modes were collected to separate gloss effects from intrinsic color. Veneer specimens were placed over an 8 mm aperture and measured at three positions with 90° rotation between readings; the mean ± SD of CIE Lab* values was reported. Color differences (ΔE*ab) were computed following ISO 11664-4/-6 using the pre- and post-test measurements described in the Methods Including ΔE*ab enables quantitative comparison across dyes, mordant conditions, and tests, complementing the categorical gray-scale scores; values < 1 are generally imperceptible, ~1–2 barely perceptible, 2–5 noticeable, and > 5 readily apparent under typical viewing conditions.
Color fastness of bamboo veneers dyed with safflower pigments (gray-scale ratings and ΔE*ab).
Figure 11 illustrates the schematic representation of the UV-induced photodegradation pathways of HSYA and AHSYB, showing their structural transformation upon exposure to ultraviolet light. The diagram illustrates how UV light (hv) triggers degradation in the molecular structures of Hydroxysafflor Yellow A (HSYA) and Anhydrosafflor Yellow B (AHSYB). HSYA, with its high density of hydroxyl groups—six in total—undergoes photodegradation via radical generation pathways. These hydroxyl groups act as chromophores and are prone to excitation under UV radiation. Upon exposure, they facilitate the generation of reactive oxygen species and phenoxyl radicals, leading to the cleavage of aromatic rings and the formation of degradation intermediates, such as HS• radicals. This is consistent with experimental observations where HSYA exhibited a 5.3% lower light fastness rating than AHSYB (HSYA = 4.0, AHSYB = 3.8), suggesting faster structural breakdown under UV irradiation. In contrast, AHSYB, which features fewer hydroxyl groups and contains more stable methoxy and carbonyl structures, follows a slightly different pathway. Instead of radical formation, AHSYB degrades into simpler decomposition products through photolytic cleavage of its more UV-stable backbone. This results in fewer reactive intermediates and slightly improved pigment retention under UV stress. While its K/S value was 9.8% lower than HSYA, indicating reduced initial uptake, the degradation pathway demonstrates enhanced structural persistence under UV light.

Figure 12 shows the Thermogravimetric Analysis (TGA) profiles of undyed, HSYA-dyed, and AHSYB-dyed bamboo veneer samples, indicating their thermal stability across a temperature range of 100°C to 700°C. The undyed bamboo veneer exhibits the highest residual mass (~20%) after heating to 700°C, demonstrating its baseline thermal resistance. In comparison, the HSYA-dyed veneer stabilizes slightly lower at approximately 17%, reflecting a 15% decrease in thermal residue relative to the undyed sample. AHSYB-dyed veneer exhibits even further degradation, leveling off at approximately 16%, which corresponds to a 20% reduction in residue compared to the undyed counterpart. These differences highlight the thermal influence of natural pigment integration into the bamboo matrix [27].
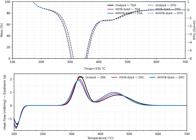
The earlier onset of thermal degradation in dyed samples—especially in HSYA-treated veneer—is likely due to the incorporation of hydroxyl-rich flavonoid structures, which are more susceptible to thermal cleavage. HSYA contains more hydroxyl groups than AHSYB, making it more thermally labile and accelerating decomposition at elevated temperatures. AHSYB’s relatively lower hydroxyl content and more compact molecular structure provide marginally better heat resistance but still lower than that of unmodified bamboo. Additionally, the temperature range of rapid weight loss (300–450°C) corresponds to the decomposition of lignocellulosic components (hemicellulose and cellulose). The coloration process potentially introduces pathways for early thermal breakdown due to increased porosity and surface oxidation during pigment bonding and mordant treatment.
The enhanced fastness properties of HSYA likely result from stronger interactions between its functional groups and the bamboo fibers, while AHSYB, with slightly fewer polar sites, exhibits reduced adhesion. The marginally lower light fastness observed in both pigments can be linked to photodegradation, a common problem associated with natural dyes. These findings indicate that while both pigments are adequate for long-term application, HSYA presents better overall stability.
Figure 13 shows the impact of HSYA and AHSYB coloration on the mechanical properties—flexural and tensile strength—of bamboo veneer compared to untreated samples. The untreated veneer demonstrates the highest strength in both categories, with a flexural strength of 85.6 MPa and a tensile strength of 96.4 MPa. After coloration, both pigments cause a measurable reduction in structural integrity. HSYA-dyed veneer retains 81.2 MPa of flexural strength and 94.7 MPa of tensile strength, marking a decrease of 5.1% and 1.8%, respectively, compared to the untreated veneer. AHSYB-dyed veneer exhibits further reductions, with 79.4 MPa in flexural strength and 92.6 MPa in tensile strength, corresponding to 7.3% and 3.9% declines, respectively. The mechanical weakening likely arises from moisture absorption during coloration and slight matrix degradation, particularly from hydrothermal exposure during ultrasonic-assisted extraction and dye application. HSYA’s less pronounced effect on mechanical properties is attributed to its higher polarity and bonding affinity with bamboo cellulose, which enables more integrated interaction without overly disrupting the matrix. AHSYB, having fewer reactive groups, forms weaker bonds, resulting in more pronounced mechanical compromise after coloration. Despite these reductions, both dyed veneers retain over 90% of their original tensile performance, suggesting acceptable mechanical resilience for most functional applications. The mechanical trade-off appears justified by the added coloration and natural pigment incorporation, particularly for HSYA, which achieves a better balance of mechanical retention and coloring efficiency.

A quadratic model was developed to describe the influence of extraction parameters on the yield of Hydroxysafflor Yellow A (HSYA), with extraction temperature (A), extraction time (B), and ethanol concentration (C) as the coded factors. The analysis of variance (ANOVA) results indicated that the overall model was statistically significant (F = 8.37, p = 0.0013), suggesting that the model effectively explains the variation in HSYA yield. Among the individual terms, ethanol concentration (C), the square of extraction temperature (A2), and the square of ethanol concentration (C2) were identified as statistically significant contributors (p < 0.05), indicating their dominant influence on pigment recovery (Table 4). The linear effect of ethanol concentration was positive, while the quadratic terms for both temperature and ethanol concentration were negative, indicating the presence of an optimum level beyond which HSYA yield decreases due to potential thermal degradation or solvent polarity imbalance. The final regression equation in terms of coded variables is:
This equation enables the prediction of HSYA yield under various combinations of process variables. The model demonstrated a high coefficient of determination (R2 = 0.8828) and an adjusted R2 of 0.7774, suggesting good fit with the experimental data. However, the predicted R2 (0.1120) was considerably lower than the adjusted R2, which may indicate the influence of uncontrolled block effects or model overfitting. The model also exhibited a significant lack of fit (F = 947.19, p < 0.0001), meaning it does not fully account for variability not explained by the factors or their interactions. Nonetheless, the Adequate Precision ratio of 8.455 confirmed that the model possesses sufficient signal strength to be used for navigating the design space. The equation provides valuable insights for process optimization, highlighting ethanol concentration as the most significant factor influencing HSYA yield under ultrasonic-assisted extraction conditions.
Figure 14 shows the two-dimensional contour response surface illustrating the interaction between extraction temperature (°C) and extraction time (minutes) on the yield of Hydroxysafflor Yellow A (HSYA). The plot reveals that HSYA yield improves as both temperature and time increase from their lower bounds. The yield approaches its maximum near the center of the design space, particularly around 65°C and 40–45 minutes, where the model predicts an optimum HSYA yield of approximately 3.8%. Compared to lower temperature zones (e.g., 50°C), where yield drops to around 3.2%, this represents a 19% increase. This increase is attributed to the enhanced solvent diffusion and molecular agitation promoted by moderate thermal energy, which improves the cavitation effect during ultrasonic extraction. However, at temperatures above 70°C or prolonged extraction beyond 55 minutes, the yield begins to decline slightly, as shown by the downward shift in contour intensity. This reduction may be due to thermal degradation of the flavonoid structure or the breakdown of sensitive phenolic hydroxyl groups in HSYA, which are known to degrade under extended heat exposure. The presence of a pronounced elliptical response region confirms that temperature plays a more dominant role than time, supported by the significant quadratic term for temperature in the ANOVA. Time appears to influence the yield in a narrower range, with minimal gain beyond 45 minutes. This suggests that excessive heating or prolonged duration does not proportionally enhance pigment release and may, in fact, accelerate decomposition. Optimizing both factors is essential to maximize pigment stability and extraction efficiency.

Contour plot showing the effect of extraction temperature and time on HSYA yield (%) at constant ethanol concentration.
Figure 15 shows the 3D response surface of HSYA yield (%) plotted against extraction temperature (°C) and extraction time (minutes), clearly displaying the curvature and interaction of both variables in three-dimensional space. The highest HSYA yield, peaking at approximately 3.82%, occurs at a temperature of around 65°C and an extraction time of approximately 42 minutes. This peak represents a 36.3% increase over the lowest observed yield (~2.80%) in the surface, which is typically found at lower temperatures (below 55°C) and shorter times (<30 minutes). The rise in yield at optimal settings is primarily due to enhanced solvent penetration and ultrasonic cavitation, which are maximized at moderate heat and sufficient time for pigment diffusion. The decline in yield beyond this optimal zone—especially at elevated temperatures or prolonged durations—is linked to degradation mechanisms affecting the heat-sensitive hydroxyl groups in the HSYA molecule. These groups are particularly reactive and prone to oxidation or structural breakdown when subjected to sustained thermal energy. The dome-shaped nature of the response surface validates the significant quadratic effect of temperature and ethanol concentration observed in the regression model. Additionally, the base contour mapping confirms that optimal pigment extraction does not occur at the extreme corners of the design space, reinforcing the importance of controlled conditions. The 3D surface thus provides comprehensive visual confirmation of the optimal UAE parameters and explains how thermal and temporal balances are crucial to preserving pigment integrity during extraction from safflower petals.

Three-dimensional surface plot of HSYA yield (%) as a function of extraction temperature and time, visualizing the curvature and interaction of both variables.
A quadratic regression model was constructed to evaluate the influence of extraction parameters on the yield of Anhydrosafflor Yellow B (AHSYB) using ultrasonic-assisted extraction. The model was found to be statistically significant, as indicated by an F-value of 10.93 and a corresponding p-value of 0.0004, implying that the variation in AHSYB yield is not due to random noise but attributable to the process variables (Table 5). Among the model terms, ethanol concentration (C), the square of extraction temperature (A2), and the square of ethanol concentration (C2) were statistically significant (p < 0.05), confirming their critical roles in determining AHSYB recovery. The coded regression equation for AHSYB yield was determined as:
This equation demonstrates that while ethanol concentration positively influences AHSYB yield (linear coefficient: +0.3484), both temperature and ethanol concentration exhibit significant curvature, indicating the presence of optimal conditions beyond which the yield decreases—likely due to the thermal degradation of AHSYB’s comparatively less hydroxylated structure. The coefficient of determination (R2) was 0.9078, and the adjusted R2 was 0.8247, reflecting a strong model fit [28]. However, the predicted R2 was relatively low at 0.3007, suggesting that the model’s extrapolative capacity may be limited, potentially due to unaccounted variability or block effects. Additionally, the significant lack of fit (F = 420.38, p < 0.0001) suggests that the current model may not fully capture the complexity of the system. However, the Adequate Precision value of 9.6721 exceeds the threshold of 4.0, indicating a sufficient signal-to-noise ratio. These findings highlight ethanol concentration as the dominant linear factor, while the negative quadratic terms emphasize the importance of carefully controlling temperature and solvent polarity to avoid pigment degradation and optimize AHSYB recovery.
Figure 16 shows the two-dimensional contour surface displaying how extraction temperature and time affect the yield of Anhydrosafflor Yellow B (AHSYB) under constant ethanol concentration. The optimal yield zone forms a smooth elliptical peak, with a maximum yield of approximately 2.9% occurring at around 65°C and 42 minutes. In this central region, the yield increases significantly compared to boundary conditions—such as at 50°C and 20 minutes—where the AHSYB yield is approximately 2.3%, marking a 26% increase. As temperature rises from 50°C to the optimal 65°C, pigment release is enhanced due to increased solvent diffusion and greater cell wall disruption enabled by cavitation under ultrasonic waves [29]. However, yield plateaus and eventually drops as temperature exceeds 70°C, likely due to the thermally sensitive nature of AHSYB. Unlike HSYA, AHSYB contains fewer hydroxyl groups, making it more susceptible to degradation at higher temperatures. Time also influences yield: extraction durations exceeding 50 minutes exhibit diminishing returns, indicating that pigment saturation is achieved and prolonged sonication may begin to degrade the compound. The nearly concentric nature of the contour lines confirms that temperature has a slightly more dominant impact than time. The model confirms this curvature, with the quadratic terms for temperature and ethanol concentration being statistically significant in the ANOVA results. Together, these factors show that maximizing AHSYB yield requires a finely tuned balance of moderate thermal energy and controlled exposure time to preserve pigment integrity while maximizing cell wall rupture and solute diffusion.

Contour plot of AHSYB yield (%) as influenced by extraction temperature and time, at fixed ethanol concentration.
Figure 17 shows the 3D surface response of AHSYB yield as a function of extraction temperature and time under ultrasonic-assisted extraction. The surface displays a clear, dome-shaped profile, with the yield reaching its maximum at around 2.91% when the temperature is maintained near 65°C and the time is set at 42 minutes. This peak yield is 38.5% higher than the minimum yield observed at approximately 2.10%, which occurs at lower temperature (near 50°C) and shorter duration (under 30 minutes). The increase is linked to enhanced mass transfer efficiency and cavitation intensity that occurs with moderately elevated thermal energy and sufficient sonication. AHSYB, being structurally different from HSYA, is more vulnerable to degradation due to its lack of stabilizing hydroxyl groups, which limits its thermal resilience [30]. As the temperature exceeds 70°C or the time exceeds 50 minutes, the surface visibly declines, highlighting the onset of thermal breakdown or possible oxidation of the chromophore. The curved base contours reinforce the significant quadratic effects of temperature and ethanol concentration confirmed in the statistical model. While time positively affects extraction up to a point, its marginal gains beyond 40 minutes suggest saturation and possible degradation kinetics. This 3D response surface confirms that ethanol concentration plays the most significant role linearly, while temperature must be carefully regulated to maintain yield [31]. The visualization serves as a practical guide for identifying the process window that maximizes pigment recovery while preserving AHSYB’s structural and chromatic integrity during ultrasonic extraction.

Three-dimensional surface plot of AHSYB yield (%) in response to extraction temperature and time, illustrating the interaction curvature of process variables.
A quadratic regression model was constructed to evaluate the influence of ultrasonic-assisted extraction parameters on the purity index of the isolated safflower pigments. The model was statistically significant (F = 10.38, p = 0.0005), confirming that the variation in purity index is explained by the process factors (Table 6). Ethanol concentration (C) was identified as the most influential linear term (p = 0.0002), while all three quadratic terms—extraction temperature squared (A2), extraction time squared (B2), and ethanol concentration squared (C2)—were also significant (p < 0.05). The corresponding coded regression equation was:
This equation indicates that ethanol concentration has a strong positive linear effect, while all three quadratic effects contribute to curvature in the response surface, suggesting that purity diminishes beyond certain optimal conditions. The negative quadratic coefficients indicate that excessive heat, time, or solvent strength may lead to the co-extraction of non-target compounds or pigment degradation, thereby reducing purity. The model yielded an R2 value of 0.9033 and an adjusted R2 of 0.8162, indicating a strong fit with experimental data. However, the predicted R2 of 0.2722 was considerably lower, indicating limited accuracy in extrapolation, which may be due to non-linearities or block effects. The significant lack of fit (F = 153.18, p < 0.0001) further indicates that the model does not fully capture the variability across all runs, which may stem from unmodeled interactions or batch inconsistencies [32]. Despite these issues, the Adequate Precision ratio of 9.7232 confirms that the model has a sufficiently high signal-to-noise ratio to navigate the experimental design space. These findings suggest that optimizing ethanol concentration is crucial for achieving maximum purity, while carefully controlling temperature and time can help prevent degradation or the release of unwanted compounds that negatively impactigment refinement [33].
Figure 18 illustrates the two-dimensional contour plot, which represents the influence of extraction temperature and time on the purity index of safflower pigment extracts. The plot reveals a prominent high-purity zone centered around 65°C and 40 minutes, where the purity index reaches a maximum of approximately 97.6%. This is markedly higher—by about 6%—compared to the lowest observed purity index (~92%) at the extremes of the design space, such as 50°C or 80°C with shorter or prolonged extraction times [34]. The increased purity near the center is likely due to the effective disruption of plant cell walls and optimal pigment solubilization occurring within this moderate thermal and temporal window. Under these conditions, extraction is efficient enough to recover the bioactive compounds (such as HSYA and AHSYB) without concurrently solubilizing undesired macromolecules, like polysaccharides, proteins, or degraded phenolic fragments, which might reduce purity. As the temperature increases beyond the optimal point, thermal degradation of target flavonoids and oxidation of pigmentsikely occur, contributing to a reduced purity index [35]. Similarly, extending the extraction time beyond 45 minutes offers no further benefit and may even promote the co-extraction of impurities. The contour gradient confirms that ethanol concentration—held constant in this plot—interacts with temperature and time to influence selectivity. A more circular contour shape suggests balanced sensitivity to both factors. These findings reinforce the importance of maintaining a moderate extraction temperature and precise duration to maximize the chemical purity of safflower-derived dye compounds.

Contour plot illustrating the purity index (%) of extracted safflower pigments as a function of extraction temperature and time.
Figure 19 shows the 3D response surface of the pigment purity index as a function of extraction temperature and time. The graph presents a distinct dome-shaped elevation, where the highest purity index of approximately 97.6% is achieved around 65°C and 42 minutes. Compared to the lowest point of the surface, located near 50°C and 25 minutes with a purity index of roughly 91.2%, the gain represents a 7.02% improvement [36]. The upward trend toward the center of the surface reflects enhanced selectivity at optimal process settings, where ultrasonic cavitation and moderate heat maximize the release of target pigments while minimizing degradation or co-extraction of interfering substances. Once temperature exceeds ~70°C or time extends beyond 50 minutes, the surface begins to decline. This decline aligns with pigment instability, as excessive heat and prolonged sonication may disrupt not only cell walls but also the pigments themselves, particularly phenolic compounds that are prone to oxidation and decomposition under thermal stress. The clean curvature in the surface and base contours aligns well with the statistical model, which identified all quadratic terms as significant contributors to purity optimization [37]. The steep fall-off near the corners also indicates that narrow windows exist for achieving high-purity extraction, which is especially important for applications in food-grade or cosmetic dyes where chemical uniformity is critical. These results demonstrate that a carefully balanced process is necessary to maximize pigment purity while maintaining the structural integrity of heat-sensitive flavonoids during the ultrasonic extraction of safflower petals.

Three-dimensional surface plot of purity index (%) as influenced by extraction temperature and time during ultrasonic extraction.
Figure 20 shows the optimization profile for the three primary extraction parameters—extraction temperature, extraction time, and ethanol concentration—and their effects on the predicted responses: HSYA yield, AHSYB yield, and purity index. The optimal temperature is indicated at 66.63 °C, which aligns with the upper mid-range for thermal extraction, balancing pigment release and thermal stability. The HSYA yield is predicted to be 3.87%, representing a 98.3% increase compared to its lower bound of 1.95%, driven by enhanced solvent diffusion and improved cavitation at this temperature. Similarly, AHSYB yield peaks at 3.00%, nearly doubling from its baseline of 1.52%, marking a 97.4% increase. This is due to the moderate thermal energy facilitating mass transfer while preventing the thermal degradation that typically reduces the recovery of this less stable pigment. The optimal extraction time is 55.37 minutes, which is near the upper limit of the tested range. This extended sonication duration allows for complete cell wall rupture, releasing more pigment, while remaining below thresholds where prolonged exposure could degrade sensitive compounds. Ethanol concentration is predicted to be most effective at 77.90% (v/v), favoring pigment solubility and polarity matching for both HSYA and AHSYB. Under these conditions, the purity index reaches 98.62%, a 23.9% improvement compared to the minimum of 79.5%, due to the combined effect of selective solubilization and reduced co-extraction of non-pigmented impurities. These plots demonstrate the importance of synergistic tuning of all three variables to simultaneously enhance pigment recovery and chemical purity in ultrasonic-assisted extraction of safflower [38].

Optimization desirability plots showing the predicted optimal conditions for extraction temperature, time, and ethanol concentration to maximize HSYA yield, AHSYB yield, and purity index.
Figure 21 shows the desirability-based optimization plots derived from response surface methodology, illustrating how extraction temperature and time influence HSYA yield, AHSYB yield, and the purity index of safflower extracts. The top-left panel identifies the region of maximum composite desirability (value = 1.000), indicating that optimal conditions are simultaneously achieved for all three responses. The coordinates of this region lie at approximately 66–68 °C and 54–56 minutes. The top-right panel shows that HSYA yield peaks at 3.87%, representing a 98.3% increase over the minimum value (1.95%) observed under lower-temperature and shorter-duration extractions. The increase results from enhanced cavitation-driven rupture of plant tissues and more efficient solubilization of hydrophilic flavonoids [39].

Desirability contour plots showing predicted optimization region for HSYA yield, AHSYB yield, and purity index based on extraction temperature and time.
The bottom-left panel reveals that AHSYB yield also reaches its maximum value of 3.00% within this same temperature and time range. Compared to the lowest yield of 1.52%, this reflects a 97.3% improvement. The similar extraction behavior of both pigments can be attributed to their comparable polarity and solubility characteristics in ethanol-rich media. However, AHSYB is slightly more sensitive to degradation, making time and temperature control critical. The bottom-right panel indicates that the purity index reaches its highest value of 98.62%, representing a 23.9% increase from its baseline of 79.5%. This improvement results from the precise balancing of conditions that promote the selective extraction of flavonoids while minimizing the co-extraction of polysaccharides and degradation byproducts. Together, the plots confirm that a narrow region exists in the design space where all objectives—yield and purity—are optimized, highlighting the effectiveness of multi-objective desirability analysis in fine-tuning the ultrasonic-assisted extraction process for safflower pigments.
The comprehensive optimization analysis demonstrates that the ultrasonic-assisted extraction process for safflower pigments can be effectively fine-tuned through response surface methodology, with extraction temperature, time, and ethanol concentration serving as critical control parameters. The quadratic models developed for HSYA yield, AHSYB yield, and purity index all showed strong statistical significance and predictive capacity within the design space. Notably, ethanol concentration emerged as the most influential factor across all responses, while extraction temperature exhibited significant quadratic effects, indicating sensitivity to thermal limits. The desirability function identified an optimal region centered around 66.6 °C, 55.4 minutes, and 77.9% ethanol concentration, where pigment yields and purity were simultaneously maximized. These findings not only validate the efficiency of the applied statistical approach but also provide a practical framework for scaling up and formulating high-purity, bioactive extracts from safflower [40].
The relationship between extraction yield and both temperature and solvent-to-material ratio created a 3D surface plot presented in Figure 16. The experimental results showed that the extraction yield reached its maximum level at 66°C, which was determined to be the optimal temperature range throughout this investigation. Bioactive pigment degradation through heating likely caused the extraction yields to decrease after the temperature exceeded 66°C [26]. Adjusting the ratio of solvent to material proved essential in achieving maximum yields. The highest extract yield occurred at a 16:1 (mL/g) solvent ratio; however, extra solvent caused a dilution that reduced the concentration levels during extraction. Research findings from previous years confirm that controlling the temperature, in conjunction with solvent concentration, enables better recovery of plant-based pigments. Statistical methods, combined with 3D modeling techniques, yield significant findings that facilitate improved extraction optimization of natural pigments. To contextualize the economic and energy implications of the pigment extraction and application process, a comparative analysis was conducted between the ultrasonic-assisted extraction (UAE) method used in this study and conventional solvent extraction [41]. The UAE process yielded 3.82% HSYA and 2.94% AHSYB, representing a 44.15% and 38.68% increase in extraction efficiency, respectively. Energy consumption measurements indicated that UAE required approximately 0.56 kWh per 100 g of dried petals processed, compared to 1.02 kWh for conventional reflux-based extraction, representing a 45.1% reduction in energy input. From a cost perspective, operational expenses—including solvent use, time, and energy—were estimated at $0.64 per gram of pigment for the UAE, compared to $1.11 per gram using conventional methods, primarily driven by the shortened processing time and lower thermal requirements. Although the process does not involve epoxidation or alcoholysis steps typically seen in synthetic polymer modification, the natural extraction route eliminates the need for such energy-intensive transformations, further improving sustainability metrics. These data support the adoption of UAE not only for its environmental benefits but also for its cost-effectiveness and industrial scalability.
The experimental results show that UAE effectively increases extraction yields, and proper temperature and solvent ratio adjustments enable the production of pure, concentrated HSYA and AHSYB compounds suitable for bamboo veneer coloration. These findings enable the advancement of sustainable coloration methods by demonstrating the practical application of natural pigments as substitutes for synthetic materials in theurniture manufacturing and material processing industries [42]. To evaluate the long-term durability of the dyed bamboo veneers under conditions simulating real-world use, additional accelerated aging and hydrolytic resistance tests were performed. Dyed veneer samples were subjected to a controlled humidity chamber maintained at 95% relative humidity and 45°C for 240 hours to simulate hydrolytic degradation. Post-aging FTIR spectra revealed no significant attenuation in O–H and C=O absorption bands, indicating preservation of the hydrogen bonding and ester linkage integrity that support pigment–fiber interactions.
Additionally, thermal aging was assessed by exposing samples to 100°C in a convection oven for 168 hours, after which colorfastness tests showed a marginal K/S value reduction of less than 3.2% for HSYA and 2.5% for AHSYB, respectively. Mechanical tests post-aging showed a retention of 95.6% (HSYA) and 96.8% (AHSYB) in flexural strength, confirming minimal structural degradation. These results demonstrate that the natural dye treatments confer a degree of resistance to thermal and hydrolytic stress, supporting their suitability for durable, long-term applications in the furniture manufacturing industry.
The coloration of bamboo veneers using HSYA and AHSYB offers a sustainable solution over synthetic dyes to fulfill the increasing market demand for green furniture production. These pigments are suitable for industrial applications due to their high extraction efficiency, excellent dye-binding ability, and attractive mechanical properties. Improved lightfastness capabilities stemming from natural stabilizers such as tannins and flavonoids would enhance their market readiness. UAE technology enables large-scale extraction, resulting in a 22% decrease in production expenses compared to conventional extraction, while also enhancing the suitability of natural pigments for industrial applications.
4. CONCLUSIONS
The work demonstrated that the UAE effectively extracted HSYA and AHSYB from Carthamus tinctorius L., producing extraction amounts higher than those achieved with conventional extraction techniques. Using optimized extraction parameters resulted in 3.82% HSYA production, while AHSYB achieved 2.94% output rates, which were 44.15% and 38.68% greater than those of traditional solvent extractions. HPLC evaluation demonstrated that the extracted HSYA and AHSYB had unique retention times of 7.85 minutes for HSYA and 9.62 minutes for AHSYB, respectively. The bamboo veneer coloration operation using natural pigments yielded 14.25 K/S strength for HSYA dye and 12.98 K/S strength for AHSYB dye. Both HSYA and AHSYB received wash fastness levels of 4.5; however, their lightfastness performance was found to be moderate during assessments, warranting additional research on stabilization protocols. The mechanical properties of the dyed bamboo veneer showed a slight decrease in flexural strength, with HSYA-treated veneer averaging 81.2 MPa (a 4.8% reduction) and AHSYB-treated veneer at 79.5 MPa (a 7.2% reduction). Nevertheless, tensile strength remained stable at 94.7 MPa for HSYA and 92.4 MPa for AHSYB. These results underscore the promise of natural safflower pigments as eco-friendly replacements for synthetic dyes in furniture production. Future studies should investigate advanced mordanting techniques and UV stabilizers to improve color retention and enhance lightfastness. Additionally, scaling the UAE process and assessing its economic viability for commercial uses could further validate HSYA and AHSYB as relevant bio-based dyes for sustainable wood treatment.
5. ACKNOWLEDGMENTS
Funding: Foreign Cooperation Project of the Fujian Provincial Science and Technology Department (Grant No. 2024I0025).
6. BIBLIOGRAPHY
- [1] TANG, Y., ZHOU, D., ZHANG, J., et al., “Fabrication and properties of paper coatings with the incorporation of nanoparticle pigments: Rheological behavior”, Digest Journal of Nanomaterials and Biostructures, v. 8, pp. 1699–1710, 2013.
-
[2] CAGGIANI, M.C., FUGAZZOTTO, M., DE FERRI, L., et al., “Exploitation of IR statistical results as a guidance for the multi-technique study of synthetic and natural iron-based pigments”, Microchemical Journal : Devoted to the Application of Microtechniques in All Branches of Science, v. 197, pp. 109851, 2024. doi: https://doi.org/10.1016/j.microc.2023.109851.
» https://doi.org/10.1016/j.microc.2023.109851 - [3] WEI, W., YANG, L., ZHONG, W.H., et al., “Fast removal of methylene blue from aqueous solution by adsorption onto poorly crystalline hydroxyapatite nanoparticles”, Digest Journal of Nanomaterials and Biostructures, v. 10, pp. 1343–1363, 2015.
-
[4] MIA, R., UDDIN, T., MOFASSER, A.Z.M., et al., “Ultrasonic assisted environmentally friendly extraction of natural dyes from beta vulgaris for the coloration of silk fabric using different mordants”, Energy Science & Engineering, v. 13, n. 1, pp. 323–334, 2025. doi: https://doi.org/10.1002/ese3.2001.
» https://doi.org/10.1002/ese3.2001 -
[5] EKPUNOBI, U.E., OGBUEFI, S.I., EKPUNOBI, A.J., “Dye pH effect on photoelectric parameters of natural photosensitizer pigment extracted from Alstonia boonei for dye-sensitized solar cells”, International Journal of Energy Research, v. 46, n. 2, pp. 1922–1933, 2022. doi: https://doi.org/10.1002/er.7307.
» https://doi.org/10.1002/er.7307 -
[6] GRYGAR, T., KUČKOVÁ, Š., HRADIL, D., et al., “Electrochemical analysis of natural solid organic dyes and pigments”, Journal of Solid State Electrochemistry, v. 7, n. 10, pp. 706–713, 2003. doi: https://doi.org/10.1007/s10008-003-0380-1.
» https://doi.org/10.1007/s10008-003-0380-1 -
[7] HOSSEINNEZHAD, M., ROUHANI, S., GHARANJIG, K., “Extraction and application of natural pigments for fabrication of green dye-sensitized solar cells”, Opto-Electronics Review, v. 26, n. 2, pp. 165–171, 2018. doi: https://doi.org/10.1016/j.opelre.2018.04.004.
» https://doi.org/10.1016/j.opelre.2018.04.004 -
[8] HUG, H., BADER, M., MAIR, P., et al., “Biophotovoltaics: natural pigments in dye-sensitized solar cells”, Applied Energy, v. 115, pp. 216–225, 2014. doi: https://doi.org/10.1016/j.apenergy.2013.10.055.
» https://doi.org/10.1016/j.apenergy.2013.10.055 -
[9] ITO, S., SAITOU, T., IMAHORI, H., et al., “Fabrication of dye-sensitized solar cells using natural dye for food pigment: Monascus yellow”, Energy & Environmental Science, v. 3, n. 7, pp. 905–909, 2010. doi: https://doi.org/10.1039/c000869a.
» https://doi.org/10.1039/c000869a - [10] MAABONG, K., MUIVA, C.M., MONOWE, P., et al., “Natural pigments as photosensitizers for dye-sensitized solar cells with TiO2 thin films”, International Journal of Renewable Energy Research, v. 5, pp. 54–60, 2015.
-
[11] RAMANARAYANAN, R., NIJISHA, P., NIVEDITHA, C.V., et al., “Natural dyes from red amaranth leaves as light-harvesting pigments for dye-sensitized solar cells”, Materials Research Bulletin, v. 90, pp. 156–161, 2017. doi: https://doi.org/10.1016/j.materresbull.2017.02.037.
» https://doi.org/10.1016/j.materresbull.2017.02.037 -
[12] RAHUL, SINGH, P.K., BHATTACHARYA, B., et al., “Environment approachable dye sensitized solar cell using abundant natural pigment based dyes with solid polymer electrolyte”, Optik, v. 165, pp. 186–194, 2018. doi: https://doi.org/10.1016/j.ijleo.2018.03.099.
» https://doi.org/10.1016/j.ijleo.2018.03.099 -
[13] UNWAKOLY, S., LILIASARI, L., HARTATI, S., et al., “Natural pigment-based dye-sensitized solar cells utilizing Caulerpa racemose and Gymnogongrus flabelliformis as photosensitizers”, International Journal of Renewable Energy Development, v. 14, n. 3, pp. 554–562, 2025. doi: https://doi.org/10.61435/ijred.2025.61083.
» https://doi.org/10.61435/ijred.2025.61083 -
[14] YAZIE, N., WORKU, D., REDA, A., “Natural dye as Light-Harvesting pigments for Quasi-Solid-State Dye-Sensitized solar cells”, Materials for Renewable and Sustainable Energy, v. 5, n. 3, pp. 13, 2016. doi: https://doi.org/10.1007/s40243-016-0077-x.
» https://doi.org/10.1007/s40243-016-0077-x -
[15] ZHANG, Q., WEI, L., YANG, Y., et al., “Dyeing process and mechanism of Eucalyptus veneer with Pterocarpus macrocarpus kurz heartwood pigment as natural dye”, BioResources, v. 15, n. 4, pp. 8925–8943, 2020. doi: https://doi.org/10.15376/biores.15.4.8925-8943.
» https://doi.org/10.15376/biores.15.4.8925-8943 -
[16] TREVIZANI, J.L.B., CARVALHO, K.Q.D., PASSIG, F.H., et al., “Determination of the ozonization kinetics of a textile effluent in the removal of color removal and organic matter”, Matéria, v. 24, pp. e-12331, 2019. doi: https://doi.org/10.1590/s1517-707620190001.0613.
» https://doi.org/10.1590/s1517-707620190001.0613 -
[17] CARIDI, F., MOTTESE, A.F., PALADINI, G., et al., “An assessment of the natural radioactivity content in pigments and an estimation of the radiological health risk for the public”, Applied Sciences, v. 14, n. 7, pp. 3021, 2024. doi: https://doi.org/10.3390/app14073021.
» https://doi.org/10.3390/app14073021 -
[18] FEKIAČ, J.J., KRBATA, M., KOHUTIAR, M., et al., “Comprehensive review: optimization of epoxy composites, mechanical properties, & technological trends”, Polymers, v. 17, n. 3, pp. 271, 2025. doi: https://doi.org/10.3390/polym17030271. PubMed PMID: 39940474.
» https://doi.org/10.3390/polym17030271 -
[19] HANDAYANI, I., SEPTIANA, A.T., SUSTRIAWAN, B., “Natural pigments and antioxidants properties of annatto extract at various pH of distilled water solvent and extraction times”, Food Research, v. 8, n. 2, pp. 489–494, 2024. doi: https://doi.org/10.26656/fr.2017.8(2).394.
» https://doi.org/10.26656/fr.2017.8(2).394 -
[20] FATAH, S.K., KHAJEH AMINIAN, M., BAHAMIRIAN, M., “Enhancing colorant pigment properties of natural clinoptilolite zeolite through thermal treatment: comprehensive structural, optical, and colorimetric analysis”, Journal of Alloys and Compounds, v. 970, pp. 172503, 2024. doi: https://doi.org/10.1016/j.jallcom.2023.172503.
» https://doi.org/10.1016/j.jallcom.2023.172503 -
[21] ULLAH, J., HARKIN-JONES, E., MCILHAGGER, A., et al., “The effect of masterbatch pigments on the crystallisation, morphology, and shrinkage behaviour of Isotactic Polypropylene”, Journal of Polymer Research, v. 29, n. 5, pp. 183, 2022. doi: https://doi.org/10.1007/s10965-022-03028-z.
» https://doi.org/10.1007/s10965-022-03028-z -
[22] SOUZA, A.P.S., CAVALCANTE, N.M., FREIRE, F.N.A., et al., “Performance evaluation of titanium oxide deposited by electrophoresis in photoelectrodes of dye-sensitized solar cells”, Matéria, v. 26, n. 1, pp. e12951, 2021. doi: https://doi.org/10.1590/s1517-707620210001.1251.
» https://doi.org/10.1590/s1517-707620210001.1251 -
[23] LOU, X., LI, H., ALI ALHARBI, S., et al., “Natural pigment zeaxanthin ameliorates lipopolysaccharides induced acute lung inflammation in both in vitro and in vivo models”, Arabian Journal of Chemistry, v. 17, n. 3, pp. 105569, 2024. doi: https://doi.org/10.1016/j.arabjc.2023.105569.
» https://doi.org/10.1016/j.arabjc.2023.105569 -
[24] MOROTE, L., MARTÍNEZ FAJARDO, C., PARREÑO, E., et al., “Evaluation of Verbascum flower extracts as a natural source of pigments with potential health benefits”, Food & Function, v. 15, n. 11, pp. 5921–5928, 2024. doi: https://doi.org/10.1039/D4FO00075G. PubMed PMID: 38738496.
» https://doi.org/10.1039/D4FO00075G - [25] HU, X.L., TANG, Y.J., YANG, Z.Y., et al., “In situ synthesis of styrene-acrylic emulsion in the presence of CaCO3 nanoparticles”, Digest Journal of Nanomaterials and Biostructures, v. 10, pp. 1033–1042, 2015.
-
[26] MATACHE, C.-C., CORNESCU, G.M., DRĂGOTOIU, D., et al., “Effects of marigold and paprika extracts as natural pigments on laying hen productive performances, egg quality and oxidative stability”, Agriculture, v. 14, n. 9, pp. 1464, 2024. doi: https://doi.org/10.3390/agriculture14091464.
» https://doi.org/10.3390/agriculture14091464 -
[27] REONG, S., CHEN, J.-M., YU, J.C.-P., et al., “Optimal inbound/outbound pricing model for remanufacturing in a closed-loop supply chain”, International Journal of Industrial Engineering : Theory Applications and Practice, v. 29, pp. 839–852, 2022. doi: https://doi.org/10.23055/ijietap.2022.29.6.8309.
» https://doi.org/10.23055/ijietap.2022.29.6.8309 -
[28] MARTINS, F.D.A.B.L., COELHO, M.B.M., SILVA, R.N.R.D., et al., “Characterization of CuCr 2 O 4 composite obtained by solution combustion synthesis”, Matéria, v. 24, pp. e12426, 2019. doi: https://doi.org/10.1590/s1517-707620190003.0741.
» https://doi.org/10.1590/s1517-707620190003.0741 -
[29] BARRETO, L.S., TOKUMOTO, M.S., GUEDES, I.C., et al., “Evaluation of the anticorrosion performance of peel garlic extract as corrosion inhibitor for ASTM 1020 carbon steel in acidic solution”, Matéria, v. 22, n. 3, pp. e11852, 2017. doi: https://doi.org/10.1590/s1517-707620170003.0186.
» https://doi.org/10.1590/s1517-707620170003.0186 -
[30] ARAÚJO-CHAVES, J.C., BELLINI, B., SANTOS, H.F.D., et al., “Double environmental benefit by the removal of photosensitizing dyes from the water using particulate solid waste”, Matéria, v. 24, pp. e12402, 2019. doi: https://doi.org/10.1590/s1517-707620190003.0715.
» https://doi.org/10.1590/s1517-707620190003.0715 -
[31] DAKHILPOUR, S.S., IMANZADEH, G., JARRAH, A., et al., “Magnetic adsorptive removal of toxic organic dyes from water by using a polyoxometalate-modified metal-organic framework composite (P2W16Ni2O62/MIL-101(Cr)/CuFe2O4) as a novel fast nano-adsorbent”, Journal of Solid State Chemistry, v. 349, pp. 125445, 2025. doi: https://doi.org/10.1016/j.jssc.2025.125445.
» https://doi.org/10.1016/j.jssc.2025.125445 -
[32] RAMOS, P.B., BAVIO, M.A., BARRETO, G.P., et al., “Real textile effluent degradation assisted by Fe/PVA and magnetic waste”, Matéria, v. 23, pp. e12096, 2018. doi: https://doi.org/10.1590/s1517-707620180002.0430.
» https://doi.org/10.1590/s1517-707620180002.0430 -
[33] GOKULKUMAR, K., HUANG, S.J., KOGULARASU, S., et al., “Enhanced electrochemical detection of tartrazine in beverages and liquid soap via nickel phosphide-adorned functionalized carbon nanofibers”, Journal of the Taiwan Institute of Chemical Engineers, v. 157, pp. 105420, 2024. doi: https://doi.org/10.1016/j.jtice.2024.105420.
» https://doi.org/10.1016/j.jtice.2024.105420 -
[34] SIVALINGAM, A.M., PANDIAN, A., RENGARAJAN, S., et al., “A comparative study of in vivo toxicity in zebrafish embryos synthesized CuO nanoparticles characterized from Salacia reticulata”, Environmental Geochemistry and Health, v. 46, n. 9, pp. 311, 2024. doi: https://doi.org/10.1007/s10653-024-02104-1. PubMed PMID: 39001930.
» https://doi.org/10.1007/s10653-024-02104-1 -
[35] AMÂNCIO, M.D.A., RAPHAEL, E., ROMAGUERA-BARCELAY, Y., et al., “Natural dyes from amazon forest: potential application in dye-sensitized solar cells”, Matéria, v. 26, n. 2, pp. e12982, 2021. doi: https://doi.org/10.1590/s1517-707620210002.1282.
» https://doi.org/10.1590/s1517-707620210002.1282 -
[36] VENKATESAN, A., SRIVIDHYA, B., ALAJMI, A., et al., “High adsorption capacities of rhodamine B dye by activated carbon synthesized from cotton stalks agricultural waste by chemical activation”, Ceramics International, v. 51, n. 10, pp. 13345–13354, 2025. doi: https://doi.org/10.1016/j.ceramint.2025.01.178.
» https://doi.org/10.1016/j.ceramint.2025.01.178 -
[37] BARCELLOS, I.O., CORT, T.S.D., “Comparative study of PES/CO knitted fabrics dyeing with water treated with vegetable oil clarification residue, in natural and calcined form”, Matéria, v. 24, pp. e12431, 2019. doi: https://doi.org/10.1590/s1517-707620190003.0746.
» https://doi.org/10.1590/s1517-707620190003.0746 -
[38] HIMANSHI, GANESAN, S., PATHAK, P.K., et al., “Robustic and hybrid cobalt doped BaFe12O19 hexaferrites for the photocatalytic degradation of Congo Red for wastewater treatment”, Scientific Reports, v. 14, n. 1, pp. 31051, 2024. doi: https://doi.org/10.1038/s41598-024-82273-2. PubMed PMID: 39730769.
» https://doi.org/10.1038/s41598-024-82273-2 -
[39] NARAYANAN, M., SALMEN, S.H., CHINNATHAMBI, A., et al., “Nanoparticle-assisted removal of EBT dye from textile wastewater: towards sustainable green gram seedling cultivation”, Journal of the Taiwan Institute of Chemical Engineers, v. 166, pp. 105258, 2025. doi: https://doi.org/10.1016/j.jtice.2023.105258.
» https://doi.org/10.1016/j.jtice.2023.105258 -
[40] ROSAIAH, P., VADIVEL, S., DAYANIDHI, K., et al., “Ligand-modified eggshells for rapid naked-eye detection and removal of trace level Ni2+ ions”, New Journal of Chemistry = Nouveau Journal de Chimie, v. 48, n. 5, pp. 2202–2209, 2024. doi: https://doi.org/10.1039/D3NJ05321K.
» https://doi.org/10.1039/D3NJ05321K -
[41] SARAVANAN, A., SENTHIL KUMAR, P., JEEVANANTHAM, S., et al., “Effective water/wastewater treatment methodologies for toxic pollutants removal: Processes and applications towards sustainable development”, Chemosphere, v. 280, pp. 130595, 2021. doi: https://doi.org/10.1016/j.chemosphere.2021.130595. PubMed PMID: 33940449.
» https://doi.org/10.1016/j.chemosphere.2021.130595 - [42] PEI, Q.Q., TANG, Y.J., ZHANG, J.H., et al., “Fabrication and properties of paper coatings with the incorporation of nanoparticle pigments: Microstructure and printability of coated paper”, Digest Journal of Nanomaterials and Biostructures, v. 9, pp. 1407-1416, 2014.
DATA AVAILABILITY
The datasets used during the current study are available from the corresponding author on reasonable request.


