 Synergistic anti-cancer effects of metformin and cisplatin on YD-9 oral squamous carcinoma cells via AMPK pathway
Abstract
Objective This study evaluated whether hypoglycemic drug metformin enhances the anti-cancer effects of cisplatin in YD-9 cells.
Methodology YD-9 cells, derived from oral mucosal squamous cell carcinoma of oral mucosa, were used to assess the combined effects of metformin and cisplatin by means of MTT assay, live and dead cell staining, and colony formation assays to evaluate cell viability and proliferation. Reactive oxygen species level was measured using a Muse cell analyzer. Apoptosis, epithelial-mesenchymal transition, and related molecular pathways were analyzed by western blot. Wound healing assays and Transwell migration assays examined cell migration, whereas monophosphate-activated protein kinase inhibitor Compound C, was utilized to investigate the AMPK pathway.
Results Sequential treatment of YD-9 cells with metformin and cisplatin resulted in decreased cell viability and proliferation, increased ROS levels, and elevated apoptosis compared with the individual drugs. Moreover, the treatment inhibited EMT, wound healing, and cell migration. These results correlated with increased AMPK phosphorylation, a key regulator of cellular energy homeostasis. Introduction of Compound C pre-treatment upregulated N-cadherin and α-smooth muscle actin along with enhanced cell migration.
Conclusion This study found synergism in anti-cancer effects between metformin and cisplatin. Additionally, introduction of Compound C confirmed that EMT inhibition is AMPK dependent. These findings indicate the potential use of metformin as an adjunct drug in anti-cancer treatments, warranting further investigation.
Drug therapy; Apoptosis; Reactive oxygen species; Epithelial-mesenchymal transition; Extracellular signal-regulated kinase
Introduction
Oral squamous cell carcinoma (OSCC) represents approximately 90% of all oral cancers, with over 300,000 cases reported globally and a higher prevalence in Asian countries.1,2 It is a locally invasive malignant tumor that arises in the oral cavity, primarily from the oral mucosa, and is a leading cause of cancer-related deaths.3
OSCC treatment includes surgical excision, chemotherapy, radiotherapy, or a combination of these methods. Platinum-derived cisplatin has a long history as an anti-cancer agent;4 however, it requires careful dosing and precise monitoring due to serious adverse effects such as ototoxicity, peripheral neuropathy, and nephropathy. Additionally, drug resistance and recurrence pose significant challenges, emphasizing the need for early detection and precise treatment strategies to improve patient outcomes and survival. Advocacy for limiting the dose and frequency of chemotherapeutic agents may include strategies such as incorporating metformin as an adjuvant. The most commonly prescribed oral hypoglycemic drug for type II diabetes, metformin is widely available, relatively inexpensive, has minimal side effects, and is well-tolerated which has increased interest in its potential in chemotherapy.5 Ongoing pre-clinical and clinical studies have been conducted since the observation of a reduced cancer risk in diabetic patients taking metformin, demonstrating its anti-cancer effects in vitro and in vivo.6 Metformin has proven beneficial in inhibiting cancer growth and progression in various cancers, including pancreatic, melanoma, ovarian, breast, and prostate cancer.7-11 The impact of adding metformin as an adjuvant in anti-cancer regimens against OSCC has not been extensively studied. Consequently, more comprehensive research is needed to assess this strategy in the context of OSCC.
YD-9 is a cell line derived from moderately differentiated OSCC of the oral mucosa.12 The primary objective of this study was to determine whether pre-treatment with metformin enhances the anti-cancer effects of cisplatin on YD-9 cells and to explore its potential action mechanisms and future prospects as an adjuvant in chemotherapy against oral cancer.
Methodology
Cell Culture
Two cell lines were used in this study: YD-9 and HOK-16B. OSCC-derived YD-9 cell line was obtained from the Korean Cell Line Bank (Seoul, Korea) and cultured in RPMI cell culture media supplemented with 10% fetal bovine serum (FBS) (Gibco, Grand Island, NY, USA), 100 U/mL penicillin, and 100 U/mL streptomycin (Gibco). HOK-16B is an immortalized human oral keratinocyte cell line which was originally established in the laboratory of Dr. No-Hee Park (University of California Los Angeles, USA).13 HOK-16B was obtained via the laboratory of Dr. Youngnim Choi (Seoul National University School of Dentistry, South Korea) and cultured in Keratinocyte Basal Medium 2 (Promocell, Heidelberg, Germany) supplemented with Keratinocyte Growth Medium 2 SupplementMix (Promocell) and calcium chloride solution (Promocell) to a final concentration of 150 μM. YD-9 and HOK-16B cells were maintained at 37°C in a humidified incubator with 5% CO2.
Antibodies and reagents
Different antibodies against cleaved caspase-3 (#9661), caspase 9 (#9508), phospho-Akt (#4060), phospho-AMPKα (#2535), p44/42 MAPK (Erk1/2) (#9102), phospho-p44/42 MAPK (pErk1/2) (#4377), E cadherin (#3195), N cadherin (#13116), Phospho-FoxO1 (Thr24)/FoxO3a (Thr32) (#9464), MMP-2 (#13132), Phospho-mTOR (#2976), Phospho-p53 (#9284), anti-rabbit IgG (#7074), and anti-mouse IgG (#7076) were obtained from Cell Signaling Technology, Inc. (Beverly, MA, USA). Antibodies against AMPK1 (BS1009), Bcl-2 (BS1511), GAPDH (AP0066), β-actin (AP0060), and tubulin α (BS1699) were acquired from Bioworld Technology (Louis Park, MN, USA). Antibodies against cytochrome c (sc-13156), p53 (sc-98), and Bax (sc-7480) were procured from Santa Cruz Biotechnology (Santa Cruz, CA, USA). Antibody against VDAC-1/Porin (ab15895) and Anti-alpha smooth muscle Actin (α SMA) (ab5694) were sourced from Abcam (Cambridge, Cambridgeshire, UK). Cisplatin was acquired from Ildong Pharmaceutical Co. (Seongnam-si, Gyeonggi-do, South Korea). Metformin, Compound C (6-[4-(2-Piperidin-1-ylethoxy)-phenyl]-3-pyridin-4-yl-pyrazolo[1,5-a]-pyrimidine) was purchased from Merck EMD (Millipore Corp., Burlington, MA, USA).
Cell viability
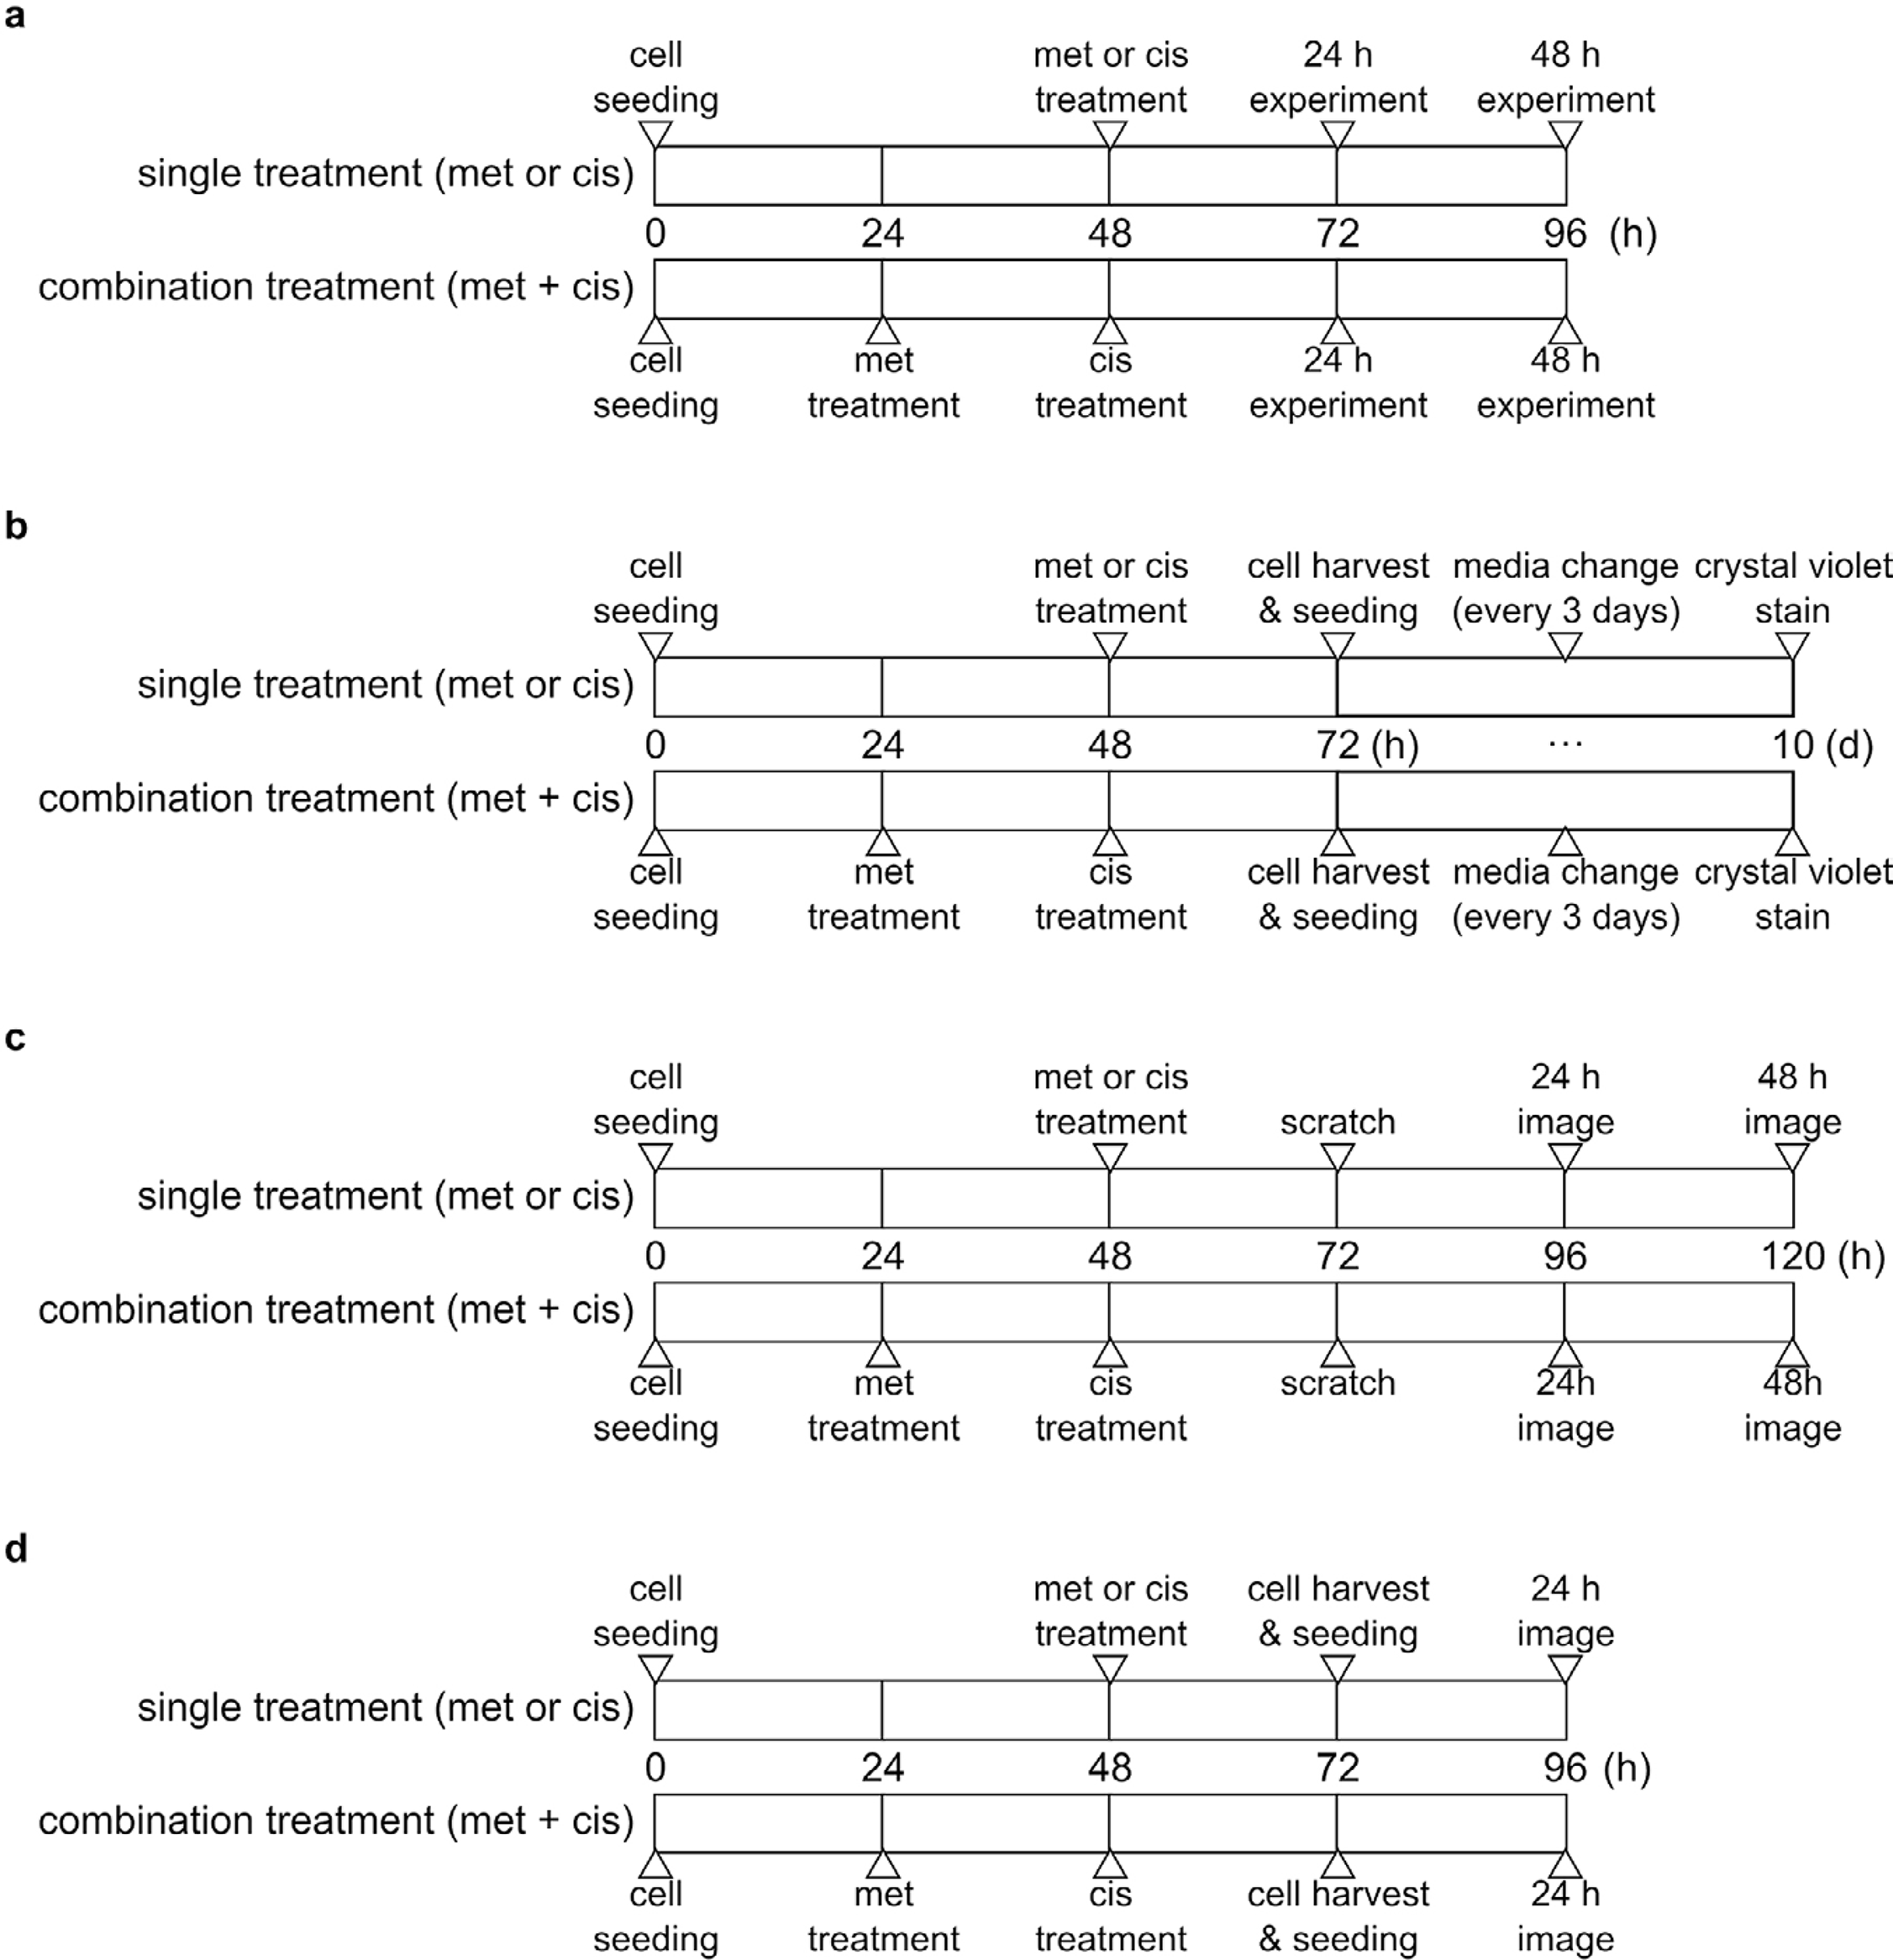
Cell viability was determined by MTT [3-(4,5-Dimethylthiazol-2-yl)-2,5-Diphenyltetrazolium Bromide] assay. YD-9 cells were seeded in 24 well culture plates at a density of 1 × 10⁵cells per well. For the single treatment of metformin or cisplatin, media was changed after 48 h, and the cells were treated with metformin or cisplatin at the respective indicated concentrations for 24 or 48 h. In the combination group, cells were pre-treated with metformin for 24 hours, followed by 24 or 48 h of cisplatin treatment. Subsequently, MTT reagent (5 mg/mL) mixed in fresh culture media was added to the respective wells and incubated for 3 hours at 37°C. The media was then removed, and the Formazan crystals that formed were dissolved in DMSO. Absorbance was measured at 570 nm using an Enzyme Linked Immunosorbent Assay (ELISA) reader (Synergy 2, Biotek, Winooski, VT, USA). Time frame of the experimental procedure is depicted in Fig 1a. To determine and quantify the synergism between metformin and cisplatin, Chou-Talalay method was employed14 using CompuSyn software (ComboSyn, Paramus, NJ, USA).
Live and dead cell staining
For live and dead cell staining, YD-9 cells were seeded in 12-well cell culture plates. For the single treatment of metformin or cisplatin, media was changed after 48 h, and the cells were treated with metformin or cisplatin for 24 or 48 h. In the combination group, cells were pre-treated with metformin for 24 hours, followed by 24 or 48 h of cisplatin treatment. Time frame of the experimental procedure is described in Figure 1a. A LIVE/DEAD Viability/Cytotoxicity Assay Kit (Invitrogen, Waltham, MA, USA) was used to stain the live and dead cells according to manufacturer’s instructions. Components A and B were thawed at room temperature (RT), and a working solution was prepared in 10 mL of phosphate-buffered saline (PBS) with 5 µL of component A and 20 µL of component B. After the specified treatment time, media was removed and cells were washed with 1 × PBS. 200 µL of the staining solution was applied to each well of a 12 well plate, covering the entire surface area, and incubated at 37°C for 20 minutes. The staining solution was then removed and the cells were washed with PBS. To prevent the cells from drying, 200 µL of PBS was added. Immunofluorescent images were captured using a Leica DMi8 fluorescence microscope (Leica Microsystems GmbH, Wetzlar, Hesse, Germany). Resulting fluorescent images were quantified using ImageJ software (National Institutes of Health, Bethesda, MD, USA).
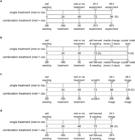
Time frames of conducted experiments. (a) Time frame of MTT assay, live and dead cell stain, ROS detection, and total or mitochondrial protein extraction. (b) Time frame of colony formation assay. (c) Time frame of wound healing assay. (d) Time frame of transwell cell migration assay.
Colony formation assay
For the colony formation assay, YD-9 cells were seeded in 21-cm2 culture plates. For the single treatment of metformin or cisplatin, media was changed after 48 h, and the cells were treated with metformin or cisplatin for 24 h. In the combination group, cells were pre-treated with metformin for 24 hours, followed by 24 h of cisplatin treatment. Afterwards, the cells were detached using 1 × Trypsin-EDTA and counted manually using a hemocytometer. Subsequently, cells were seeded at a density of 2,500 cells per plate in fresh 21-cm2 culture dishes and incubated. The media was changed every 3 days, allowing the cells to grow for 10 days. Throughout this period, the culture was regularly monitored for colony formation under a microscope. The media was then removed and the colonies were washed with 1 × PBS. The cells were fixed with ice cold 100% methanol for 20 minutes, allowed to dry thoroughly, and stained with 0.5% crystal violet (BENEX Limited, Shannon, Ireland) in PBS at RT for 1 hour. After removing the staining solution, the cells were vigorously washed with DDW to eliminate excess stain, allowed to dry completely, and imaged against a white background. Time frame of the experimental procedure is described in Figure 1b.
ROS detection
YD-9 cells were cultured in 21-cm2 cell culture dishes. For the single treatment of metformin or cisplatin, media was changed after 48 h, and the cells were treated with metformin or cisplatin for 24 h. In the combination group, cells were pre-treated with metformin for 24 hours, followed by 24 h of cisplatin treatment. Reactive oxygen species (ROS) generation was subsequently assessed using a Muse Oxidative Stress Kit and a Muse Cell Analyzer (Luminex Corporation, Austin, TX, USA) following manufacturer’s instructions. Time frame of the experimental procedure is described in Figure 1a.
Western blot analysis
After the desired treatment, cell culture was extracted using NETN buffer supplemented with protease and phosphatase inhibitors (Sigma-Aldrich, St. Louis, MA, USA). The cell lysate was vortexed every 5 minutes for 30 minutes and then centrifuged. The supernatant was collected, and protein quantification was performed using the Bradford method; 20 µg of the respective samples were separated on 6-17% sodium dodecyl sulfate polyacrylamide gels under denaturing conditions. The samples were then electroblotted onto nitrocellulose membranes and incubated in 5% non-fat dry milk in tris-buffered saline (TBS) with 0.1% Tween-20 (TBST) for 1 hour at RT. The membranes were then incubated at 4oC overnight with respective primary antibodies (diluted at 1:5000). They were then washed with TBST and subsequently incubated with horseradish peroxidase conjugated secondary antibody for 1 hour at RT. The membranes were developed and visualized using a chemiluminescent detection reagent (Amersham Pharmacia Biotech, Amersham, Buckinghamshire, UK) in a LAS 400 mini (Fuji Film, Minato City, Tokyo, Japan) western blot developing system. β-actin was used to verify equal loading of proteins. ImageJ software was used to quantify the images.
Mitochondrial protein extraction
To determine the cytochrome c release from mitochondria, YD-9 cells were cultured in 21-cm2 culture dishes. After the desired treatment, cells were then harvested, centrifuged for 5 minutes at RT at 300 × g. The supernatant was discarded, and the pellet was washed and resuspended in PBS, then centrifuged at RT for 5 minutes at 450 × g. The pellet obtained was resuspended in 1.5 mL hypertonic buffer (20 mM HEPES, 10 mM KCl, 2 mM MgCl2, 1 mM EDTA) and centrifuged at 4oC for 5 minutes at 300 × g. Then, 100 µL of hypertonic buffer was added to the pellet after discarding the supernatant and stored on ice for 5 minutes. To disrupt the cells, the mixture was pipetted back and forth multiple times using a 1 mL insulin syringe and then centrifuged for 10 minutes at 4oC, 10,000 × g. The supernatant obtained was the cytosolic fraction. The pellet was vortexed with 1 mL of hypertonic buffer and centrifuged for 4 minutes at 4oC, 10,000 × g. After discarding the supernatant, 100 µL NETN lysis buffer supplemented with protease and phosphatase inhibitor was added to the pellet and vortexed every 5 minutes for a total of 30 minutes and centrifuged for 30 minutes at 4oC, 19,300 × g. The supernatant was collected as the mitochondrial fraction. After protein quantification, it was subjected to western blotting.
Wound healing assay
YD-9 cells were seeded in a 12-well culture plate and incubated. For the single treatment of metformin or cisplatin, media was changed after 48 h, and the cells were treated with metformin or cisplatin for 24 h. In the combination group, cells were pre-treated with metformin for 24 hours, followed by 24 h of cisplatin treatment. Subsequently, a vertical scratch wound was created using a sterile 200-μL pipette tip. The media was removed, and the wells were washed with PBS to eliminate any cellular debris. Fresh media was added, and images were captured at this stage, marking 0 hours. Additional images were taken at 24 and 48 hours at the same sites. An OLYMPUS CKX53 (OLYMPUS, Shinjuku, Tokyo, Japan) digital microscope was utilized for image photographing. Time frame of the experimental procedure is described in Figure 1c.
Transwell cell migration assay
Transwell chambers equipped with 8.0-µm pore polyethylene terephthalate membrane inserts (37224, SPL life sciences) were incubated in FBS-free RPMI overnight at 37°C. YD-9 cells were cultured in 21-cm2 dishes. For the single treatment of metformin or cisplatin, media was changed after 48 h, and the cells were treated with metformin or cisplatin for 24 h. In the combination group, cells were pre-treated with metformin for 24 hours, followed by 24 h of cisplatin treatment. Time frame of the experimental procedure is described in Figure 1d. For AMPK inhibition, the cells were treated with 1 µM Compound C for 2 hours before the combination treatment as detailed previously. After 24 hours, the treated cells were harvested using trypsin-EDTA and centrifuged. The supernatant was discarded, and the pellet was resuspended in FBS free RPMI media. The cells were counted with a hemocytometer, and 5 × 10⁴ cells were seeded into the transwell inserts with 300 µL of FBS-free media. The outer chamber was filled with 500 µL of RPMI containing 10% FBS as a chemoattractant. The cells were incubated for 24 hours. Following this period, media was removed, and un-migrated cells were gently wiped away with a cotton swab. The insert was washed with PBS and fixed in ice cold 100% methanol for 20 minutes, then stained with 0.5% crystal violet in PBS for 1 hour at RT. The inserts were rinsed with DDW to remove excess stain, and images were captured using a digital microscope.
Statistical analysis
All the experimental assays were repeated independently in triplicate (n = 3). The representative images of each experiment are presented in the manuscript. Results were presented as the mean ± standard deviation of three independent experiments. GraphPad Prism 10.3.0 software (GraphPad Software, LLC, San Diego, CA, USA) was used for statistical analysis. Shapiro-Wilk test was conducted to assess data normality. As all data were regarded to follow a normal distribution, one-way analysis of variance (ANOVA) was performed to assess data significance followed by Tukey’s post-hoc test. Level of significance was set at 5%.
Results
Metformin amplified cisplatin cytotoxicity in YD-9 cells and inhibited colony formation
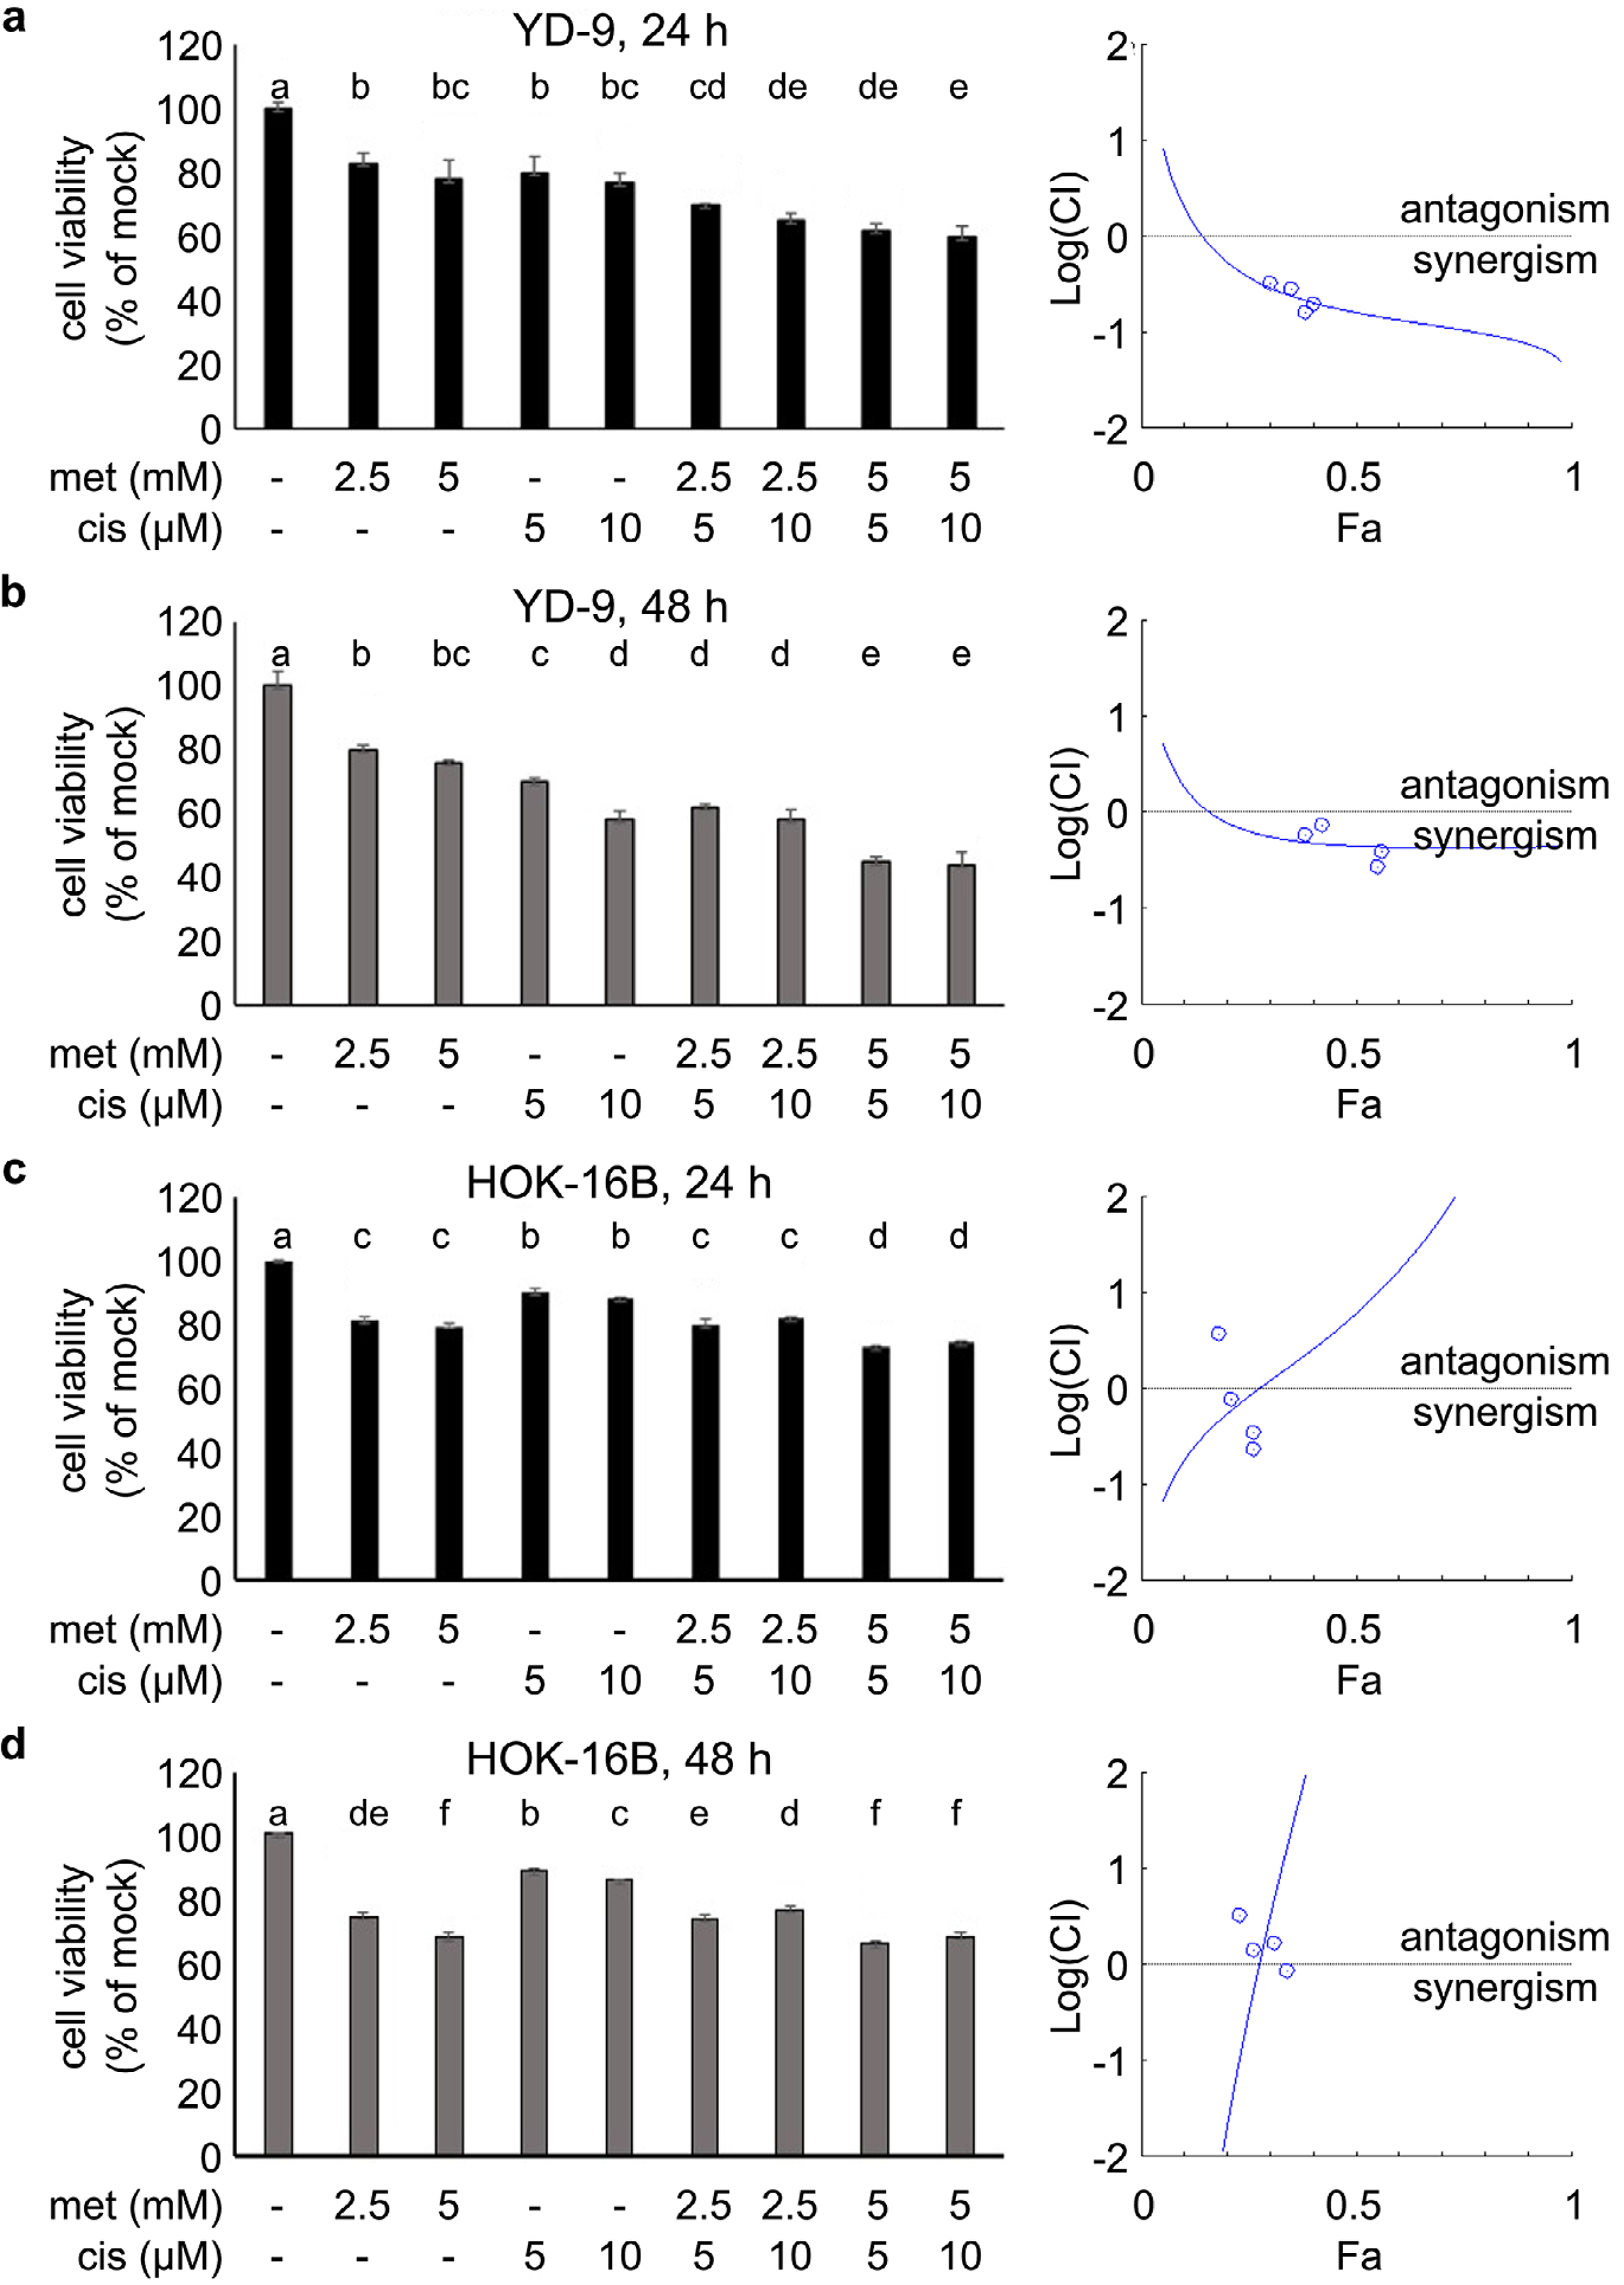
The effect of metformin and cisplatin on cancer cells was examined by MTT assays. OSCC-derived cell line YD-9 cells were treated with varying concentrations of metformin and cisplatin. As a result, both drugs showed a dose- and time-dependent decline in cell viability. Pre-treatment with metformin for 24 hours followed by cisplatin further reduced viability compared with treatment with either metformin or cisplatin alone (Figures 2a, b, left panels). Tables 1 and 2 present the p values calculated from all comparisons in 24- and 48-h-experiment using YD-9 cells, respectively. Chou-Talalay method on the MTT assay data yielded a combination index (CI) less than 1, indicating a synergistic effect of metformin and cisplatin on YD-9 cells (Figure 2a, b, right panels).
p values derived from all group comparisons of YD-9 cell MTT assay data after 24 hours of treatment (Figure 2a, left panel). Data were analyzed using one-way ANOVA followed by Tukey’s post-hoc test. Boldface indicates p values lower than 0.05.
p values derived from all group comparisons of YD-9 cell MTT assay data after 48 hours of treatment (Figure 2b, left panel). Data were analyzed using one-way ANOVA followed by Tukey’s post-hoc test. Boldface indicates p values lower than 0.05.
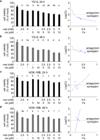
Effect of metformin, cisplatin, and combination treatment on cell viability. Cell viability at the specified concentrations was determined using an MTT assay (left panels) and synergism between metformin and cisplatin was examined by Chou-Talalay method (right panels) in (a) YD-9 cells after 24 h of treatment, (b) YD-9 cells after 48 h of treatment, (c) HOK-16B cells after 24 h of treatment, and (d) HOK-16B cells after 48 h of treatment. Each value denotes the mean and standard deviation from three independent experiments. Different letters on bar charts represent statistically significant differences (One-way ANOVA followed by Tukey’s post-hoc test, p ≤ 0.05). Fa-Log(CI) plots generated using CompySyn software.
HOK-16B, an immortalized human oral keratinocyte cell line, was selected as a normal cell counterpart of YD-9 in this study. HOK-16B cells treated with each single drug exhibited a similar pattern to that shown in YD-9 cells: a dose- and time-dependent decline in cell viability (Figure 2c, d, left panels). Notably, cisplatin exerted less cytotoxicity than metformin in HOK-16B cells, whereas it exerted more cytotoxicity than metformin in YD-9 cells. Tables 3 and 4 describe the p values calculated from all comparisons in 24- and 48-h-experiment using HOK-16B cells, respectively. Additionally, combination treatment on HOK-16B cells resulted in antagonism, or weaker synergism than that observed in YD-9 cells (Figure 2c, d, right panels).
p values derived from all group comparisons of HOK-16B cell MTT assay data after 24 hours of treatment (Figure 2c, left panel). Data were analyzed using one-way ANOVA followed by Tukey’s post-hoc test. Boldface indicates p values lower than 0.05.
p values derived from all group comparisons of HOK-16B cell MTT assay data after 48 hours of treatment (Figure 2d, left panel). Data were analyzed using one-way ANOVA followed by Tukey’s post-hoc test. Boldface indicates p values lower than 0.05.
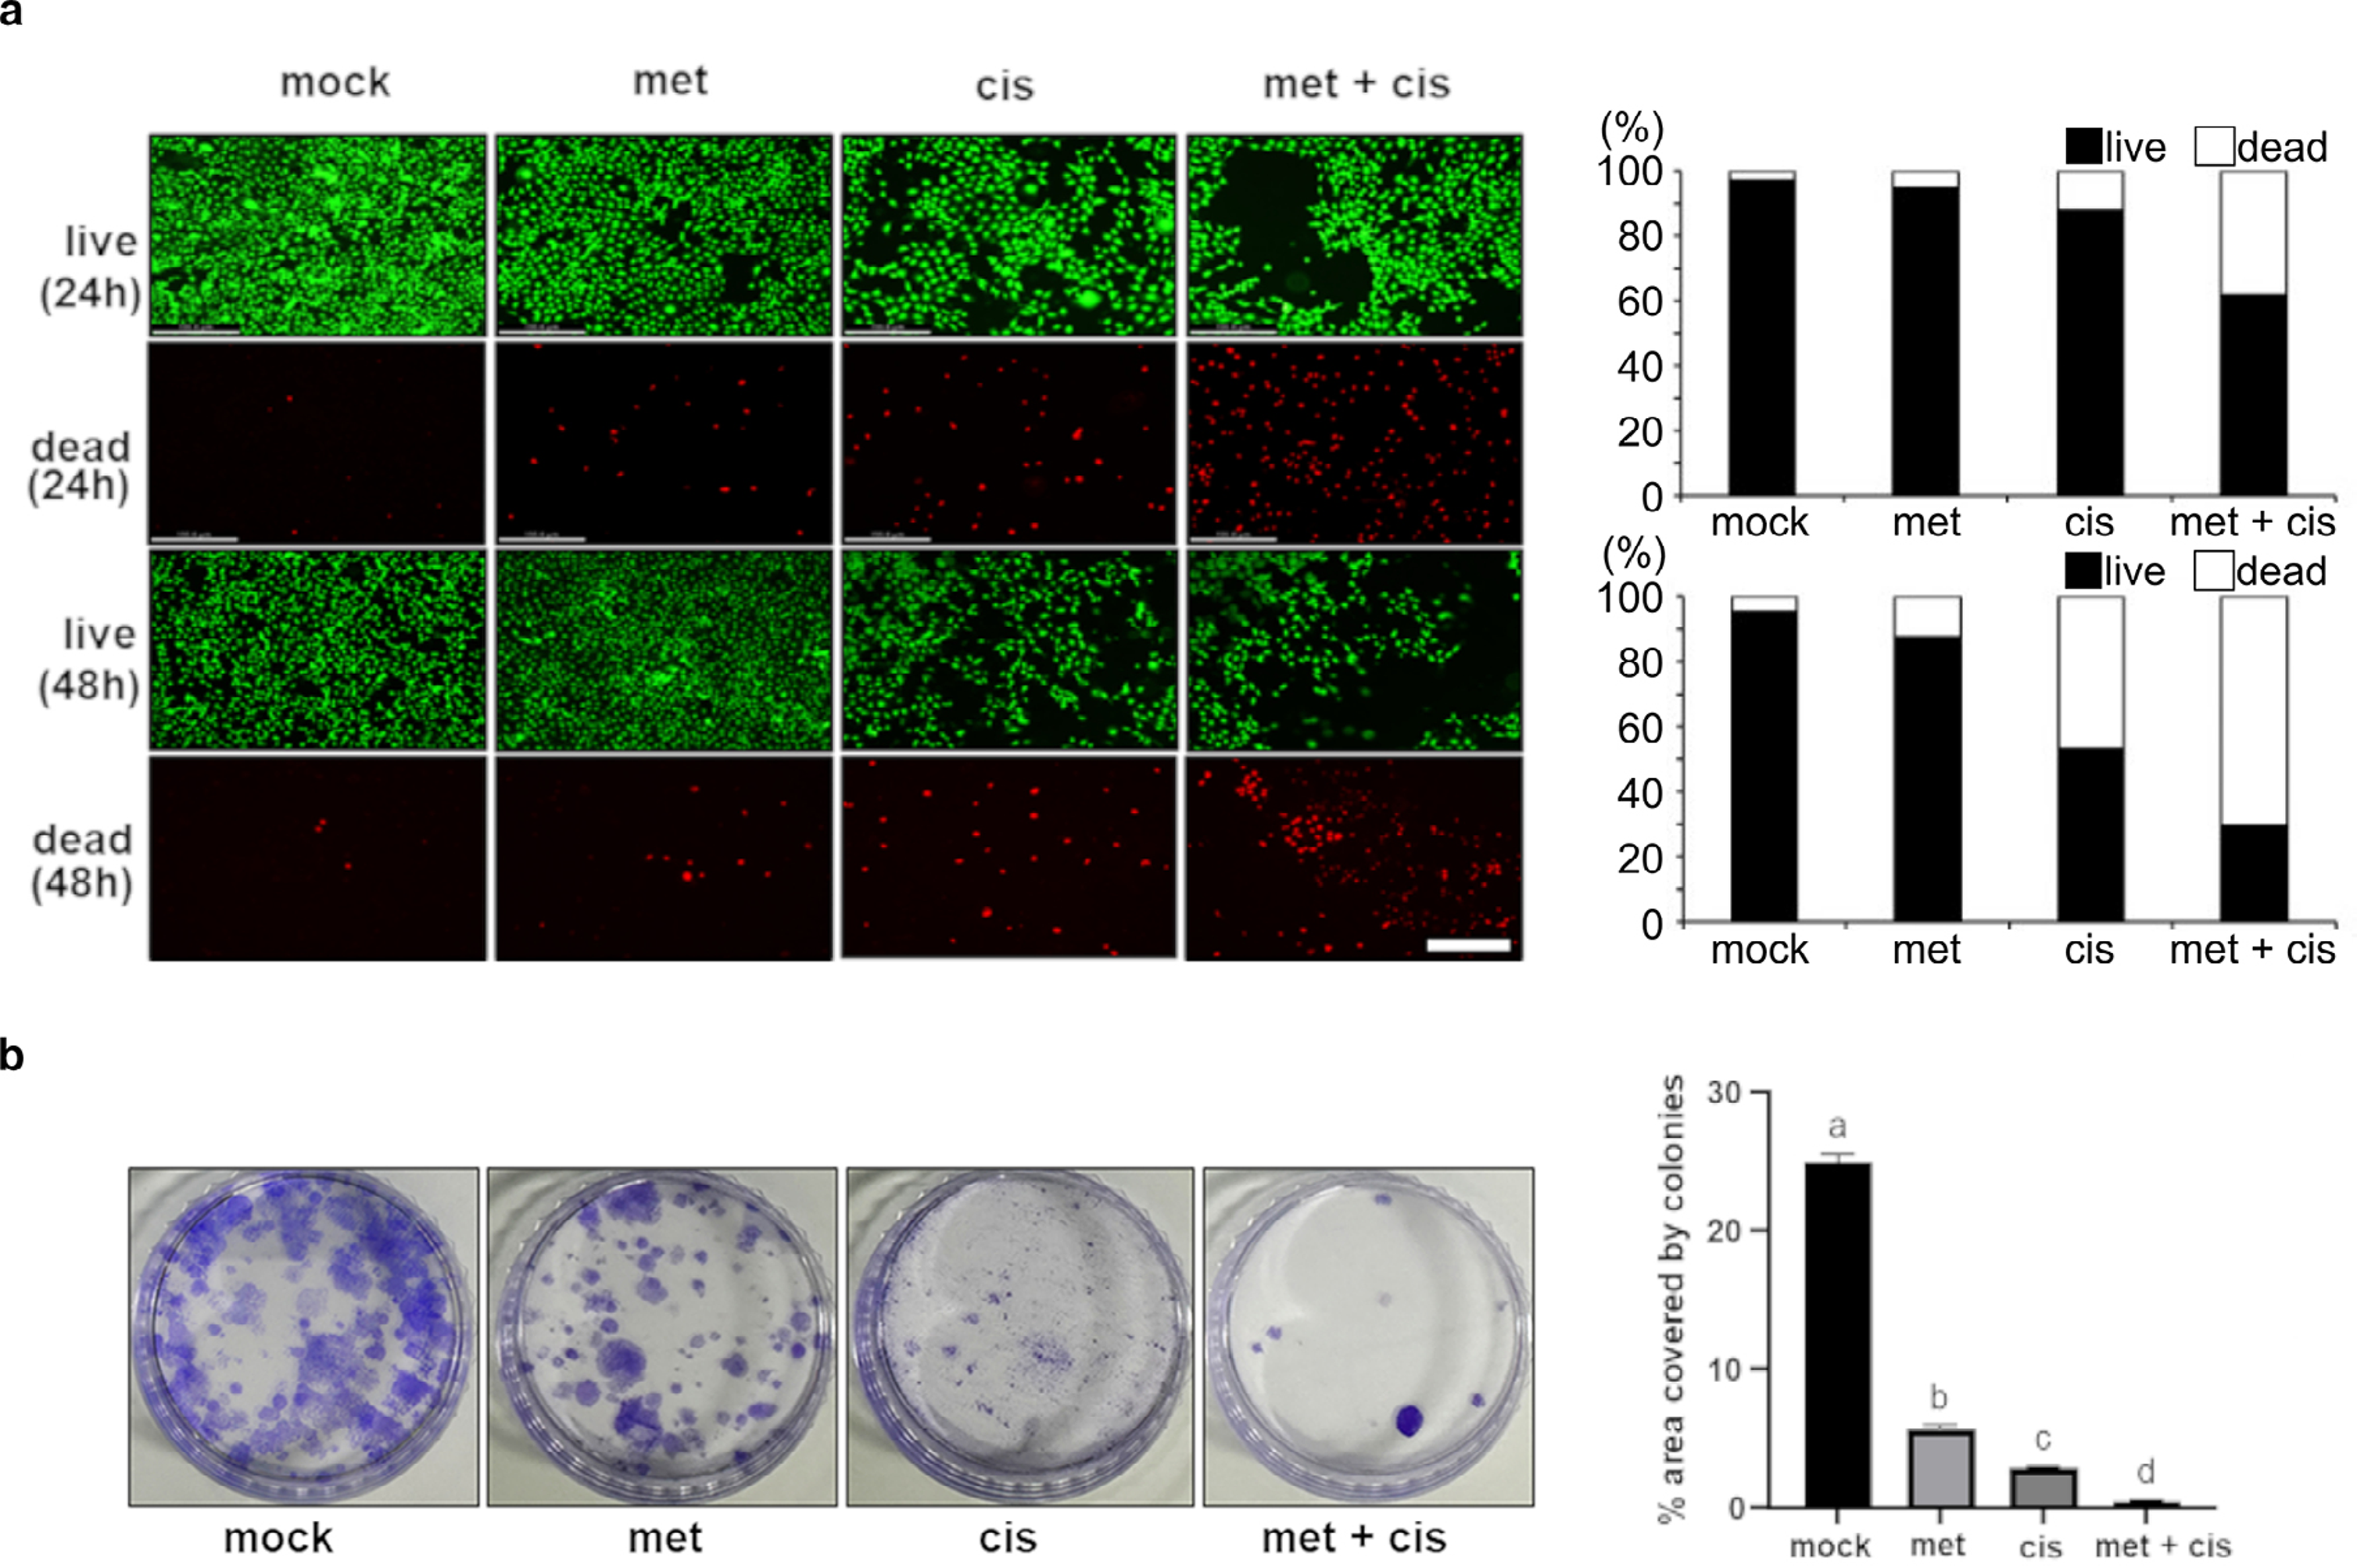
Based on these findings, 2.5 mM of metformin and 5 µM of cisplatin were selected for subsequent experiments. Imaging of live and dead cells additionally showed the highest intensity and number of live cells in the mock group, indicated by bright green fluorescence (Figure 3a). The highest number of dead cells, represented by red fluorescence, was observed in the combination group. Less than 5% of total cells were dead cells in the mock group at both 24 and 48 h. Conversely, combination treatment resulted in about 40% and 70% of dead cells at 24 and 48 h, respectively. A colony formation assay was conducted to evaluate the clonogenic ability of YD-9 cells under control conditions and drug treatment groups (Figure 3b). Both metformin and cisplatin inhibited colony formation by YD-9 cells compared with the untreated mock. The most significant inhibition was observed in the combination group. Table 5 presents the p values calculated from all comparisons in colonization assay experimental groups using YD-9 cells.
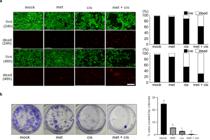
Live and dead cell staining and colony formation assay. (a) For live and dead cell staining, cells underwent treatment with 2.5 mM of metformin or 5 µM of cisplatin, or a combination of metformin treatment for 24 h followed by 24 h of cisplatin treatment. Green fluorescence shows live cells, whereas red indicates dead cells. Scale bar = 155 µm. Live and dead cells proportions are presented in the right panel, as 100% stacked bar charts. (b) Colony formation assay depicts colony formation by YD-9 cells under various treatment conditions in 21-cm2 dishes, 10 days after drug treatment and seeding. Graphical representation of percentage area covered by colonies is presented in the right panel. Different letters represent statistically significant differences (One-way ANOVA followed by Tukey’s post-hoc test, p ≤ 0.05).
p values derived from all group comparisons of YD-9 cell colony formation assay data presented as percentage area covered by colonies (Figure 3b, right panel). Data were analyzed using one-way ANOVA followed by Tukey’s post-hoc test. Boldface indicates p values lower than 0.05.
Metformin and cisplatin synergistically promoted ROS formation and apoptosis in YD-9 cells
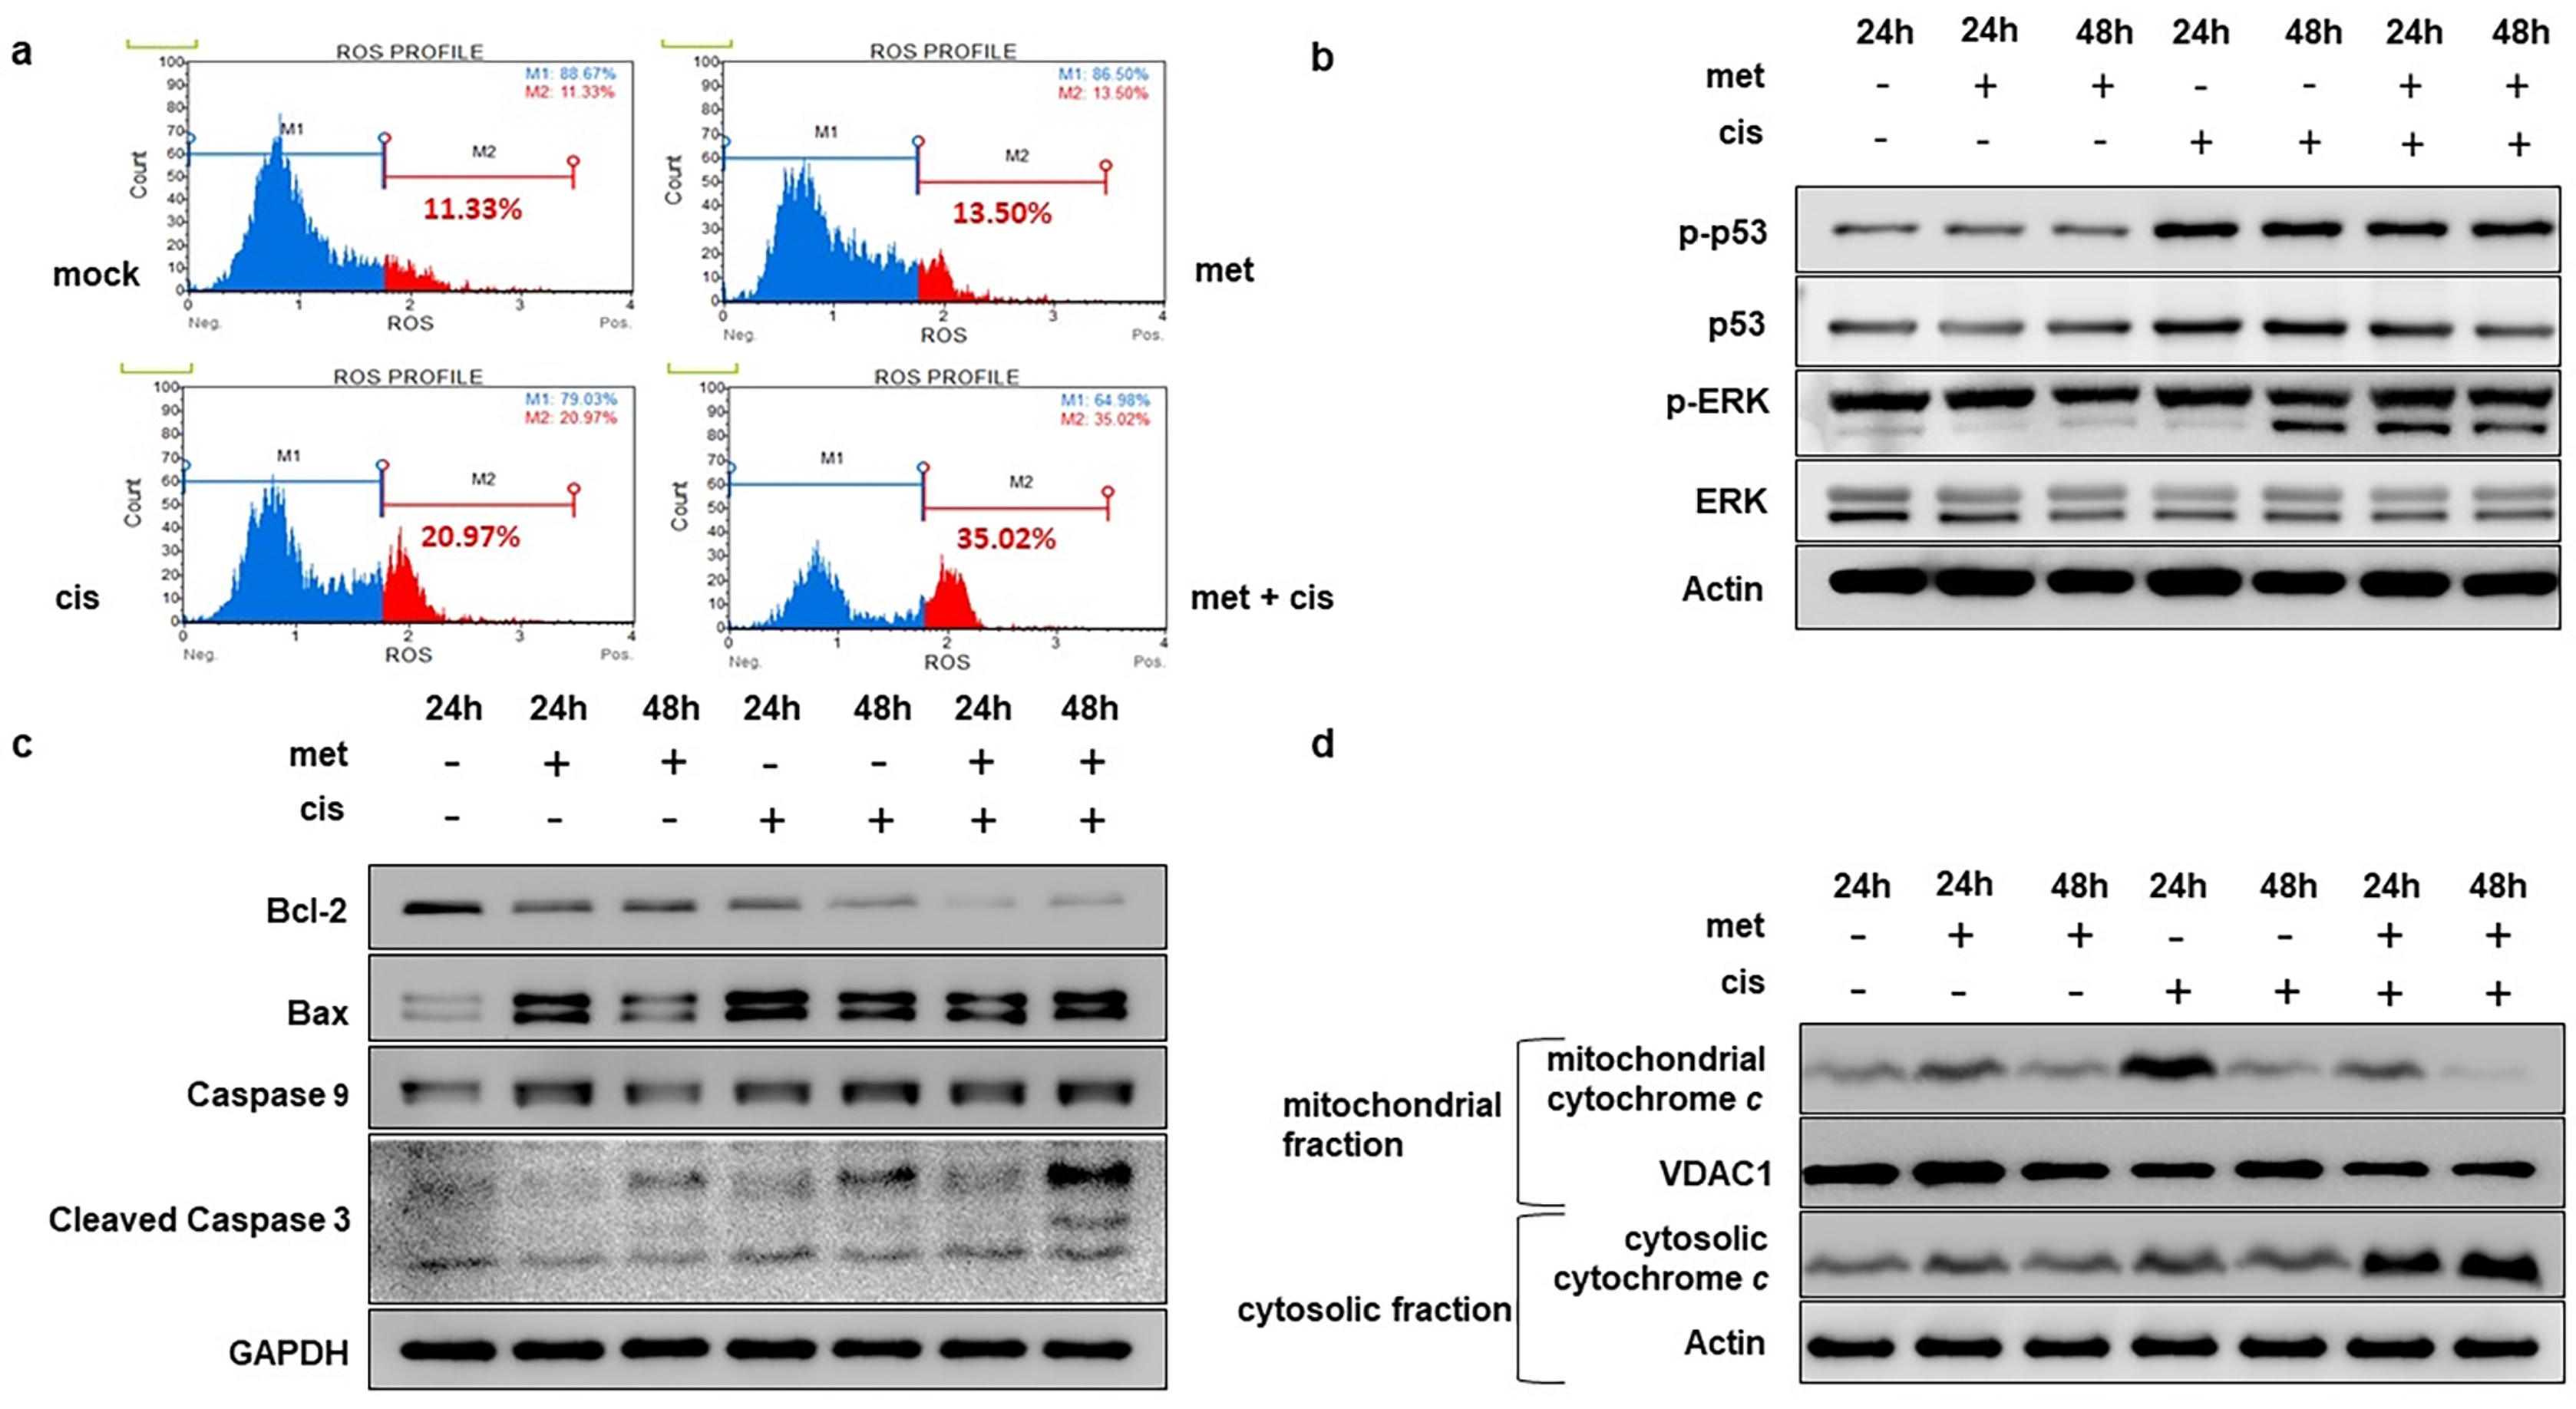
Treatment with metformin and cisplatin individually increased ROS levels in YD-9 cells; however, metformin pre-treatment followed by cisplatin resulted in the highest ROS increase (Figure 4a). As increased ROS level is associated with extracellular signal-regulated kinase (ERK) signaling and p53-induced DNA damage, these protein markers were analyzed. ROS elevation was accompanied by increased ERK (extracellular signal-regulated kinase) phosphorylation, with no changes in total ERK levels. The combination group showed the highest increase in p-ERK levels at 24 h (Figure 4b). Activation of the tumor suppressor protein p53 was observed with cisplatin treatment. Based on these findings, we analyzed the expression of apoptosis-related protein markers. Similar to the MTT data, metformin pre-treatment followed by cisplatin resulted in increased expression of apoptotic proteins like Bax, caspase 9, cleaved caspase 3, and a reduction in the anti-apoptotic protein Bcl-2 (Figure 4c). Mitochondrial protein extraction indicated that the combination treatment resulted in the highest cytochrome c release into the cytosol (Figure 4d).
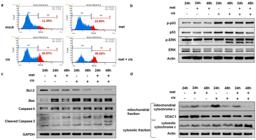
Effect of metformin pre-treatment on ROS level and apoptosis in cisplatin treated YD-9 cells. (a) ROS level in YD-9 cells. ROS levels were analyzed using a Muse oxidative stress assay following treatment of YD-9 cells with 2.5 mM metformin or 5 µM cisplatin, or a combination of metformin for 24 h followed by cisplatin for another 24 h. (b) Western blot assay was performed to analyze protein expression related to p53 and ERK status. (c) Apoptosis-related markers were determined by western blot assay. (d) Cytochrome c release after the specified treatments and times in mitochondrial and cytosolic protein fractions. VDAC1 was used as a housekeeping gene in the mitochondrial fraction.
Combination of metformin and cisplatin inhibited the Epithelial to Mesenchymal Transition (EMT) markers, wound healing and migration in YD-9 cells
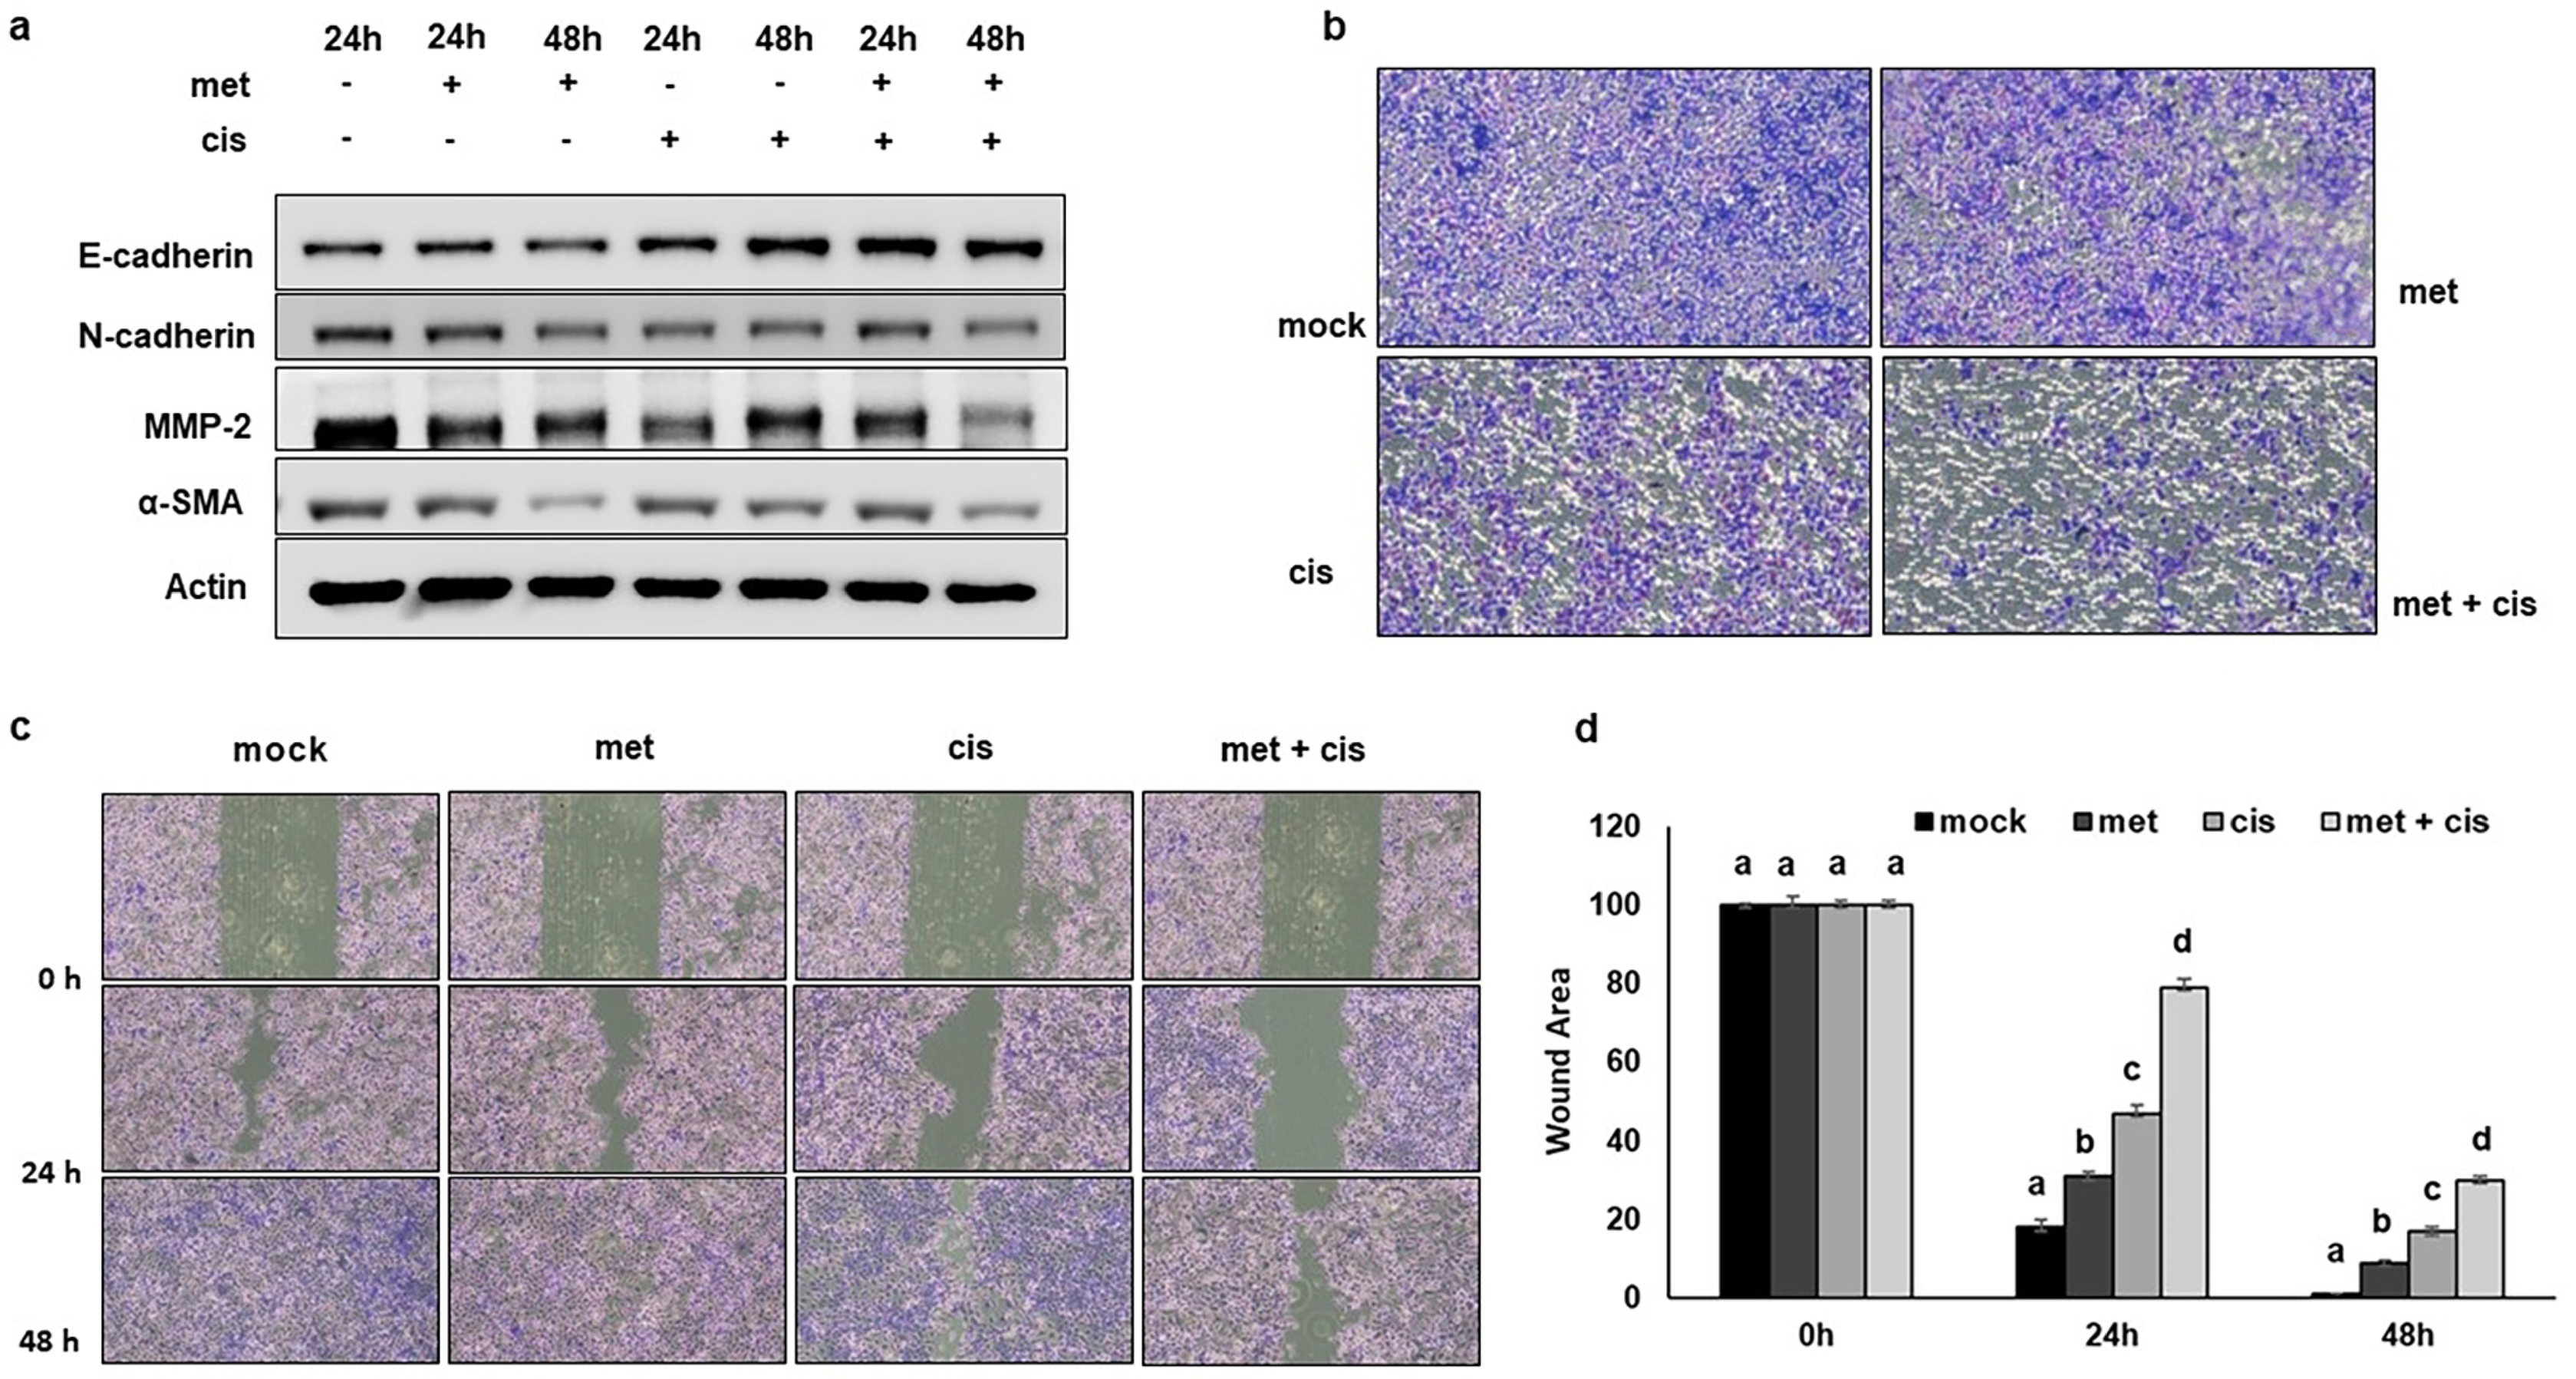
Anti-migratory and EMT-interfering effects of metformin and cisplatin as individual agents were compared with those of their combination; the latter group exhibited a decline in the protein expression of EMT-related markers N-cadherin, MMP-2, and alpha smooth muscle actin (α-SMA) (Figure 5a). Transwell cell migration assays revealed that the combination group had the lowest number of cells migrating across the transwell membrane (Figure 5b). Wound healing assay results corroborated this finding, showing that the metformin and cisplatin combination delayed wound healing compared with the individual drug treatment groups and untreated mock group (Figure 5c, d). Tables 6, 7, and 8 describe the p values calculated from all comparisons in wound healing assay at 0, 24, and 48 h after scratch, respectively.
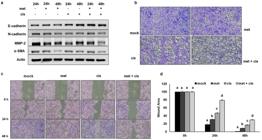
Effect of metformin pre-treatment on EMT markers, wound healing, and migration in cisplatin treated YD-9 cells. (a) EMT related protein expression. YD-9 cells were treated with 2.5 mM metformin or 5 µM cisplatin individually, or with metformin pre-treatment for 24 h followed by cisplatin for 24 and 48 h. After the respective times, total protein was analyzed for EMT markers. (b) Transwell migration assays images following the indicated treatments for 24 h. (c) Wound healing assay images at specific time intervals of 0, 24, and 48 h. (d) Graphical representation of wound healing assay. Different letters represent statistically significant differences (One-way ANOVA followed by Tukey’s post-hoc test, p ≤ 0.05)
p values derived from all group comparisons of YD-9 cell wound healing assay data 0 hours after scratch (Figure 5d, left). Data were analyzed using one-way ANOVA followed by Tukey’s post-hoc test. Boldface indicates p values lower than 0.05.
p values derived from all group comparisons of YD-9 cell wound healing assay data 24 hours after scratch (Figure 5d, middle). Data were analyzed using one-way ANOVA followed by Tukey’s post-hoc test. Boldface indicates p values lower than 0.05.
p values derived from all group comparisons of YD-9 cell wound healing assay data 48 hours after scratch (Figure 5d, right). Data were analyzed using one-way ANOVA followed by Tukey’s post-hoc test. Boldface indicates p values lower than 0.05.
Metformin pre-treatment elevated p-AMPK, downregulated mTOR and induced EMT inhibition in cisplatin treated YD9 cells in an AMPK dependent manner
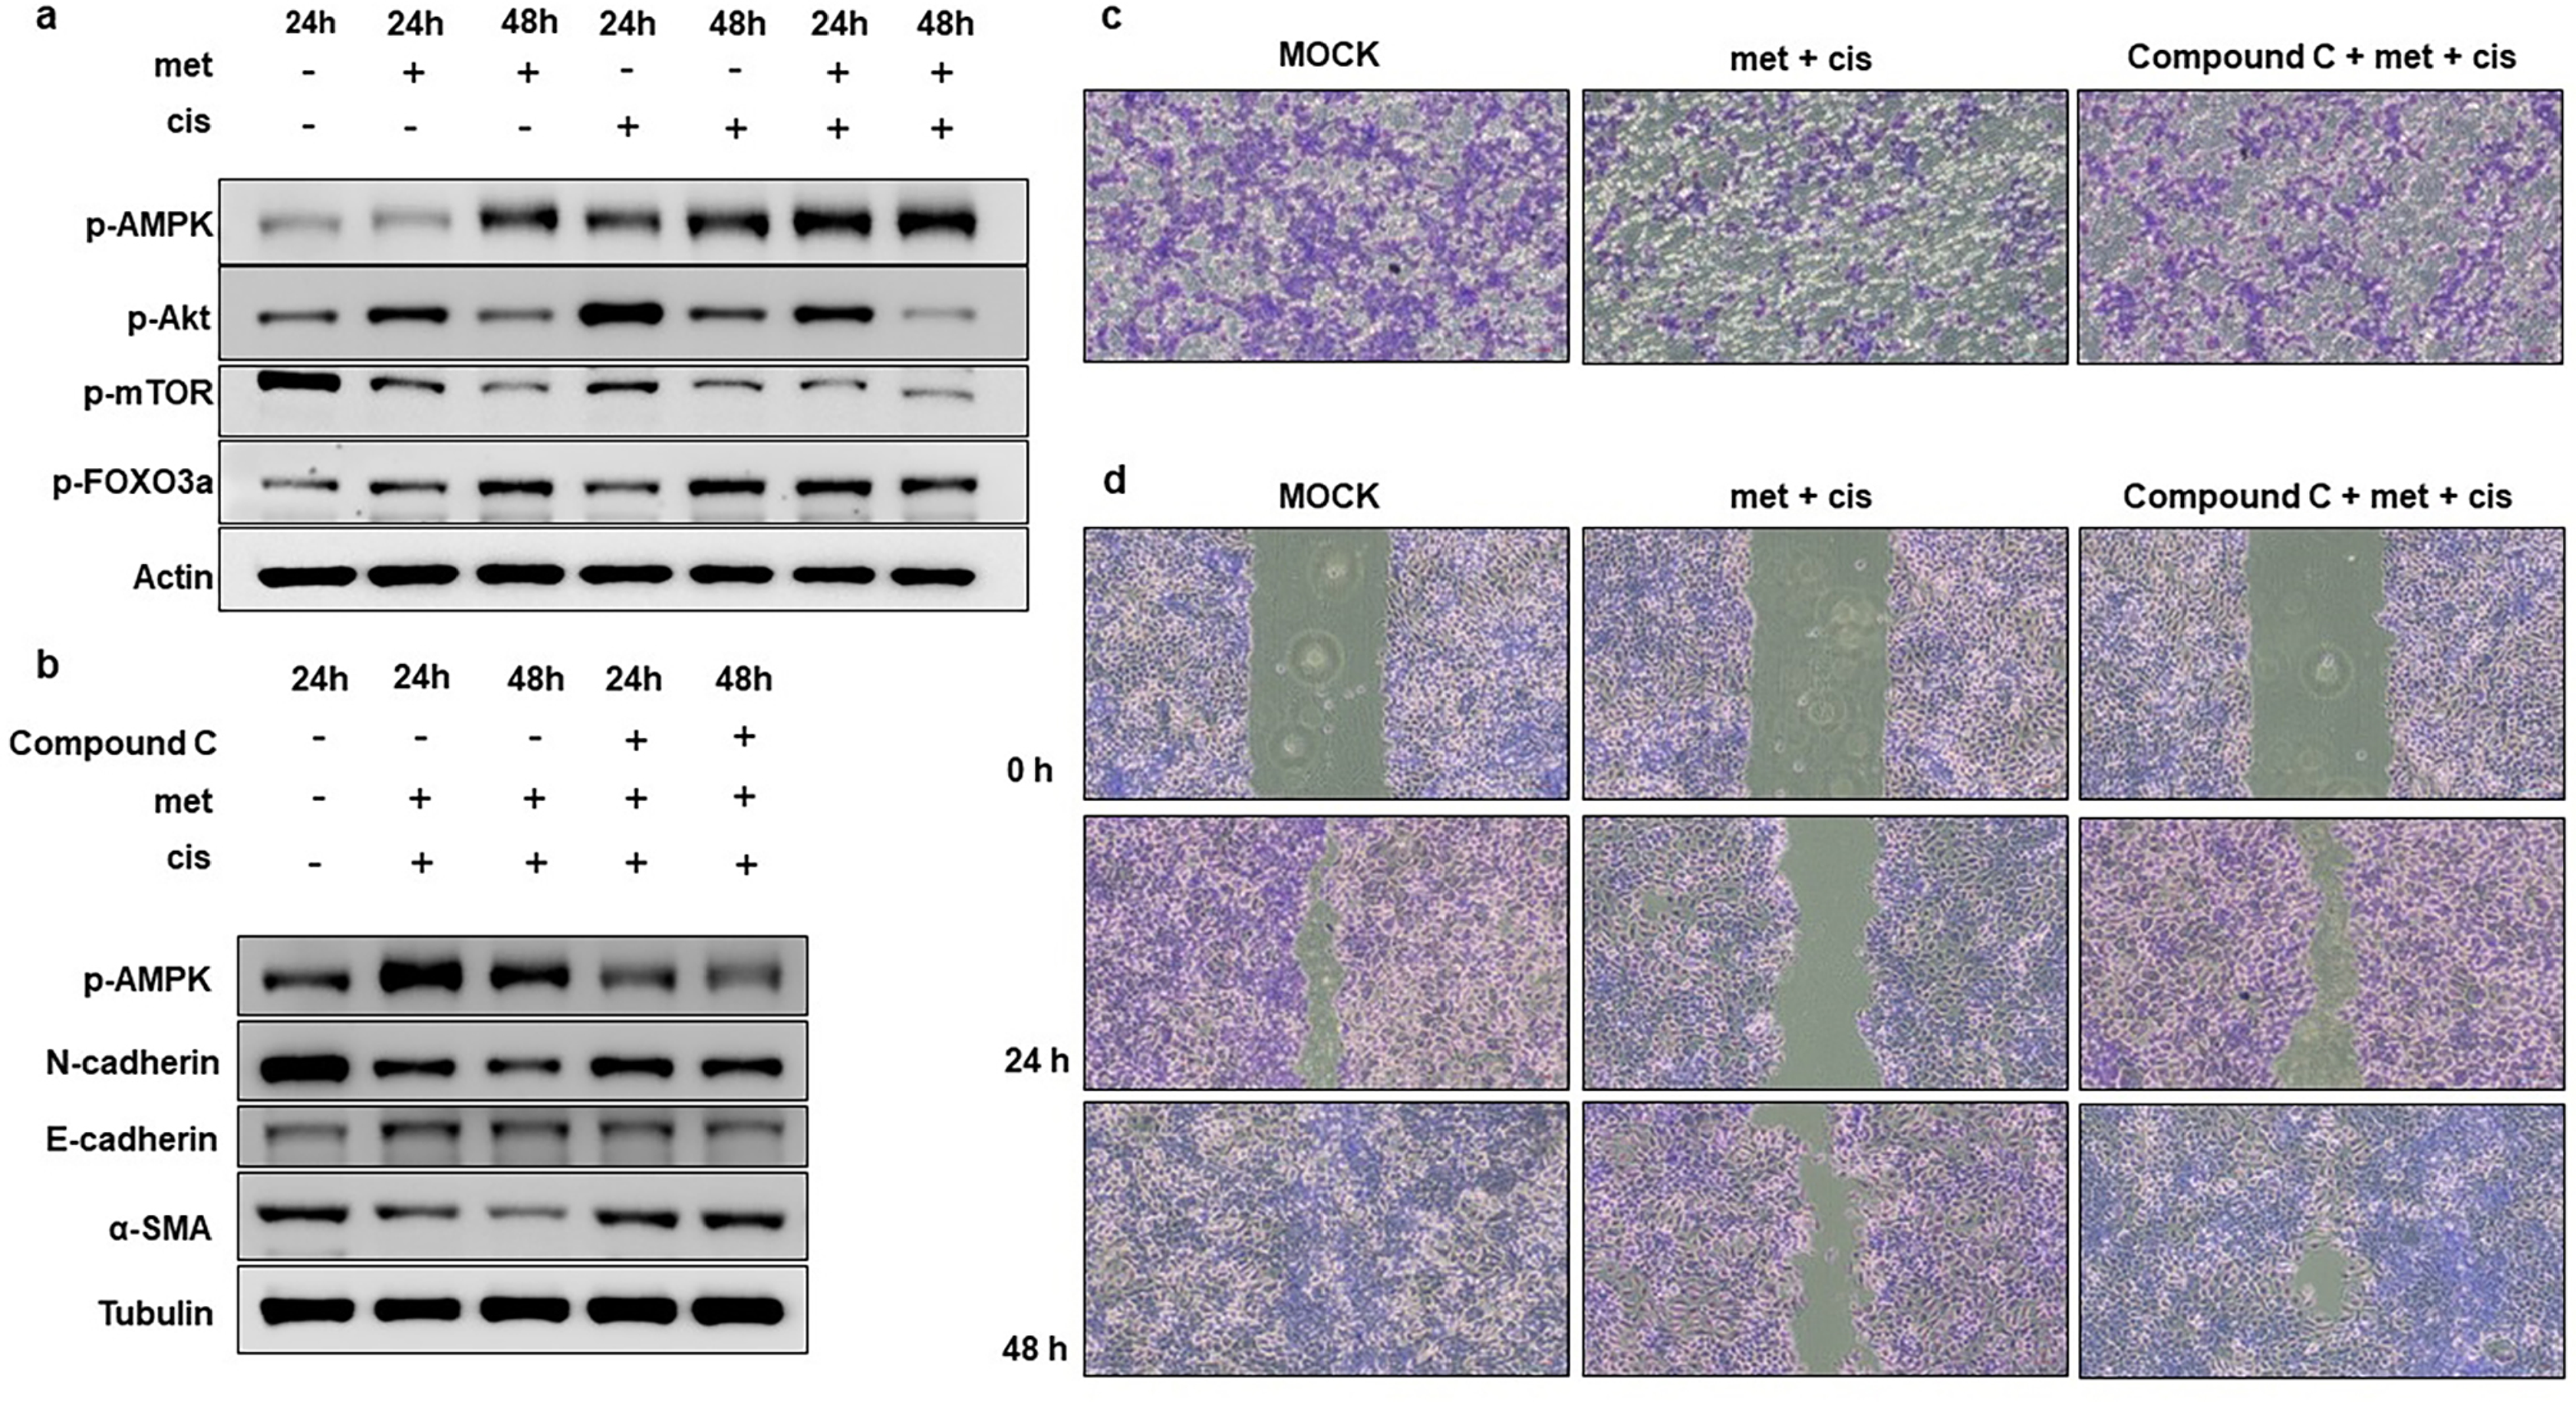
To explore the potential molecular mechanisms whereby metformin enhances cisplatin cytotoxicity, we analyzed AMPK pathway-related signaling molecules as AMPK pathway is directly associated with cellular energy homeostasis, metabolic stress and ROS signaling. Individual drug treatments resulted in increased AMPK phosphorylation. Combination treatments showed further elevation (Figure 6a). The AMPK phosphorylation increase corresponded with p-mTOR downregulation and p-FOXO3a upregulation, most notably in the combination group.
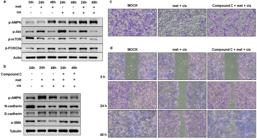
Effect of metformin pre-treatment followed by cisplatin on p-AMPK levels and related molecules. (a) Western blot images of YD-9 cells after specified drug treatments for p-AMPK and associated marker proteins. (b) Effect of AMPK inhibition by Compound C on EMT-related markers analyzed by western blot. Cells were treated with 1 µM Compound C for 2 h followed by metformin and cisplatin for the indicated duration. (c) Transwell cell migration assays (24 h) and (d) wound healing assays (24 h and 48 h) utilized Compound C pre-treatment for 2 h before metformin and cisplatin treatment.
To further verify the role of AMPK in the EMT inhibition of YD-9 cells, a known AMPK inhibitor, Compound C, was utilized. Cytotoxicity of Compound C against YD-9 cells was assessed by MTT assay at a concentration of 1 µM, as more than 90% cells were viable. Cells were pre-treated with Compound C for 2 hours, followed by 24 hours of metformin treatment and subsequent cisplatin treatment in the same media. Compound C inhibited the AMPK phosphorylation increase in the combination group, which also led to the upregulation of EMT markers N-cadherin and α-SMA (Figure 6b). Compound C also restored the rates of transwell cell migration (Figure 6c) and wound healing (Figure 6d) compared with the combination group.
Discussion
Chemotherapy is typically applied in cases with extensive spread or metastasis and is also combined with surgery and/or radiation to reduce the risk of spread and recurrence, pre-surgical reduction of tumor size and to improve surgical outcomes. Common chemotherapeutic agents for OSCC include cisplatin, carboplatin, 5-fluorouracil, paclitaxel, docetaxel, and methotrexate. However, chemotherapy has significant adverse side effects that limit its use and drive the need for methods to reduce such effects while maintaining its anti-cancer effectiveness. Current state of the art still relies on this conventional chemotherapeutics in combination, but newer approaches are emerging. Targeted therapies such as EGFR inhibitors (e.g., afatinib) and tyrosine kinase inhibitors (e.g., erlotinib), immunotherapy, including monoclonal antibodies like pembrolizumab are currently used alone or in conjugation with chemotherapeutics in cases of recurrent or metastatic OSCC.15,16 Gene therapy, nanomedicine for improved drug delivery using nanoparticles, drug carrier systems, photodynamic therapy, and intratumoral drug delivery methods are under further development for future clinical uses but are not yet fully approved for clinical use in OSCC patients.1 Given these scenarios, current research focuses on ways to limit the dose, side effects and toxicity of available chemotherapeutics with an enhanced effectiveness. Yet, there is no single agent with universal applicability and the urgent need to improve the available options remains.17
OSSC is widely prevalent worldwide.18 As conventional chemotherapy against OSCC has multiple adverse effects, there is an urgent need to identify or develop new drugs that increase chemosensitivity or reduce the dosage of these agents.19 In this context, metformin has shown some chemo sensitizing effects in various cancers.20 This study explored the effects of metformin pre-treatment on the response of OSCC derived YD-9 cells to the chemotherapeutic agent cisplatin and the potential pathways involved.
After regular dosing, a steady-state metformin concentration is achieved within 24-48 hours.21 To simulate this condition, YD-9 cells were pre-treated with metformin for 24 hours. Metformin influences various signaling molecules and pathways associated with cell metabolism, survival, and proliferation. Metformin’s anti-tumor effects have also been linked to its capability to reduce blood glucose levels and circulating insulin, and its involvement in an insulin independent manner, either with or without the influence of the AMPK signaling pathway.22,23 Both metformin and cisplatin exhibited a dose-and time-dependent cell viability reduction and proliferation in YD-9 cells and the sequential combination treatment resulted in a further decline. Chou-Talalay method indicated that metformin pre-treatment amplified the cytotoxic effects of cisplatin synergistically. Interestingly, combination treatment exerted weaker synergism or even antagonism in HOK-16B cells. These findings suggest that combination treatment might be more effective against cancer cells than normal cells.
Effect of combination drug treatment was validated by the highest ethidium homodimer-1 uptake in live and dead cell staining, which produced a bright red fluorescence of greatest intensity. Colony formation assay demonstrated the efficacy of synergy between metformin and cisplatin in inhibiting YD-9 cells proliferation over a long-term period of 10 days. Interference in energy metabolism by metformin pre-treatment combined with cisplatin-induced DNA damage, cellular stress, and reduction in mitochondrial biogenesis likely contributed to the enhanced growth arrest of YD-9 cells.24-26 This pharmacological effect might be clinically relevant since type 2 diabetics are often on metformin therapy for a long time as diabetes is a chronic disease, which could explain why some studies report a reduced incidence of cancer and recurrence rates along with improved survival in diabetic individuals taking this drug.27,28
p53 mutation and apoptosis dysregulation are widely prevalent in cancer cells;29 however, YD-9 cells express a wild type p53.4 Treatment of YD-9 cells with cisplatin resulted in an increase in p53 expression as this agent is known to induce DNA damage, a change that was not significant in the metformin-only group. ERK activation, known to occur due to oxidant injury, has been reported to act in a context dependent manner—it can promote cellular survival and proliferation, or it can facilitate cellular apoptosis and death.30,31 In this study, the combination of metformin and cisplatin showed a delayed ERK phosphorylation at 24 and 48 hours, coinciding with the highest ROS levels. ROS increase during cellular stress and DNA damage activates the tumor suppressor protein p53, triggering genes that regulate the cell cycle and apoptotic pathways. When the damage is sustained or exceeds physiological repair capacities, an apoptotic cascade is initiated, ultimately resulting in cell death.
We further investigated this decline in cell viability using western blotting to examine protein markers associated with cell survival, proliferation, and apoptosis. Results were consistent with the MTT assay, as cells treated with metformin and cisplatin exhibited decreased levels of anti-apoptotic proteins such as Bcl-2 and Akt, and increased levels of pro-apoptotic and apoptotic proteins including Bax, caspase 9, and cleaved caspase 3. The combination group had a heightened apoptotic response, showing the highest levels of initiator and executioner caspases. Activated caspase 3, an executioner caspase, plays a crucial role and is considered a point of no return in apoptosis-mediated cell death. Cytochrome c release into the cytosol in the sequential combination treatment group at the highest intensity confirms the involvement of the intrinsic mitochondrial apoptotic pathway.
A major challenge of cancer is its ability to spread, whether to adjacent structures or through distant metastasis. Transformation of the epithelial cell phenotype into a mesenchymal one, featuring migratory and invasive capabilities, is known as EMT. During EMT, epithelial cells lose their polarity and binding ability with the basement membrane, express mesenchymal proteins, degrade the basement membrane, and facilitate distant spread and metastasis which is counterproductive for treatment.32,33 Growth factors and various signaling pathways play roles in initiating and sustaining EMT in cancer cells, where mesenchymal markers like N-cadherin increase and the epithelial marker E-cadherin decreases,34 leading to enhanced cancer invasiveness. α-SMA has also been linked to EMT and poor survival outcomes in cancer patients.35,36 Decreased expression of N-cadherin and α-SMA in combination treatment suggests that metformin pre-treatment may inhibit EMT. A delay in wound healing closure and a reduced number of cells crossing the transwell membrane further support EMT inhibitory capabilities.
Both metformin and cisplatin induced AMPK phosphorylation, indicating a state of cell energy deficiency. The high AMPK phosphorylation observed in the sequential combination treatment suggests synergistic effects. Increase in AMPK phosphorylation accompanied by downregulation of p-Akt and p-mTOR correlates with an increase in p-FOXO3a, a direct downstream target of AMPK.37,38 mTOR inhibition, which is linked to cellular survival, leads to a decrease in cell growth, metabolism, and protein synthesis.39 These findings in association with a significant decline in cell viability, increased apoptotic markers, and EMT inhibition, suggests that AMPK signaling may play a role in the enhanced anti-cancer effects of metformin pre-treatment with cisplatin in YD-9 cells. Inhibition of AMPK signaling by Compound C restored the EMT markers and promoted wound healing and transwell migration of YD-9 cells, confirming the AMPK dependent mechanism.
The enhanced effect of cisplatin with metformin pre-treatment could potentially benefit clinical outcomes, as achieving the same level of cancer cell death requires a higher dose of cisplatin when used alone, thus supporting our initial hypothesis. Disruption of cellular energy homeostasis by sequential treatment with metformin and cisplatin, coupled with DNA damage and increased ROS, activates the tumor suppressor p53 and the metabolic switch AMPK signaling. This leads to the downregulation of mTOR and Akt, synchronizing their activities to induce cellular apoptosis40 and inhibit EMT. The specific mechanisms and pathways through which AMPK influences EMT require further investigation.
Though our results demonstrated the potential benefits of including metformin as an adjuvant in cisplatin chemotherapy against OSCC, there are limitations to this study which demands further exploration for its real-world application. Firstly, this study focuses only on in vitro aspects involving only a single YD-9 cell line. Given the number of cellular, genetic, molecular, mutational and clinical variations in OSCC cell lines, the findings might not translate directly to clinical contexts. Intracellular biology involves a complex, interconnected and simultaneously operating web of pathways. In vivo study which allows organ specific genetic modifications, mimicking the tumor microenvironment, allowing tumor progression study from early time point is not included. This study touches only a certain handful of molecules and specific pathways which demands a further wide-coverage research. Additionally, the usage of single dose and specific treatment duration, and lack of long-term observation focusing on potential resistance development are some of the prominent limitations of this study which needs further justification.
Conclusion
Our findings highlight the potential of using metformin pre-treatment in combating cancer. Nevertheless, further research into dosage, in vivo observations, and a more comprehensive examination of associated pathways and mechanisms is crucial.
Acknowledgement
This work was supported by a grant from the Korea National Research Foundation (NRF), funded by the Korean government (MSIP) (NRF-2021R1F1A1049585).
References
-
1 - Tan Y, Wang Z, Xu M, Li B, Huang Z, Qin S, et al. Oral squamous cell carcinomas: state of the field and emerging directions. Int J Oral Sci. 2023;15(1):44. doi: 10.1038/s41368-023-00249-w
» https://doi.org/10.1038/s41368-023-00249-w -
2 - Cunha AR, Compton K, Xu R, Mishra R, Drangsholt MT, Antunes JL, et al. The global, regional, and national burden of adult lip, oral, and pharyngeal cancer in 204 countries and territories: a systematic analysis for the Global Burden of Disease Study 2019. JAMA Oncol. 2023;9(10):1401-16. doi: 10.1001/jamaoncol.2023.2960
» https://doi.org/10.1001/jamaoncol.2023.2960 -
3 - Gangane NM, Ghongade PV, Patil BU, Atram M. Oral cavity cancer incidence and survival trends: a population-based study. J Cancer Res Ther. 2024;20(5):1446-52. doi: 10.4103/jcrt.jcrt_2720_22
» https://doi.org/10.4103/jcrt.jcrt_2720_22 -
4 - Perri F, Longo F, Fusco R, D'Alessio V, Aversa C, Pavone E, et al. Electrochemotherapy as a first line treatment in recurrent squamous cell carcinoma of the oral cavity and oropharynx PDL-1 negative and/or with evident contraindication to immunotherapy: a randomized multicenter controlled trial. Cancers (Basel). 2021;13(9):2210. doi: 10.3390/cancers13092210
» https://doi.org/10.3390/cancers13092210 -
5 - Foretz M, Guigas B, Viollet B. Metformin: update on mechanisms of action and repurposing potential. Nat Rev Endocrinol. 2023;19(8):460-76. doi: 10.1038/s41574-023-00833-4
» https://doi.org/10.1038/s41574-023-00833-4 -
6 - Evans JM, Donnelly LA, Emslie-Smith AM, Alessi DR, Morris AD. Metformin and reduced risk of cancer in diabetic patients. BMJ. 2005;330(7503):1304-5. doi: 10.1136/bmj.38415.708634.F7
» https://doi.org/10.1136/bmj.38415.708634.F7 -
7 - Wang LW, Li ZS, Zou DW, Jin ZD, Gao J, Xu GM. Metformin induces apoptosis of pancreatic cancer cells. World J Gastroenterol. 2008;14(47):7192-8. doi: 10.3748/wjg.14.7192
» https://doi.org/10.3748/wjg.14.7192 -
8 - Tomic T, Botton T, Cerezo M, Robert G, Luciano F, Puissant A, et al. Metformin inhibits melanoma development through autophagy and apoptosis mechanisms. Cell Death Dis. 2011;2(9):e199. doi: 10.1038/cddis.2011.86
» https://doi.org/10.1038/cddis.2011.86 -
9 - Rogalska A, Forma E, Ciesielski P, Brys M, Krzeslak A, Marczak A. Effect of metformin on apoptosis induction in ovarian cancer cells. Prz Menopauzalny. 2014;13(3):155-61. doi: 10.5114/pm.2014.43817
» https://doi.org/10.5114/pm.2014.43817 - 10 - Song J, Du J, Han L, Lin X, Fan C, Chen G. The effect of metformin on triple-negative breast cancer cells and nude mice. Altern Ther Health Med. 2023;29(8):389-95.
-
11 - Liu Q, Tong D, Liu G, Gao J, Wang LA, Xu J, et al. Metformin inhibits prostate cancer progression by targeting tumor-associated inflammatory infiltration. Clin Cancer Res. 2018;24(22):5622-34. doi: 10.1158/1078-0432.CCR-18-0420
» https://doi.org/10.1158/1078-0432.CCR-18-0420 -
12 - Lee EJ, Kim J, Lee SA, Kim EJ, Chun YC, Ryu MH, et al. Characterization of newly established oral cancer cell lines derived from six squamous cell carcinoma and two mucoepidermoid carcinoma cells. Exp Mol Med. 2005;37(5):379-90. doi: 10.1038/emm.2005.48
» https://doi.org/10.1038/emm.2005.48 -
13 - Park NH, Min BM, Li SL, Huang MZ, Cherick HM, Doniger J. Immortalization of normal human oral keratinocytes with type 16 human papillomavirus. Carcinogenesis. 1991;12(9):1627-31. doi: 10.1093/carcin/12.9.1627
» https://doi.org/10.1093/carcin/12.9.1627 -
14 - Chou TC. Drug combination studies and their synergy quantification using the Chou-Talalay method. Cancer Res. 2010;70(2):440-6. doi: 10.1158/0008-5472.CAN-09-1947
» https://doi.org/10.1158/0008-5472.CAN-09-1947 -
15 - Ketabat F, Pundir M, Mohabatpour F, Lobanova L, Koutsopoulos S, Hadjiiski L, et al. Controlled drug delivery systems for oral cancer treatment-current status and future perspectives. Pharmaceutics. 2019;11(7):302. doi: 10.3390/pharmaceutics11070302
» https://doi.org/10.3390/pharmaceutics11070302 -
16 - Olmos M, Glajzer J, Buntemeyer TO, Frohwitter G, Ries J, Eckstein M, et al. Neoadjuvant Immunotherapy of oral squamous cell carcinoma: case report and assessment of histological response. Front Oncol. 2021;11:720951. doi: 10.3389/fonc.2021.720951
» https://doi.org/10.3389/fonc.2021.720951 -
17 - Imbesi Bellantoni M, Picciolo G, Pirrotta I, Irrera N, Vaccaro M, Vaccaro F, et al. Oral cavity squamous cell carcinoma: an update of the pharmacological treatment. Biomedicines. 2023;11(4):1112. doi: 10.3390/biomedicines1104111
» https://doi.org/10.3390/biomedicines1104111 -
18 - Tranby EP, Heaton LJ, Tomar SL, Kelly AL, Fager GL, Backley M, et al. Oral cancer prevalence, mortality, and costs in medicaid and commercial insurance claims data. Cancer Epidemiol Biomarkers Prev. 2022;31(9):1849-57. doi: 10.1158/1055-9965.EPI-22-0114
» https://doi.org/10.1158/1055-9965.EPI-22-0114 -
19 - Romani AMP. Cisplatin in cancer treatment. Biochem Pharmacol. 2022;206:115323. doi: 10.1016/j.bcp.2022.115323
» https://doi.org/10.1016/j.bcp.2022.115323 -
20 - Tang Z, Tang N, Jiang S, Bai Y, Guan C, Zhang W, et al. The chemosensitizing role of metformin in anti-cancer therapy. Anticancer Agents Med Chem. 2021;21(8):949-62. doi: 10.2174/1871520620666200918102642
» https://doi.org/10.2174/1871520620666200918102642 -
21 - Amin D, Richa T, Mollaee M, Zhan T, Tassone P, Johnson J, et al. Metformin effects on FOXP3(+) and CD8(+) T cell infiltrates of head and neck squamous cell carcinoma. Laryngoscope. 2020;130(9):e490-e8. doi: 10.1002/lary.28336
» https://doi.org/10.1002/lary.28336 -
22 - Zhu L, Yang K, Ren Z, Yin D, Zhou Y. Metformin as anticancer agent and adjuvant in cancer combination therapy: current progress and future prospect. Transl Oncol. 2024;44:101945. doi: 10.1016/j.tranon.2024.101945
» https://doi.org/10.1016/j.tranon.2024.101945 -
23 - Yu H, Zhong X, Gao P, Shi J, Wu Z, Guo Z, et al. The potential effect of metformin on cancer: an umbrella review. Front Endocrinol (Lausanne). 2019;10:617. doi: 10.3389/fendo.2019.00617
» https://doi.org/10.3389/fendo.2019.00617 -
24 - Janzer A, German NJ, Gonzalez-Herrera KN, Asara JM, Haigis MC, Struhl K. Metformin and phenformin deplete tricarboxylic acid cycle and glycolytic intermediates during cell transformation and NTPs in cancer stem cells. Proc Natl Acad Sci U S A. 2014;111(29):10574-9. doi: 10.1073/pnas.1409844111
» https://doi.org/10.1073/pnas.1409844111 -
25 - Fendt SM, Bell EL, Keibler MA, Davidson SM, Wirth GJ, Fiske B, et al. Metformin decreases glucose oxidation and increases the dependency of prostate cancer cells on reductive glutamine metabolism. Cancer Res. 2013;73(14):4429-38. doi: 10.1158/0008-5472.CAN-13-0080
» https://doi.org/10.1158/0008-5472.CAN-13-0080 -
26 - Seo DY, Bae JH, Zhang D, Song W, Kwak HB, Heo JW, et al. Effects of cisplatin on mitochondrial function and autophagy-related proteins in skeletal muscle of rats. BMB Rep. 2021;54(11):575-80. doi: 10.5483/BMBRep.2021.54.11.132
» https://doi.org/10.5483/BMBRep.2021.54.11.132 -
27 - Salehi AM, Wang L, Gu X, Coates PJ, Norberg Spaak L, Sgaramella N, et al. Patients with oral tongue squamous cell carcinoma and coexisting diabetes exhibit lower recurrence rates and improved survival: Implications for treatment. Oncol Lett. 2024;27(4):142. doi: 10.3892/ol.2024.14275
» https://doi.org/10.3892/ol.2024.14275 -
28 - Bodmer M, Meier C, Krähenbühl S, Jick SS, Meier CR. Long-term metformin use is associated with decreased risk of breast cancer. Diabetes Care. 2010;33(6):1304-8. doi: 10.2337/dc09-1791
» https://doi.org/10.2337/dc09-1791 -
29 - Baugh EH, Ke H, Levine AJ, Bonneau RA, Chan CS. Why are there hotspot mutations in the TP53 gene in human cancers? Cell Death Differ. 2018;25(1):154-60. doi: 10.1038/cdd.2017.180
» https://doi.org/10.1038/cdd.2017.180 -
30 - Tan BJ, Chiu GN. Role of oxidative stress, endoplasmic reticulum stress and ERK activation in triptolide-induced apoptosis. Int J Oncol. 2013;42(5):1605-12. doi: 10.3892/ijo.2013.1843
» https://doi.org/10.3892/ijo.2013.1843 -
31 - Sugiura R, Satoh R, Takasaki T. ERK: a double-edged sword in cancer. ERK-dependent apoptosis as a potential therapeutic strategy for cancer. Cells. 2021;10(10):2509. doi: 10.3390/cells10102509
» https://doi.org/10.3390/cells10102509 -
32 - Munakarmi S, Shrestha J, Shin HB, Lee GH, Jeong YJ. 3,3'-diindolylmethane suppresses the growth of hepatocellular carcinoma by regulating its invasion, migration, and er stress-mediated mitochondrial apoptosis. Cells. 2021;10(5):1178. doi: 10.3390/cells10051178
» https://doi.org/10.3390/cells10051178 -
33 - Thiery JP, Acloque H, Huang RY, Nieto MA. Epithelial-mesenchymal transitions in development and disease. Cell. 2009;139(5):871-90. doi: 10.1016/j.cell.2009.11.007
» https://doi.org/10.1016/j.cell.2009.11.007 -
34 - Costa LC, Leite CF, Cardoso SV, Loyola AM, Faria PR, Souza PE, et al. Expression of epithelial-mesenchymal transition markers at the invasive front of oral squamous cell carcinoma. J Appl Oral Sci. 2015;23(2):169-78. doi: 10.1590/1678-775720140187
» https://doi.org/10.1590/1678-775720140187 -
35 - Anggorowati N, Ratna Kurniasari C, Damayanti K, Cahyanti T, Widodo I, Ghozali A, et al. Histochemical and immunohistochemical study of a-SMA, collagen, and PCNA in epithelial ovarian neoplasm. Asian Pac J Cancer Prev. 2017;18(3):667-71. doi: 10.22034/APJCP.2017.18.3.667
» https://doi.org/10.22034/APJCP.2017.18.3.667 -
36 - Parikh JG, Kulkarni A, Johns C. a-smooth muscle actin-positive fibroblasts correlate with poor survival in hepatocellular carcinoma. Oncol Lett. 2014;7(2):573-5. doi:10.3892/ol.2013.1720
» https://doi.org/doi:10.3892/ol.2013.1720 -
37 - Codogno P, Morel E. FOXO3a provides a quickstep from autophagy inhibition to apoptosis in cancer therapy. Dev Cell. 2018;44(5):537-9. doi: 10.1016/j.devcel.2018.02.019
» https://doi.org/10.1016/j.devcel.2018.02.019 -
38 - Das TP, Suman S, Alatassi H, Ankem MK, Damodaran C. Inhibition of AKT promotes FOXO3a-dependent apoptosis in prostate cancer. Cell Death Dis. 2016;7(2):e2111. doi: 10.1038/cddis.2015.403
» https://doi.org/10.1038/cddis.2015.403 -
39 - Murugan AK. mTOR: role in cancer, metastasis and drug resistance. Semin Cancer Biol. 2019;59:92-111. doi: 10.1016/j.semcancer.2019.07.003
» https://doi.org/10.1016/j.semcancer.2019.07.003
-
Data availability statement
All data generated or analyzed during this study are included in this published article.
Edited by
-
Editor:
Ana Carolina Magalhães
All data generated or analyzed during this study are included in this published article.