 Consumption of ultraprocessed food and associated factors among Brazilian older adults: data from the 2019 National Health Survey
Abstract
Objective To assess the consumption of ultra-processed foods (UPF) and its association with sociodemographic factors, lifestyle, and health conditions in Brazilian Older Adults individuals.
Methods Cross-sectional study with data from 22,728 aged participants of the 2019 National Health Survey. A UPF consumption score was estimated based on the consumption of ten foods from the previous day, with elevated consumption defined as ≥5 UPF. Consumption was evaluated according to sociodemographic variables (sex, age, color/race, education, region and geographical area, living with a partner), lifestyle variables (physical activity, television and screen time, tobacco and alcohol use), self-reported chronic diseases (diabetes, hypertension, and depression), and nutritional status. The association was assessed using crude and adjusted logistic regression models, considering sample complexity and sample weights.
Results It was observed that 7.1% of the Older Adults had elevated UPF consumption. After adjustments, having an education level equal to or greater than complete elementary education, living in the South, Southeast, and Central-West regions, in urban areas, and spending ≥3 hours/day watching television increased the chances of elevated UPF consumption, while having diabetes was inversely associated with the consumption of ≥5 UPF.
Conclusion Elevated UPF consumption among the Older Adults was associated with higher education levels, living in more developed regions and urban centers, spending many hours in front of the television, and the absence of a diabetes diagnosis. The novel findings of this nationally representative study contribute to the dietary surveillance of Brazilian Older Adults individuals.
Keywords
Eating; Health of the Aged; National Health Survey
Resumo
Objetivo Avaliar o consumo de alimentos ultraprocessados (AUP) e sua associação com fatores sociodemográficos, de estilo de vida e condições de saúde em pessoas idosas brasileiras.
Métodos Estudo transversal com dados de 22.728 pessoas idosas participantes da Pesquisa Nacional de Saúde de 2019. Foi estimado um escore de consumo de AUP, considerando o consumo de dez alimentos no dia anterior, sendo considerado elevado quando ≥5 AUP. O consumo foi avaliado segundo variáveis sociodemográficas (sexo, idade, cor/raça, escolaridade, região e área geográfica, viver com companheiro), de estilo de vida (prática de atividade física, tempo de televisão e tela, uso tabaco e bebida alcoólica), doenças crônicas autorreferidas (diabetes, hipertensão e depressão) e estado nutricional. A associação foi avaliada por modelos de regressão logística brutos e ajustados considerando a complexidade da amostra e os pesos amostrais.
Resultados Observou-se que 7,1% das pessoas idosas apresentaram consumo elevado de AUP. Após ajustes, ter nível de escolaridade maior ou igual ao ensino fundamental completo, viver nas regiões Sul, Sudeste e Centro-oeste, em áreas urbanas e passar tempo ≥3 horas/dia assistindo televisão aumentam as chances de consumo elevado de AUP, enquanto ter diabetes foi inversamente associado ao consumo de ≥5 AUP.
Conclusão O consumo elevado de AUP entre pessoas idosas foi associado a maiores níveis de escolaridade, viver em regiões consideradas mais desenvolvidas e em centros urbanos, passar muitas horas em frente a televisão e à ausência de diagnóstico de diabetes. Os achados inéditos deste estudo de representatividade nacional contribuem para a vigilância alimentar da pessoa idosa brasileira.
Palavras-Chave:
Consumo Alimentar; Saúde da Pessoa Idosa; Inquérito Nacional de Saúde
INTRODUCTION
In Brazil, according to data from the 2022 Demographic Census, the older population numbers 32,113,490 individuals, representing 15.6% of the national population and a 56.0% increase since the last Census in 20101. This shift is consistent with trends observed globally. The Pan-American Health Organization (PAHO) highlights the sharp increase in life expectancy among low-to-middle-income countries such as nations of the Americas and the Caribbean2.
Aging is a natural process characterized by physical, physiological, psychological and social changes3,4. One of the undisputed factors involved in the aging process and, consequently, contributing to increased life expectancy, is an adequate healthy diet. This is also strongly recommended by the World Health Organization (WHO), which supports the health policies of its member countries5. These recommendations are coupled with encouragement to engage in physical activity, to stop smoking and refrain from alcohol use, since there is a consensus in the scientific literature that these are modifiable risk factors for developing obesity and chronic Noncommunicable Diseases (NCDs), conditions that are more prevalent in older individuals6,7.
Official Brazilian recommendations for an adequate healthy diet are published in the 2014 Dietary Guide for the Brazilian Population which, for the first time, adopts classification of foods according to degree, extent and purpose of industrial processing. These categories include ultra-processed foods (UPF), industrial formulations made from ingredients that are largely to aid manufacturing, such as food additives. These foods are characterized by an unfavorable nutritional profile with a high energy density, high levels of salt, sugars and fats, and low levels of vitamins, minerals and dietary fibers8.
One of the ways of performing surveillance of NCDs and their risk factors, such as poor diet, that is representative for a nation´s population, is via population-based surveys7, such as the Brazilian National Health Survey (PNS). In Brazil, population-based surveys have investigated UPF consumption and its association with sociodemographic profile, lifestyle and the presence of chronic NCDs7,9,10. The findings reveal that UPF consumption is higher among adolescents and declines with age11-13. The results of a systematic review involving 55 studies of different nationalities corroborate these findings, showing that 16 articles identified a consistent negative association between UPF consumption and age14.
However, few studies based on nationally-representative data assessing UPF consumption specifically in the older population have been conducted, where this stage of life tends to be analyzed together with adults (aged ≥18 years). Thus, further characterizing UPF consumption and its associated factors in older Brazilian adults is fundamental given the population aging and importance of care for older individuals in public health, particularly Primary Care. This knowledge can help support policies and programs for promoting and restoring the health of older adults, contributing to the management and care cycle of this population. Therefore, the objective of the present study was to analyze UPF consumption and its association with sociodemographic factors, lifestyle and health conditions, of older Brazilians who took part in the 2019 Brazilian National Health Survey (PNS).
METHOD
A cross-sectional study of data from older adults who participated in the 2019 Brazilian National Health Survey (PNS) was conducted. The PNS constitutes a household nationally-representative survey carried out by the Ministry of Health in partnership with the Brazilian Institute of Geography and Statistics (IBGE) assessing, every 5 years, the performance of the National Health System and the living conditions and health status of the population15. The database used for the current analyses was extracted from the IBGE public-domain database (https://www.ibge.gov.br/estatisticas/sociais/saude/9160-pesquisa-nacional-de-saude.html?edicao=29270&t=downloads). The survey sampling was performed by conglomerates in three stages: In stage (i), the Primary Sampling Units (PSUs) were selected, by simple random sampling, where the PSUs were made up of census sectors. In stage (ii), a fixed number of private households was randomly selected from within each PSU. Finally, in stage (iii), one resident aged ≥15 years was randomly selected from each household to answer the questionnaire. Further details on the sampling process, and development and conducting of the PNS, are available from the paper published by Stopa et al. 15
The expected sample for the 2019 PNS was 108,525 households, but data for 94,114 households were collected and a total of 90,846 interviews conducted9. For the analyses of the present study, only interviews with residents aged ≥60 years were included, comprising a total of 22,728 individuals.
The outcome variable for the study was defined as UPF consumption. The evaluation was based on 10 questions included in the 2019 edition of the survey specifically assessing UPF consumption of the Brazilian population. The questions probed consumption on the day prior to the survey (Yesterday, did you drink or eat..), with dichotomous response options (yes or no) for each of the following UPFs: (1) soft drink; (2) fruit juice in carton/can/powdered form; (3) chocolate-based/flavored yoghurt beverage; (4) packet savory snack/crackers; (5) packet sweet/sandwich biscuits/cake; (6) ice-cream/chocolate/jelly/flan or other processed dessert; (7) frankfurter/sausage/mortadella/ham; (8) sliced bread/hotdog/hamburger rolls; (9) margarine/mayonnaise/ketchup/other processed sauces; (10) instant noodles/packet soup/frozen lasagna/other processed frozen food products.
A score was estimated for the outcome variable by summing the positive answers given for questions on UPF consumption, for a final score ranging from 0 to 10 points. The scores obtained were then dichotomized into less than five UPFs (< 5 AUP) and greater than five UPFs (≥ 5 UPFs), as used by Costa et al.12 in their study of data from the 2019 PNS.
The exposure variables analyzed were:
a) Sociodemographic variables: sex (male and female); place of residence (urban or rural), geographic region (North, Northeast, South, Southeast and Mid-West), age (60-69; 70-79; and ≥80 years), color or race (white or non-white), education (no formal schooling; primary incomplete or equivalent; primary complete or equivalent; secondary complete or equivalent; higher complete), living with spouse/partner (yes or no).
b) Lifestyle behaviors: 1. Engagement in leisure-time physical activity was assessed by the questions “How many days per week do you usually engage in physical exercise or sports?”; If the answer to this question was ≥1 (one) day, the data obtained from the question “Which physical exercise or sport do you do most often?” were analyzed, followed by “In general, on days you do exercise or sports, how long do you spend on this activity?”. The time spent was multiplied by the number of days of activities per week. Engagement in physical activity was classified based on this sum and the recommendations for leisure-time physical activity of at least 150 minutes per week of light or moderate activity, or 75 minutes of vigorous activity9; 2. Time watching television (<3 hours/day or ≥3 hours/day); 3. Screen time (<3 hours/day or ≥3 hours/day); 4. Current tobacco use (yes or no), based on the question: “Do you currently smoke any tobacco products?”, and 5. Alcohol misuse, defined as when more than 5 units were consumed in a single session within last 30 days (yes or no).
c) Chronic NCDs, based on self-reported information (Have you ever been clinically diagnosed with): diabetes (with or without diabetes), arterial hypertension (with or without hypertension) or depression (with or without depression).
d) Nutritional status: obtained by calculating Body Mass Index (BMI = Weight / (Height))²) using self-reported weight (kilograms) and height (meters), classified into underweight (≤22.0 kg/m²), normal weight (>22.0 kg/m² to <27.0 kg/m²) and excess weight (≥ 27.0 kg/m²)16.
The PNS microdata were imported into the Statistical Package for Social Science for Windows (SPSS®), version 22 (perpetual institutional license, series 10101121278). The sample weights and complexity were taken into account in the statistical analyses by using the “Complex Samples” module of SPSS®.
First, the prevalence, together with respective 95% Confidence Intervals (95%CI), of consumption for each of the 10 groups of UPFs by the participants was determined. After dichotomizing the outcome variable (<5 UPFs and ≥ 5 UPFs), the prevalence of high UPF consumption (≥ 5 UPFs) was then assessed.
The prevalences and 95%CIs of the outcome variable were estimated on the bivariate analysis for each of the sociodemographic variables, lifestyle variables and health conditions of interest, where the statistical difference was evaluated based on non-overlap of 95%CIs. Subsequently, for the multiple analysis, the variables associated with the outcome on the bivariate analysis (non-overlapping 95%Cis) were included in the crude and adjusted logistic regression models.
The adjusted models were performed in blocks, according to the hierarchical model, to yield Odds Ratios (OR) and their respective 95%Cis. The distal block comprised only the sociodemographic variables, followed by the intermediate block containing lifestyle variables and, lastly, by the proximal block consisting of the health conditions variables. Variables that were significant at a 5% level in preceding blocks were retained in the intermediate and proximal blocks.
The 2019 PNS was approved by the National Research Ethics Committee (CONEP) on 23rd of August 2019 under permit no. 3.529.376. All participants who agreed to take part signed the Free and Informed Consent Form15.
For the present study, the need to go before the research ethics committee was waived because public data form the PNS were used, with no information allowing identification of subjects, pursuant to the Brazilian Board of Health (CNS) Resolution no. 466/2012.
RESULTS
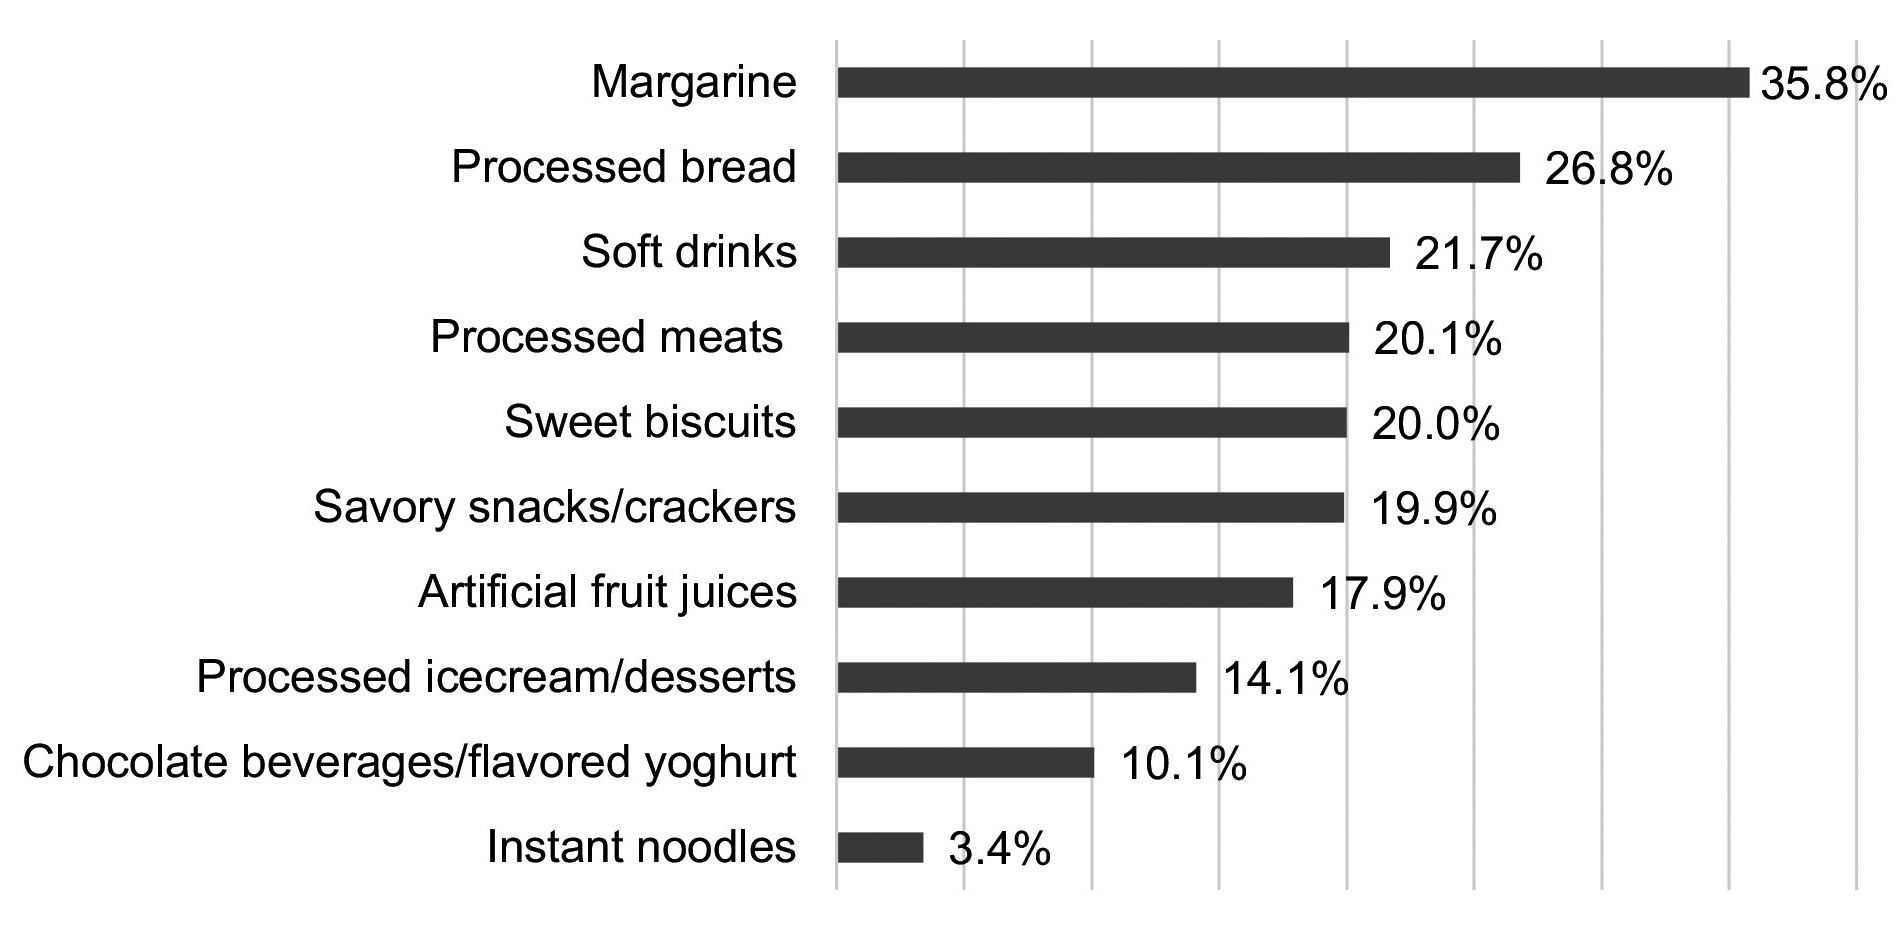
The rates (%) of UPF consumption by the older adults are depicted in Figure 1, showing that the most consumed ultra-processed food group comprised margarine/mayonnaise/ketchup and other processed sauces (35.8%), followed by processed bread (sliced loaves/hotdog rolls/hamburger baps) at 26.8%. The next four groups (soft drinks, processed meat products, crackers and savory snacks) were consumed by 20.5% of participants.
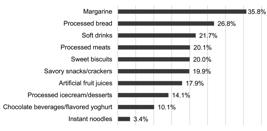
Rates (%) of ultra-processed food consumption among older Brazilian adults. National Health Survey, 2019.
With regard to sociodemographic characteristics presented in Table 1, results show that older adults who participated in the 2019 PNS were predominantly female (56.7%), aged 60-69 years (56,3%), white (50,5%), educated to primary incomplete or equivalent level (46.5%), living in the Southeast region (46.4%), from urban areas (85.5%) and living with their spouse/partner (56.3%). The rates of consumption of UPFs according to sociodemographic variables are also shown in Table 1. Overall, 7.1% of participants consumed ≥ 5 UPF groups, where this rate was higher among individuals who were white (8.3 vs. 5.9%), higher educated, residing in the South and Southeast and from urban areas (7.8% vs. 3.3%) compared with their counterparts.
Rate of consumption of 5 or more groups of ultra-processed foods according to sociodemographic characteristics of older Brazilian adults. National Health Survey, 2019(n=22,728).
Regarding lifestyle behaviors, consumption rate of ≥5 UPF groups was higher among participants who watched television for ≥3 hours/day (9.5%) versus those watching for <3 hours/day (6.1%) and users of tablets, computers or cell phones for ≥3 hours/day (11.3%) versus those who made less use of these devices (6.9%) (Table 2). With respect to the chronic NCDs assessed, individuals with diabetes had lower consumption of UPFs (5.4%) than non-diabetics (7.6%) (Table 3).
Rate of consumption of 5 or more groups of ultra-processed foods according to lifestyle characteristics of older Brazilian adults. National Health Survey, 2019(n=22,728).
Rate of consumption of 5 or more groups of ultra-processed foods according to nutritional status and self-reported chronic Noncommunicable Diseases in older Brazilian adults. National Health Survey, 2019 (n=22,728).
The adjusted logistic regression models (Table 4) revealed that having an educational level of complete primary or higher, living in the South, Southeast or Mid-West as opposed to the North (greater OR in Southern region), residing in urban areas (OR=1.60), and watching television for ≥3 hours per day (OR=1.47), increased the chances of high consumption of UPFs. In addition, being diabetic was inversely associated with high consumption of UPFs (OR=0.67).
Crude and adjusted Odds Ratio for ultra-processed foods score (≥5) according to sociodemographic and lifestyle variables of older Brazilian adults. National Health Survey, 2019(n=22,728).
DISCUSSION
The results of the 2019 Brazilian National Health Survey showed that 7.1% of the Brazilian older population consumed five or more UPF groups on the day prior to the survey and that this consumption differed according to educational level, geographic region and area, time spent watching television, and presence of diabetes. Among the 10 groups assessed, the top two in terms of consumption were margarine/ketchup/mayonnaise/artificial sauces and processed bread products.
Similarly, results on the 2017-2018 Brazilian National Dietary Survey (INA) for UPF consumption among older adults showed higher consumption of savory crackers, processed bread products, confectionary and treats10. Nationally-representative studies which stratified UPF consumption by age group, found that consumption decreased with age when including young adults11,12. These same findings have also been observed in other studies17-19.
The present assessment of age subcategories among the older adults failed to find any significant age-related differences among younger and older age groups, showing that the linear negative association between UPF consumption and age group does not hold for more advanced ages. The study by Camargo and Bós19 of older individuals from five regions of Brazil reported similar results. The investigation of Silva et al..20 also found no significant difference in UPF consumption between individuals aged 60-64 and those over 75 years of age.
This profile may reflect a greater concern over health held by older adults irrespective of age, given they have higher rates of morbimortality due to NCDs compared to other stages of life. Low UPF consumption is a recognized protective factor against these chronic conditions11. Moreover, in the 2019 PNS, analysis of the guidance received from health professionals for controlling NCDs, such as diabetes and hypertension, showed that over 80% of individuals were advised to adopt a healthy diet, cut down on salt, and avoid consuming sugar, sugar-sweetened beverages and confectionary, such as UPFs9.
For participant education, the results show that having concluded primary education increased the chances of UPF consumption compared to having a lower level of education. Review of other nationally-representative studies of samples that include adults and older individuals showed conflicting results. Louzada et al.13, examining data from the INA, found that UPF consumption increased with higher level of education. However, the study by Costa et al.11, drawing on data from the Vigitel system (2019), found a negative association between educational level (≥12 years of formal study) and UPF consumption. Another study by Costa et al.12, analyzing data from the PNS (2019), revealed that after adjustment, no association between education and high UPF consumption persisted.
The apparent conflict between studies might be explained by the change in profile of UPF consumption in Brazil over time. Louzada et al.13, in a temporal analysis of data from the INA, noted that, while the socioeconomic and demographic segments with low income and education still had the lowest UPF consumption, these groups showed the most significant increase between 2008 and 2018, pointing to a trend toward national standardization at a higher level of consumption.
With respect to geographic areas, consumption was higher in urban areas and in more developed regions of the country, especially for the South and Southeast regions. This profile remained when assessing Brazilian adults (aged 18 or older), also based on data from the PNS12, consistent with results reported by other studies showing that residents of urban centers and more developed regions of the country have greater access to UPFs13,17,19,21,22.
These results corroborate findings of a study on data from the 2013 PNS23 comparing consumption of markers of healthy and unhealthy foods among residents of urban and rural areas. The authors discussed that urbanization can change patterns of food consumption by facilitating access to food environments that promote less healthy choices, owing to the wider availability of UPFs and lack of time for preparing and purchasing foods. These conditions result in greater consumption of UPFs in urban areas.
With regard to gender, men in the present study had a higher prevalence of UPF consumption compared to women. However, after adjustment of the analyses, these characteristics lost effect, showing that other sociodemographic variables such as education, region and area of residence have a greater impact on high UPF consumption among older adults. Nationally-representative studies assessing older individuals aged 18 or over, including those over 60 years, Costa et al.11 and Costa et al.12 found higher consumption rates among men. By contrast, Louzada et al.13 and Silva et al.20 found higher UPF consumption among women. This discrepancy in results illustrates the importance of further studies on dietary surveillance which specifically characterize the older population in nationally-representative studies.
For skin color, no association between this variable and UPF consumption was evident. In the nationally-representative study by Costa et al.12, white and yellow individuals consumed more UPFs, whereas black and brown individuals consumed more fresh and minimally-processed foods. However, the studies of Costa et al.11 and Louzada et al.13 highlighted that the proportion of UPFs in the diet had risen significantly among black, indigenous and yellow individuals, but not among white people over the period analyzed (2008–2009 to 2017–2018), although whites still consumed more UPFs overall.
In terms of lifestyle characteristics, television time remains associated with greater UPF consumption. Nationally-representative studies on individuals aged 18 or older found similar results24, 25. Maia et al.25 , in a time-trend analysis, found that individuals who watched television for 3 hours or more per day had a low rate of healthy food markers and higher markers of unhealthy foods, irrespective of gender. Martins et al.24 revealed that the rate of UPF consumption among Brazilians was 35% higher among those who watched TV and 21% greater among users of electronic devices, compared to those who had lower screen time.
Despite an increase in screen time involving other devices such as cell phones, a time-series (2016-2021) study revealed that 25% of adults, particularly older adults (over 30% during period), exhibited excessive TV use26. This scenario, besides promoting sedentarism, results in less time and energy available for preparing meals, leading to the perceived need for convenience in preparing meals and/or buying foods. Moreover, meals are often eaten while using screens. This behavior is exacerbated by the characteristics of UPFs which are hyper-palatable and, hence, readily consumed in large amounts. Another relevant factor is exposure to marketing of UPFs, which can influence and shape food consumption patterns24. A study conducted by Guimarães et al.27 showed that over 90% of food advertisements included at least one UPF.
The present study failed to find any association between UPF consumption and other lifestyle-related variables. With respect to tobacco use, for example, there is no consensus on the relationship between higher UPF consumption and smoking18,21. The study by Crisóstomo et al.18, in Teresina, Piauí state, observed significantly higher UPF consumption among non-smoking older adults. Assumpção et al.21, in a study on overall diet quality of individuals aged 60 or older living in the city of Campinas, São Paulo state, highlighted that older individuals who smoked, and consumed alcoholic beverages and soft drinks, had a poorer quality diet and displayed a pattern of unhealthy habits.
With regard to the presence of chronic NCDs, the current results showed that study participants who reported being diabetic had lower chances of UPF consumption. Similarly, Assumpção et al.21 identified an association between UPF consumption and the prevalence of chronic diseases, such as diabetes, in older adults, whereby individuals harboring diabetes plus three or more chronic diseases had better quality diets. This finding is likely explained by attention to lifestyle of individuals harboring NCDs and by medical advice received emphasizing the importance of adopting a healthy lifestyle for disease control/remission. In the present study, however, the other NCDS assessed showed no association with UPF consumption in the participants investigated.
In any event, systematic reviews and meta-analyses assessing the available scientific evidence on the association of UPF consumption with adverse outcomes underscore the main association with chronic NCDs28,29 and mortality28-30, particularly cardiovascular diseases. Given that older individuals have higher rates of NCDs and, hence, mortality from these chronic diseases, this evidence supports the need for formulating public policy strategies that implement actions to promote lower consumption of UPFs7. Such strategies include taxation on unhealthy foods, increased subsidies stimulating the purchase of fresh and minimally-processed foods, particularly for populations in socioeconomically disadvantaged contexts, and encouragement promoting healthy lifestyles involving physical activity and an adequate healthy diet31.
This study has some limitations, such as its use of self-reported data, which might introduce risk of memory bias and potential under/over-estimation of the variables reported, for both outcomes and exposure. Nevertheless, the methodological rigor and control of the field work carried out by the IBGE, coupled with their experience in conducting nationally-representative surveys, and the use of questions in other surveys, helps assure the quality of the information analyzed and results found.
This study has a number of strengths, including its novel nature investigating the older population on a national level and inclusion of a representative sample, allowing greater generalization of the study results for this age group. In addition, the use of robust statistical techniques, such as adjusted regression models, enables analysis of the impact of the variables on UPF consumption in the older population.
These results can contribute to the framework of food surveillance in older Brazilian adults. Moreover, given that surveillance is an ongoing process, future studies assessing food consumption and planning actions and strategies to care for older individuals in the public health sphere should be undertaken.
CONCLUSION
It was found that 7.1% of the Brazilian older population consumed five or more UPF groups on the day prior to the interview. This high consumption is directly associated with several factors, including having studied to primary level or above, living in more developed and urbanized regions, spending over 3 hours a day watching television, and not being diabetic.
This study is pioneering in its assessment of the older population in Brazil. The results should be used to inform the devising of public health strategies, particularly those involving Food and Nutrition Surveillance and Promotion of an Adequate Healthy Diet, both guidelines of the National Policy on Food and Nutrition32. Rigorous surveillance of these strategies is recommended in the Primary Care setting, representing the main doorway to the National Health System (SUS), and widely used by the older population nationwide. Initiatives such as the Academic Health Program and role of multiprofessional teams (eMultis) represent strategic approaches for undertaking activities targeting this group. Lastly, the present study can help pave the way for further studies on this subject.
ACKNOWLEDGMENTS
The present study received support from the Coordenação de Aperfeiçoamento de Pessoal de Nível Superior Brazil (CAPES) – under funding code 001.
-
There was no funding for the execution of this work.
-
DATA AVAILABILITY
The complete dataset underpinning the results of the present study are available from the Brazilian Institute of Geography and Statistics (IBGE) at https://www.ibge.gov.br/estatisticas/sociais/saude/9160-pesquisa-nacional-de-saude.html?=&t=microdados.
References
- 1 Instituto Brasileiro de Geografia e Estatística. Censo Demográfico 2022: população por idade e sexo: pessoas de 60 anos ou mais de idade: resultados do universo: Brasil, Grandes Regiões e Unidades da Federação [Internet]. Rio de Janeiro: Instituto Brasileiro de Geografia e Estatística, 2023. 9p. [acesso em 02 set 2024]. Disponível em: https://biblioteca.ibge.gov.br/visualizacao/livros/liv102038.pdf
-
2 Organização Pan-Americana da Saúde, Comissão Econômica para a América Latina e o Caribe. Contexto sociodemográfico e econômico do envelhecimento na América Latina [Internet]. Washington, DC: Organização Pan-Americana da Saúde; 2023 [acesso em 02 set 2024]. Disponível em: https://doi.org/10.37774/9789275726839
» https://doi.org/10.37774/9789275726839 -
3 Mendes MRSSB, Gusmão JL de, Faro ACM e, Leite R de CB de O. A situação social do idoso no Brasil: uma breve consideração. Acta Paul Enferm [Internet]. 2005;18(4):422–6 [acesso em 02 set 2024].Disponível em: https://doi.org/10.1590/S0103-21002005000400011
» https://doi.org/10.1590/S0103-21002005000400011 - 4 Benedetti GB. Curso didático de nutrição. 1.ed. São Paulo: Yendis; 2014.
-
5 World Health Organization. Noncommunicable diseases: progress monitor 2020 [Internet]. Geneva: World Health Organization; 2020 [acesso em 02 set 2024]. Disponível em: https://iris.who.int/handle/10665/330805
» https://iris.who.int/handle/10665/330805 -
6 World Health Organization. Global status report on noncommunicable diseases 2014 [Internet]. Geneva: World Health Organization; 2014 [acesso em 02 set 2024]. Disponível em: https://iris.who.int/handle/10665/148114
» https://iris.who.int/handle/10665/148114 -
7 Ministério da Saúde (BR). Secretaria de Vigilância em Saúde. Departamento de Análise em Saúde e Vigilância de Doenças Não Transmissíveis. Plano de Ações Estratégicas para o Enfrentamento das Doenças Crônicas e Agravos não Transmissíveis no Brasil 2021-30 [Internet]. Brasília: Ministério da Saúde; 2021 [acesso em 02 set 2024]. Disponível em: https://www.gov.br/saude/pt-br/centrais-de-conteudo/publicacoes/publicacoes-svs/doencas-cronicas-nao-transmissiveis-dcnt/09-plano-de-dant-2022_2030.pdf/#:~:text=O%20Plano%20de%20Enfrentamento%20das,sa%C3%BAde%20voltados%20%C3%A0s%20doen%C3%A7as%20cr%C3%B4nicas
» https://www.gov.br/saude/pt-br/centrais-de-conteudo/publicacoes/publicacoes-svs/doencas-cronicas-nao-transmissiveis-dcnt/09-plano-de-dant-2022_2030.pdf/#:~:text=O%20Plano%20de%20Enfrentamento%20das,sa%C3%BAde%20voltados%20%C3%A0s%20doen%C3%A7as%20cr%C3%B4nicas - 8 Ministério da Saúde (BR), Secretaria de Atenção à Saúde, Departamento de Atenção Básica. Guia alimentar para a população brasileira [Internet]. 2. ed. Brasília, DF: Ministério da Saúde; 2014 [acesso em 02 set 2024]. Disponível em: https://bvsms.saude.gov.br/bvs/publicacoes/guia_alimentar_populacao_brasileira_2ed.pdf
- 9 Instituto Brasileiro de Geografia e Estatística. Pesquisa Nacional de Saúde 2019. Percepção do estado de saúde, estilos de vida, doenças crônicas e saúde bucal: Brasil e grandes regiões [Internet].Rio de Janeiro: Instituto Brasileiro de Geografia e Estatística; 2020 [acesso em 02 set 2024]. Disponível em: https://www.pns.icict.fiocruz.br/wp-content/uploads/2021/02/liv101764.pdf
- 10 Instituto Brasileiro de Geografia e Estatística. Pesquisa de Orçamentos Familiares 2017-2018: análise do consumo alimentar pessoal no Brasil [Internet]. Rio de Janeiro: Instituto Brasileiro de Geografia e Estatística; 2020 [acesso em 02 set 2024]. Disponível em: https://biblioteca.ibge.gov.br/visualizacao/livros/liv101742.pdf
-
11 Costa C dos S, Sattamini IF, Steele EM, Louzada ML da C, Claro RM, Monteiro CA. Consumo de alimentos ultraprocessados e associação com fatores sociodemográficos na população adulta das 27 capitais brasileiras (2019). Rev Saude Publica [Internet]. 2021 Jul 27;55:47 [acesso em 02 set 2024]. Disponível em: https://doi.org/10.11606/s1518-8787.2021055002833
» https://doi.org/10.11606/s1518-8787.2021055002833 -
12 Costa C dos S, Steele EM, Faria FR de, Monteiro CA. Score of ultra-processed food consumption and its association with sociodemographic factors in the Brazilian National Health Survey, 2019. Cad Saude Publica [Internet]. 2022;38(suppl 1) [acesso em 02 set 2024]. Disponível em: https://doi.org/10.1590/0102-311X00119421
» https://doi.org/10.1590/0102-311X00119421 -
13 Louzada ML da C, Cruz GL da, Silva KAAN, Grassi AGF, Andrade GC, Rauber F, et al. Consumo de alimentos ultraprocessados no Brasil: distribuição e evolução temporal 2008–2018. Rev Saude Publica [Internet]. 2023 Mar 15;57(1):1-13 [acesso em 02 set 2024]. Disponível em:: https://doi.org/10.11606/s1518-8787.2023057004744
» https://doi.org/10.11606/s1518-8787.2023057004744 -
14 Dicken SJ, Qamar S, Batterham RL. Who consumes ultra-processed food? A systematic review of sociodemographic determinants of ultra-processed food consumption from nationally representative samples. Nutr Res Ver [Internet]. 2023 Oct 31;1–41[acesso em 02 set 2024]. Disponível em: https://doi.org/10.1017/S0954422423000240
» https://doi.org/10.1017/S0954422423000240 -
15 Stopa SR, Szwarcwald CL, Oliveira MM de, Gouvea E de CDP, Vieira MLFP, Freitas MPS de, et al. Pesquisa Nacional de Saúde 2019: histórico, métodos e perspectivas. Epidemiol Serv Saude [Internet]. 2020;29(5) [acesso em 02 set 2024]. Disponível em: https://doi.org/10.1590/S1679-49742020000500004
» https://doi.org/10.1590/S1679-49742020000500004 - 16 Lipschitz DA. Screening for nutritional status in the elderly. Prim Care. 1994 Mar;21(1):55-67.
-
17 De Miranda RC, Rauber F, de Moraes MM, Afonso C, Santos C, Rodrigues S, et al. Consumption of ultra-processed foods and non-communicable diseases-related nutrient profile in Portuguese adults and elderly (2015-2016): The Upper project. Br J Nutr [Internet]. 2020 Sep 3;1–37 [acesso em 02 set 2024] Disponível em: https://doi.org/10.1017/S000711452000344X
» https://doi.org/10.1017/S000711452000344X -
18 Crisóstomo J de M, Rodrigues LARL, Nascimento LM, Viola PC de AF, Frota K de MG. Consumption of ultra-processed foods and anthropometric indicators in adolescents, adults, and the elderly in a capital city in northeastern Brazil. Rev Nutr [Internet]. 2022 Aug 8;35 [acesso em 02 set 2024]. Disponível em: https://doi.org/10.1590/1678-9865202235e210052
» https://doi.org/10.1590/1678-9865202235e210052 -
19 Camargo L da R, Bós Ângelo JG. Disponibilidade de alimentos de acordo com o grau de processamento em famílias com idosos jovens e longevos (POF 2017-2018). Rev Nutr [Internet]. 2023;35:1-8 [acesso em 02 set 2024]. Disponível em: https://doi.org/10.1590/1678-9865202235e210251
» https://doi.org/10.1590/1678-9865202235e210251 -
20 Silva GMD, Assumpção D, Freiria CN, Borim FSA, de Brito TRP, Corona LP. Association of Food Consumption According to the Degree of Processing and Sociodemographic Conditions in Older Adults. Foods [Internet]. 2023 Nov 13;12(22):41 [acesso em 02 set 2024]. Disponível em: https://doi.org/10.3390/foods12224108
» https://doi.org/10.3390/foods12224108 -
21 Assumpção D de Domene SMÁ, Fisberg RM, Barros MB de A. Qualidade da dieta e fatores associados entre idosos: estudo de base populacional em Campinas, São Paulo, Brasil. Cad Saude Publica [Internet]. 2014 Aug;30(8):1680–94 [acesso em 02 set 2024]. Disponível em: https://doi.org/10.1590/0102-311X00009113
» https://doi.org/10.1590/0102-311X00009113 -
22 Levy, R.B.; Andrade, G.C.; da Cruz, G.L.; Rauber, F.; da Costa Louzada, M.L.; Claro, R.M.; Monteiro, C.A. Três décadas da disponibilidade domiciliar de alimentos segundo a NOVA—Brasil, 1987–2018. Rev. Saude Publica [Internet]. 2022;56:75 [acesso em 02 set 2024]. Disponível em: https://doi.org/10.11606/s1518-8787.2022056004570
» https://doi.org/10.11606/s1518-8787.2022056004570 -
23 Costa DV de P, Lopes MS, Mendonça R de D, Malta DC, Freitas PP de, Lopes ACS. Diferenças no consumo alimentar nas áreas urbanas e rurais do Brasil: Pesquisa Nacional de Saúde. Cien Saude Colet [Internet]. 2021;26:3805–13 [acesso em 02 set 2024]. Disponível em: https://doi.org/10.1590/1413-81232021269.2.26752019
» https://doi.org/10.1590/1413-81232021269.2.26752019 -
24 Martins RCdO, Caldeira TCM, Soares MM, Mais LA, Claro RM. Leisure Screen Time and Food Consumption among Brazilian Adults. International Int J Environ Res Public Health [Internet]. 2024;21(9):1123 [acesso em 02 set 2024]. Disponível em: https://doi.org/10.3390/ijerph21091123
» https://doi.org/10.3390/ijerph21091123 -
25 Maia EG, Gomes FMD, Alves MH, Huth YR, Claro RM. Hábito de assistir à televisão e sua relação com a alimentação: resultados do período de 2006 a 2014 em capitais brasileiras. Cad Saude Publica[Internet]. 2016;32(9). [acesso em 02 set 2024]. Disponível em: https://doi.org/10.1590/0102-311X00104515
» https://doi.org/10.1590/0102-311X00104515 -
26 Cardoso PC, Schaan BD, Oliveira A, Silva M, Silva H, Andrade S, et al. Changes in screen time in Brazil: a time-series analysis 2016-2021 [Internet]. Am J Health Promot. 2023;37(5):681-4 [acesso em 02 set 2024]. Disponível em: https://doi.org/10.1177/08901171231152147
» https://doi.org/10.1177/08901171231152147 -
27 Guimarães JS, Mais LA, M. Leite FH, Horta PM, Santana MO, Martins APB, et al. Abusive advertising of food and drink products on Brazilian television. ealth Promot Int [Internet]. 2022;37(2). daab025, https://doi.org/10.1093/heapro/daab025
» https://doi.org/10.1093/heapro/daab025 -
28 Lane MM, Gamage E, Du S, Ashtree DN, McGuinness AJ, Gauci S, et al. Ultra-processed food exposure and adverse health outcomes: umbrella review of epidemiological meta-analyses. BMJ [Internet]. 2024;384 [acesso em 02 set 2024]. Disponível em: https://doi.org/10.1136/bmj-2023-077310
» https://doi.org/10.1136/bmj-2023-077310 -
29 Lane MM, Davis JA, Beattie S, Gómez-Donoso C, Loughman A, O'Neil A, et al. Ultraprocessed food and chronic noncommunicable diseases: A systematic review and meta-analysis of 43 observational studies. Obes Rev [Internet]. 2021 Mar;22(3) [acesso em 02 set 2024]. Disponível em: https://doi.org/10.1111/obr.13146
» https://doi.org/10.1111/obr.13146 -
30 Suksatan W, Boonpheng B, Jannathao N, Kanchanatawan B, Suppasri A, Panthong K, et al. Ultra-processed food consumption and adult mortality risk: a systematic review and dose–response meta-analysis of 207,291 participants. Nutrients [Internet]. 2021 Jan;14(1):174 [acesso em 02 set 2024]. Disponível em: https://doi.org/10.3390/nu14010174
» https://doi.org/10.3390/nu14010174 - 31 Popkin BM, Barquera S, Corvalan C, Hofman KJ, Monteiro CA, Ng SW, et al. Towards unified and impactful policies to reduce ultra-processed food consumption and promote healthier eating. Lancet Diabetes Endocrinol [Internet]. 2021;9(6):462-470 [acesso em 02 set 2024]. Disponível em: 10.1016/S2213-8587(21)00078-4
-
32 Brasil. Ministério da Saúde. Secretaria de Atenção à Saúde. Departamento de Atenção Básica. Política Nacional de Alimentação e Nutrição. 1. ed., 1. reimpr. Brasília: Ministério da Saúde; 2013. 84 p. [acesso em 02 set 2024]. Disponível em: https://bvsms.saude.gov.br/bvs/publicacoes/politica_nacional_alimentacao_nutricao.pdf
» https://bvsms.saude.gov.br/bvs/publicacoes/politica_nacional_alimentacao_nutricao.pdf
Edited by
-
Edited by: Yan Nogueira Leite de Freitas
The complete dataset underpinning the results of the present study are available from the Brazilian Institute of Geography and Statistics (IBGE) at https://www.ibge.gov.br/estatisticas/sociais/saude/9160-pesquisa-nacional-de-saude.html?=&t=microdados.