Genetic divergence and morphological characterization of native golden spoon plants from eastern Mato Grosso state, Brazil
Abstract:
This study aimed to examine the genetic divergence and morphological traits among golden spoon individuals native to the eastern region of Mato Grosso, utilizing multivariate analysis techniques. Ripe fruits were collected from 40 distinct individuals across four natural habitats of the species during the January 2022 harvest. Ten plants were selected within each habitat,constituting a population from which 10 fruits per individual were collected, totaling 100 fruits per population. The investigation encompassed measurements of fruit length, width, thickness, weight, and volume; peel weight; seed length, width,thickness, and weight; pulp thickness and weight; seed volume index (SVI); and °Brixcontent. Multivariate analyses employed the UPGMA and Tocher optimization methods, principal component analysis, and relative contribution assessment. The UPGMA method delineated five distinct groups, while the Tocher method and scatter plot analysis identified seven groups. Linear correlation estimates revealed robust positive and negative correlations, particularly between fruits with a heavier weight. The first three principal components accounted for 83.83% of total variation, with °Brix attributes exhibiting the most significant relative contribution to individual differentiation. All three clustering methods employed evidenced genetic divergence among golden spoon individuals.
Index terms
Multivariate analysis; Byrsonima cydoniifolia; Correlations; Amazonian fruits; Variability
Resumo:
O estudo teve como objetivo analiSar a divergência genética e a caracterização morfológica existente entre indivíduos de muricizeiros nativos da região leste do Estado de Mato Grosso, por meio de técnicas de análise multivariada. Frutos maduros foram coletados de 40 indivíduos diferentes, em quatro áreas de ocorrência natural da espécie, durante a safra de janeiro de 2022, selecionando 10 plantas dentro de cada área de estudo, caracterizando uma população, onde foram coletados 10 frutos em cada indivíduo, totalizando 100frutos por população. Foram analisados o comprimento, a largura, a espessura, a massa e o volume dos frutos; massa da casca; comprimento, largura, espessura e massa das sementes; espessura e massa da polpa; índice de volume das sementes (IVS) e°brix.As análises multivariadas foram realizadas com os métodos UPGMA e otimização de Tocher, componentes principais e contribuição relativa. Cinco grupos distintos foram formados com base no método UPGMA e sete grupos no Tocher e dispersão gráfica.A estimativa de correlações lineares revelou fortes correlações positivas enegativas,evidenciando frutos com maior quantidade de massa. Os três primeiros componentes principais explicaram 83,83% da variação total. A característica °brix apresentou a maior contribuição relativa para a diferenciação dos indivíduos. Os trêsmétodos de agrupamento utilizados revelaram que há divergência genética entre osindivíduos de muricizeiros.
Termos para indexação
Análise multivariada; Byrsonima cydoniifolia; Correlações; Frutas amazônicas; Variabilidade
Introduction
Golden spoon (Byrsonima cydoniifolia A.Juss.) is a fruit plant indigenous to tropical and subtropical climates in Central America and South America. Belonging to the family Malpighiaceae, the species thrives in various regions of the Brazilian ‘cerrado’ biome, notably such as the states of Mato Grosso, Minas Gerais, and Goiás. Additionally, it is found in other countries such as Guyana, Venezuela, Colombia, Bolivia, Peru, Costa Rica, and Cuba, exhibiting distinct botanical varieties discernible by their unique origin characteristics (MENEZES et al., 2018).
The Brazilian ‘cerrado’ biome features extensive biological diversity, acknowledged as the world’s richest savannah, harboring approximately 11,627 native plant species and over 58 fruit species (KLINK; MACHADO, 2005). These fruits serve primarily as food and are staples in the diets of local inhabitants (VIEIRA et al., 2006).
In the Amazon region, golden spoon is prevalent in the state of Tocantins, where it is commonly consumed fresh or processed into juices, preserves, ice creams, liqueurs, and jellies. The ripe fruit emits a distinct aroma reminiscent of aged cheese (SOBRINHO et al., 2020). For communities reliant on extractivism, golden spoon serves as a significant source of income, with its trade prevalent in open-air and public markets within its habitat (GUSMÃO et al., 2006).
Golden spoon (B. cydoniifolia), as well other varieties, holds importance not only for the quality of its fruits, which possess antioxidant (RUFINO et al., 2010) and nutraceutical (BICAS et al., 2011) properties, but also for its medicinal attributes, containing galacturonic acids, flavonoids, aromatic esters, among other compounds (SANNOMIYA et al., 2007). Additionally, it aids in preventing diseases such as cancer, depression, and diabetes (PAWLOWSKA et al., 2006).
The color and shape of golden spoon fruits exhibit a correlation, where phenotypes with yellowish epidermis tend to be wider, while those with green epidermis are more elongated. Senescence leads to a decrease in firmness and an increase in total soluble solids (PERALTA et al., 2020).
Biometric analyses of fruits and seeds serve as vital tools for detecting genetic variability within populations of the same species and inferring relationships between this variability and environmental factors (CRUZ; REGAZZI, 2012). This method is commonly employed in studies involving semi-evergreen and perennial species like Astrocasia jacobinensis (SANTOS et al., 2019) and ‘jatobá-da-mata’ (Hymenaea courbaril) (MOREIRA et al., 2019) aiding breeding programs by elucidating relationships between variability and environmental factors.
Morphological examinations of fruits and seeds of wild species are frequently conducted to enhance understanding of reproductive systems for future breeding programs.
These studies support research on germination, resistance, productivity, fruit quality, and cultivation techniques for domesticated species (MEDEIROS et al., 2019).
To ascertain genetic relationships among populations or genotypes of the same species, biometric methods analyzed through multivariate statistics are applied, consolidating data from multiple traits. Various techniques, including principal component analysis, canonical variables, and agglomerative methods, can be utilized for this purpose (CRUZ et al., 1994).
Therefore, the objective of this study was to analyze the genetic divergence and morphological traits among golden spoon individuals native to the eastern region of Mato Grosso, employing multivariate analysis techniques.
Materials and methods
Study site
Plant material (fruits) were collected from four native populations of B. cydoniifoliain the eastern region of Mato Grosso (Table 1 and Figure 1).

Geographic location of the four native populations ofB. cydoniifolia located in the eastern region of the state of Mato Grosso, Brazil. Source: the authors.
As per the Köppen classification, the climate in the region falls under the AW type, characterized by hot and humid conditions, featuring two distinct seasons: a rainy summer (October to March) and a dry winter (April to September). Annual precipitation averages 1578.9 mm, while the annual temperature stands at 25.6 °C (BARTIMACHI et al., 2008).
Situated in a region of sedimentary origin, these municipalities feature mountains and plateaus belonging to the Planalto do Alto Xingú-Araguaia and Planalto do Médio Rio das Mortes, encompassing formations like Serra das Gerais, Serra do Roncador, and Serra Azul. The prevailing vegetation in these areas is ‘cerrado’ (wooded savanna), characterized by extensive ‘campo cerrado’ (park savanna), remnants of ‘cerradão’ (forest savanna), gallery forests, ‘veredas’, and alluvial semideciduous seasonal forests.
To identify the species, four branches with leaves and inflorescences were collected during the flowering period (August/2021) from each population in areas of natural occurrence. The samples were transported to the Southern Amazon Herbarium (HERBAM) at the State University of Mato Grosso Carlos Alberto Reyes Maldonado, where they were prepared into exsiccates for subsequent description. The collection, preservation, and herborization followed the methodology proposed by Fidalgo and Bonomi (1989), and the material was cataloged under the record numbers: 26690, 26691, 26692, and 26693.
Characterization of fruits and seeds (pyrenes)
To estimate genetic divergence through fruit and seed (pyrene) morphology, fallen ripe fruits were collected in January 2022 from beneath the canopy of randomly selected trees within each study area (population).
Ten fruits were collected from each of ten plants (spaced 10 m apart) per population, totaling 100 fruits per population, in eastern Mato Grosso. The fruits were labeled, stored in plastic bags, and transported in a Styrofoam box with ice to the Laboratory of Plant Genetics and Molecular Biology (GenBioMol) at the Mato Grosso State University, Alta Floresta Campus, and refrigerated at -4 °C for evaluation ten days later.
Fruits were assessed using nine traits: fruit length (Fruit_L), width (Fruit_Wd), thickness (Fruit_T), and pulp thickness (Pulp_T), measured with a digital caliper (0-150 mm, 0.01-mm precision). Fruit weight (Fruit_Wg) and peel weight (Peel_Wg) were determined using a precision scale (0.00001 g precision). Pulp weight (Pulp_Wg) was calculated as Fruit_Wg - Seed_Wg - Peel_Wg.
Fruit volume (Fruit_V) was measured by the displacement of water in a 100-mL beaker.
Total soluble solids (TSS), expressed in °brix, were measured using a manual refractometer after enhancing the pulp’s visibility with 4 mL of water added via syringe.
Seeds were evaluated on six traits: length (Seed_L), width (Seed_Wd), and thickness (Seed_T), measured with a digital caliper (0- 150 mm, 0.01-mm accuracy). Seed weight (Seed_Wg) was determined using a precision scale. Seed volume (Seed_V) was calculated from the water displacement in a 100-mL beaker. The seed volume index (SVI) was computed as the sum of length, width and thickness (Seed_L + Seed_Wd + Seed_T), based on the method described by Basso (1999).
Statistical analysis
Multivariate analyses were conducted using principal components and cluster analyses, based on the hierarchical UPGMA (Unweighted Pair Group Method with Arithmetic Mean) and Tocher optimization methods, with the standardized average Euclidean distance serving as the dissimilarity measure. The relative importance of traits for phenotypic divergence was estimated using the method proposed by Singh (1981). These analyses were executed using the Genes computer program (CRUZ, 2016). For examining correlations among the evaluated trait, the Rbio software was utilized (BHERING, 2017).
Results and Discussion
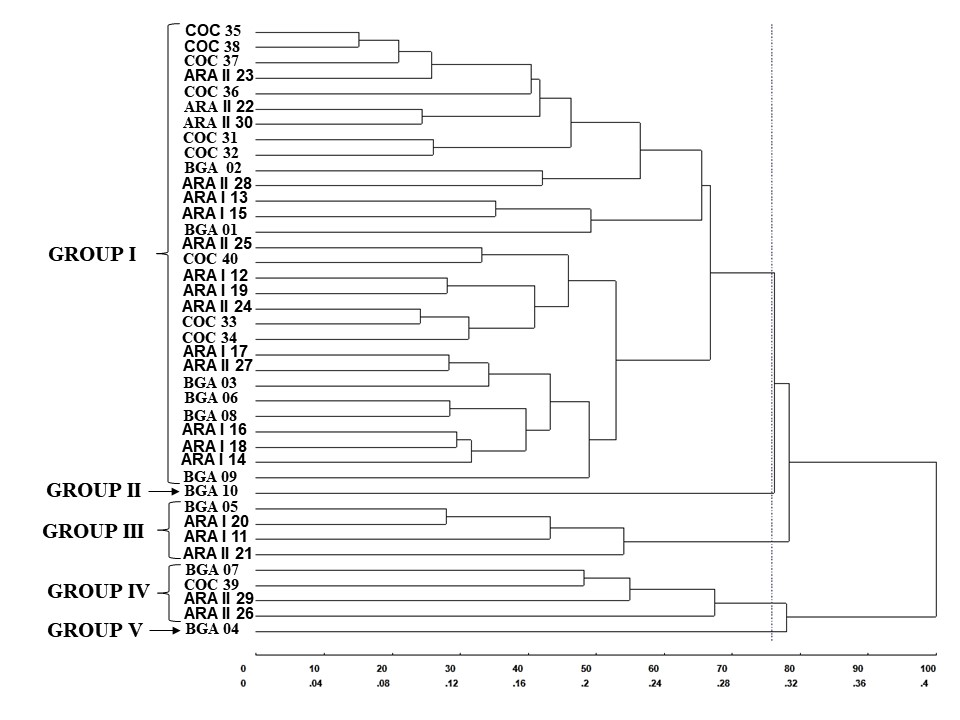
To investigate genetic divergence, the UPGMA method was applied with a cutoff point set at 76% distance as suggested by Mojena (1977). This resulted in the formation of five groups among the 40 individuals of B. cydoniifolia (Figure 2). Group I included the majority, with 30 individuals. Group II was comprised of a single individual, BGA10.

Dendrogram resulting from the analysis of 40 individuals of Byrsonima cydoniifolia, obtained by the UPGMA clustering method, using the average Euclidean distance as a measure of genetic distance. Cophenetic correlation coefficient (CCC) = 0.70.
Group III included individuals BGA05, ARA-I20, ARA-I11, and ARA-II21. Group IV was formed by individuals BGA7, COC39, ARA-II29, and ARA-II26. Group V was also a single-individual group, consisting of BGA04.
These results align with findings from previous research. Santos et al. (2020), assessing genetic variability using the UPGMA hierarchical method in Byrsonima crassifolia, observed a similar number of group formations.
The cophenetic correlation coefficient (r) was 0.70, which, according to Sokal and Rohlf (1962), indicates a good fit between the graphical representation of the distances and the original matrix. This suggests that the UPGMA clustering technique is particularly suitable for defining crosses as it clearly represents the distances between pairs of studied individuals. These findings are comparable to those of Santana et al.(2011), who worked with ‘umbu-cajazeira’ (Spondia spp) from the active tropical fruit germplasm bank at Embrapa Cassava and Fruits.
The UPGMA clustering method further separated the four populations of B. cydoniifolia into three distinct groups (Figure 3), with group I consisting of the ARA-I and ARA-II populations. Groups II and III each contained one population, COC and BGA, respectively.

Dendrogram generated by the UPGMA clustering method of four populations of Byrsonima cydoniifolia, based on 15 quantitative traits. Cophenetic correlation coefficient (CCC) = 0.98; Cutoff point = 89%.
The delineation of three distinct groups among the B. cydoniifolia populations by the UPGMA method provides relevant information for conservation strategies concerning the use of populations as genetic resources and for crossing. Recombination between distant groups could lead to the acquisition of superior genotypes (HENRIQUE et al., 2020).
Cluster analysis using the Tocher method (Table 2) successfully differentiated the 40 individuals into seven distinct groups.
Groups formed by the Tocher optimization method based on the average Euclidean distance, with 15 traits in fruits of 40 individuals of Byrsonima cydoniifolia.
The first group included 62.5% of the individuals, suggesting that although there are individuals with great genetic divergence among themselves, the majority are similar.
According to Silva et al. (2011), this indicates a narrow genetic base. Distinct physical and chemical traits from this first group are expected in individuals 13, 15, and 1 (Group II); 5, 11, and 21 (Group III); 34, 39, 7, 29, and 26 (Group IV); 2 and 31 (Group V); 10 (Group VI); and 4 (Group VII).
The Tocher optimization method categorizes individuals by ensuring that intra- group distances are always smaller than inter-group distances (CRUZ et al., 2004).
Similar findings were observed by Santos et al. (2020) while evaluating golden spoon plants in northern Mato Grosso.
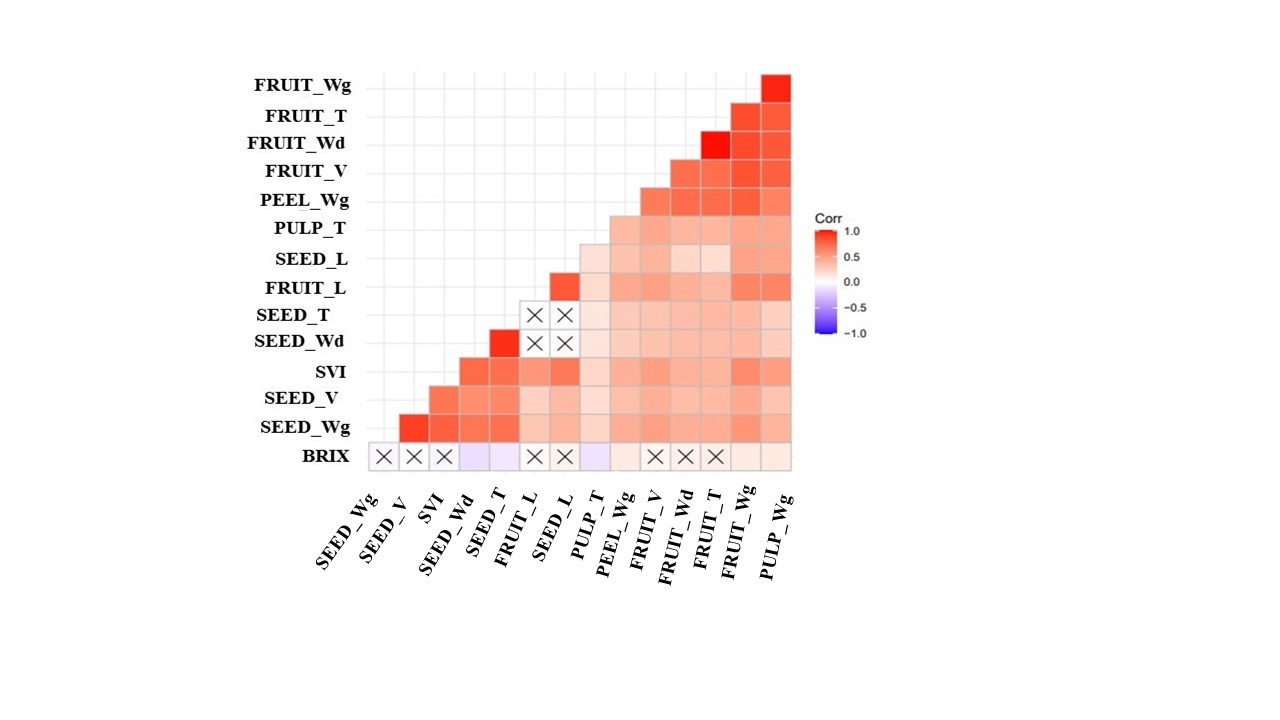
The heatmap (Figure 4) illustrated the correlation between variables, with values of zero displayed in white, indicating no correlation, as seen between seed thickness and shoot length, seed thickness and seed length, seed width and fruit length, seed width and seed length, among others.
Blue colors in the heatmap represented negative correlations, including some affecting the °Brix degree. In contrast, red colors indicated positive and highly significant correlations, such as between fruit weight and pulp weight, fruit thickness and fruit weight, fruit width and fruit thickness, among others, and, therefore, close to unity (Figure 4).
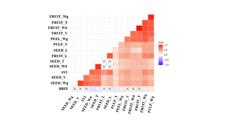
Correlations among 15 biometric variables in Byrsonima cydoniifolia. Fruit_W = fruit weight; Fruit_T = fruit thickness; Fruit_Wd = fruit width; Fruit_V = fruit volume; Peel_Wg = peel weight; Pulp_T = pulp thickness; Seed_L = seed length; Fruit_L = fruit length; Seed_T = seed thickness; Seed_W = seed width; SVI = seed volume index; Seed_V = seed volume; Seed_Wg = seed mass.
Similar findings were observed by Santos et al. (2020), who made correlations among 12 traits in Byrsonima crassifolia in the northern region of Mato Grosso. It is important to stress that understanding trait correlations aids in the selection process by defining how selection of one trait affects another and by facilitating the selection of traits that are challenging to measure (DIAS et al., 2021).
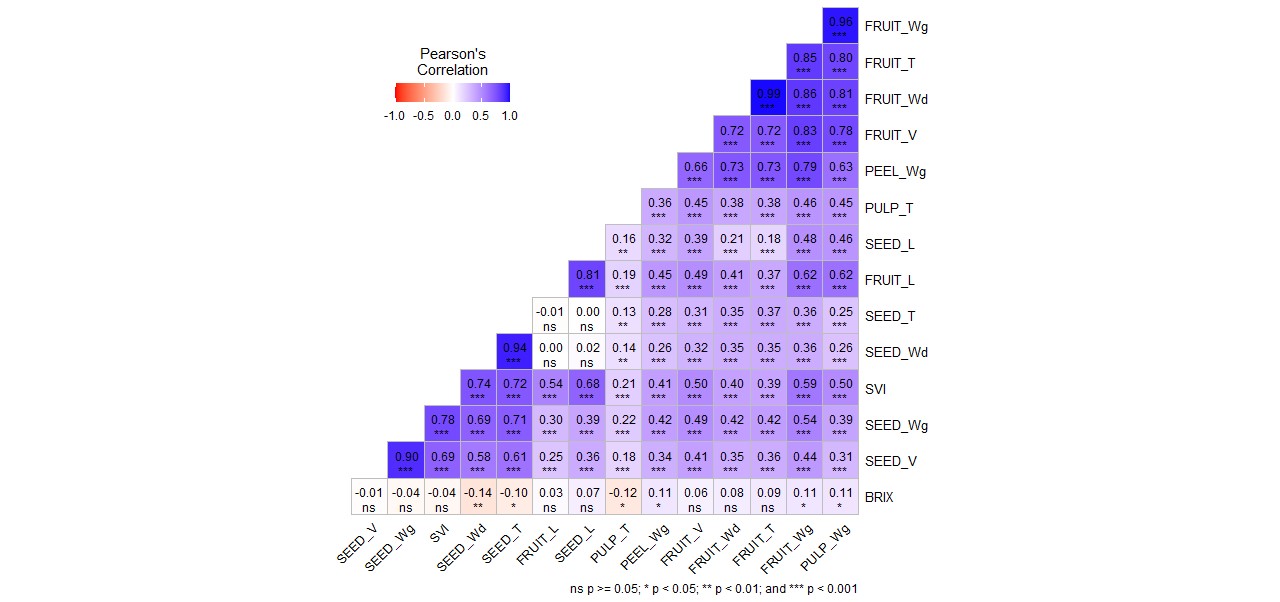
Among the 15 traits analyzed using Pearson’s linear correlations, 93 out of 105 correlations were found to be significant at a significance level of either 5% or 1%, representing approximately 89% of the correlation estimates. Of these significant correlations, 18 were of low magnitude (19.3%), 43 were moderate (46.2%), 20 showed a strong relationship (21.5%), and 12 were very strong (13%) (Figure 5). These results are comparable to those in the study by Pena et al. (2022), which employed mixed modeling to examine the genetic divergence of elite corn hybrids.

Simple linear correlations among 15 traits in Byrsonima cydoniifolia.ns: not significant; * and **: significant correlations at the 5% probability level; ***: significant correlations at the 1% probability level. A color legend on the left illustrates the correlation coefficients and their corresponding colors.
Among the traits evaluated, 83% were positively correlated and 1% negatively correlated at the 1% significance level.
Meanwhile, 5% exhibited both positive and negative correlations at the 5% significance level, and only 11% of the correlations were not significant. Strong positive correlations were observed between variables related to productivity in golden spoon. For example, the correlations between Fruit_Wg and Pulp_Wg were 0.96; Fruit_Wd and Fruit_T were 0.99; Fruit_L and Seed_L were 0.81, among others that correlated positively (Figure 5). This demonstrates a strong association between these variables, thereby allowing for the production of fruits with a greater weight. These results are similar to those of Santos et al. (2018), in studies on the biometrics of golden spoon fruits and seeds in the northern region of Mato Grosso, with the species Byrsonima crassifolia. There were also moderate correlations, such as Pulp_T and Peel_Wg at 0.36; Fruit_L and Fruit_V at 0.49; Seed_Wg and Fruit_V at 0.49; among others. Only the °Brix variable exhibited negative and low-magnitude correlations, such as with Seed_Wd at -0.14, Seed_T at -0.10, and Pulp_T at -0.12 (Figure 5). These findings align with those of Santos et al. (2018) in studies on the biometrics of golden spoon fruits and seeds in the northern region of Mato Grosso, specifically with Byrsonima crassifolia. The presence of moderate correlations among other variables suggests variability between traits. Tabarelli et al. (2003) suggest that variations between correlated traits could be linked to environmental factors like soil water and nutrient levels.
Principal component analysis showed that the first three components (PC1, PC2, and PC3) explained 83.83% of the total variation, with the first component accounting for 51.72% and the second component 71.09% of the cumulative variation (Table 3).
Estimates of the eigenvalues associated with the principal components, referring to the 15 fruit traits of 40 Byrsonima cydoniifolia individuals.
These values, exceeding the eighty percent threshold, are satisfactory for studying genetic divergence (CRUZ et al., 2012). This analysis aims to retain as much information as possible about the total variation in the initial data, enabling evaluation of the importance of each trait on the total variation and allowing for the discard of redundant (less discriminating) traits, which are either correlated with other traits due to their invariance or linear combinations of other traits (BARBOSA et al., 2006).
The results of this study aligned closely with those of Silva et al. (2013), who found that 83.25% of the total variation in mangaba fruits was captured in the first two principal components during their physical and chemical characterization. Similarly, Santos et al. (2020) observed 87.51% of the total variation in the first three principal components when studying the genetic divergence among golden spoon genotypes of B. crassifolia. These findings are instrumental for future efforts aimed at selecting genotypes for pre-breeding programs, conserving species, and identifying contrasting genotypes for potential promising crosses.
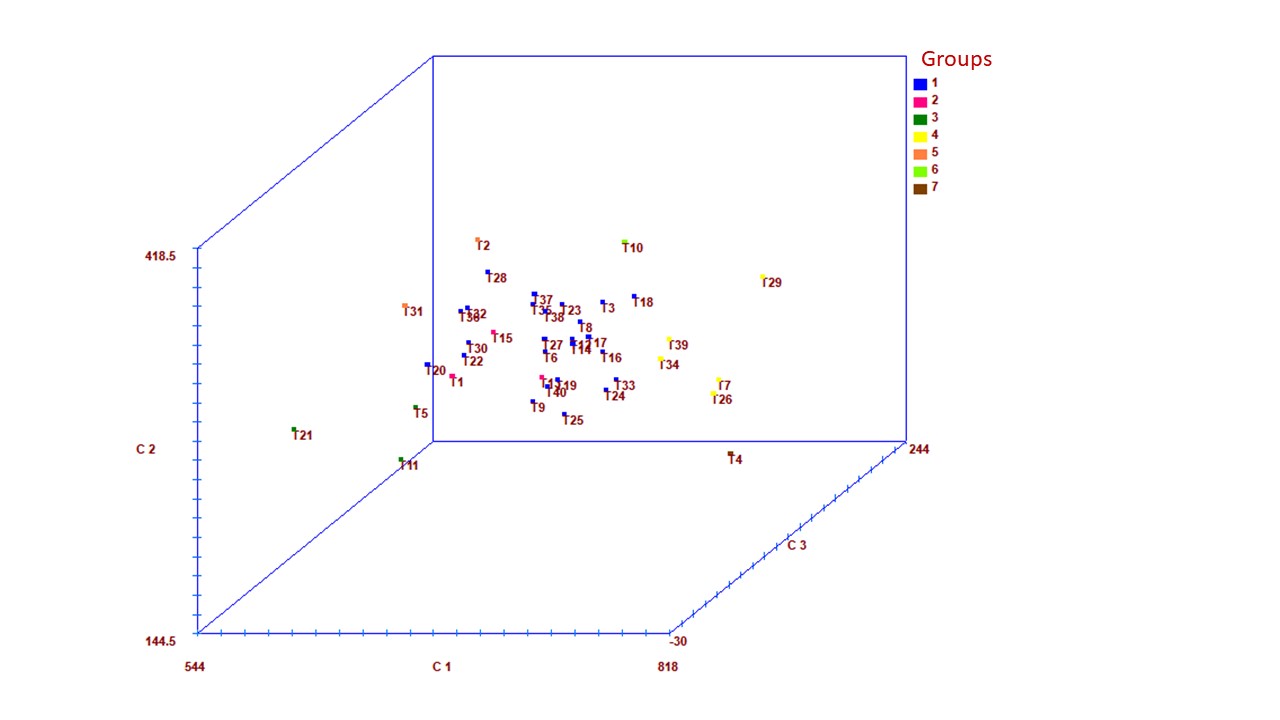
The graphical scatter based on these three principal components (Figure 6), using a three-dimensional model, resulted in the formation of seven distinct groups among the 40 individuals of golden spoon. The first group consisted of 25 individuals (ARAI20, ARAII22, ARAII30, ARAII28, COC32, ARAI18, BGA3, ARAII23, COC37, COC36, COC38, BGA8, ARAII27, ARAI14, ARAI17, ARAI16, BGA6, COC33, ARAI19, COC40, ARAII24, BGA9, ARAII25, COC35, and ARAI12); the second group comprised three individuals (BGA1, ARAI15, and ARAI13); the third group also included three individuals (ARAII21, BGA5, and ARAI11); the fourth group contained five individuals (BGA7, ARAII26, ARAII29, COC34, and COC39); the fifth group had two individuals (BGA2 and COC31); the sixth group was formed by just one individual (BGA10); and the seventh group also by a single individual (BGA4).

Scatter plot of the first, second, and third principal components (C1, C2, and C3) for 15 fruit and seed traits evaluated in 40 Byrsonima cydoniifolia individuals.
Analysis of the clustering methods showed that both the Tocher optimization method (Table 2) and the scatter plot (Figure 6) categorized the 40 golden spoon individuals into the same groups. However, compared to the UPGMA hierarchical method (Figure 2), the agreement on group formation was only partial. Notably, individuals 4 and 10 remained in separate groups from each other and from the others across the three methods. These genotypes demonstrated phenotypic divergence for fruit length, width, and thickness, as well as seed length, among the plants in the populations under study.
Similar results were found by Santos et al.(2020), studying the divergence among genotypes of B. crassifolia.
The relative contribution to the expression of genetic divergence, as identified by Singh’s method (1981), found that the °Brix trait most significantly contributed to individual differentiation, accounting for 26.11% of the total. Additional traits, including Fruit_L (19.45%), Fruit_Wd (12.53%), Fruit_T (12.51%), SVI (12.73%), and Seed_L (7.87%), collectively accounted for 65.09% of the total contribution (Table 4). Fruit volume, pulp thickness, fruit weight, seed width, and seed thickness contributed similarly in distinguishing individuals. Conversely, the traits contributing the least to genetic divergence, with values below 1%, were seed weight, peel weight, pulp weight, and seed volume (Table 4).
Estimates of the relative contributions of each trait (Sj) to the divergence of Byrsonima cydoniifoliaindividuals using the method of Singh (1981).
Conclusions
The clustering methods indicate genetic divergence among the evaluated golden spoon individuals. Individuals BGA04 and BGA10 emerged as the most suitable for future breeding programs, conservation of the species and inclusion in germplasm banks.
The analysis of the first three principal components provides sufficient data to effectively study the genetic divergence of the species.
Most traits exhibit positive correlations; however, the °Brix variable is negatively correlated with some variables.
The °Brix trait makes a greater relative contribution to the phenotypic divergence among the golden spoon individuals.
All analyses evidence that the studied populations possess variability that could be explored in breeding programs.
Acknowledgments
Thanks are extended to the GENBIOMOL laboratory team and the Coordination for the Improvement of Higher Education Personnel (CAPES).
References
-
BARBOSA, L.; LOPES, P.S.; REGAZZI, A.J.; GUIMARÃES, S.E.F.; TORRES, R. Avaliação de características de qualidade da carne de suínos por meio dos componentes principais. Revista Brasileira de Zootecnia, Viçosa, MG, v.35, n.4, p.1639-45, 2006. https://doi.org/10.1590/S1516-35982006000600009
» https://doi.org/10.1590/S1516-35982006000600009 -
BARTIMACHI, A.; NEVES, J.; PEDRONI, F. Predação pós-dispersão de sementes do angico Anadenanthera falcata (Benth.) Speg. (Leguminosae-Mimosoideae) em mata de galeria em Barra do Garças, MT. Brazilian Journal of Botany, São Paulo, v.31, n.2, p.215-25, 2008. https://doi.org/10.1590/S0100-84042008000200004
» https://doi.org/10.1590/S0100-84042008000200004 -
BHERING, L.L. Rbio: a tool for biometric and statistical analysis using the R platform. Crop Breeding and Applied Biotechnology, Viçosa, MG, v.17, p.187-90, 2017. https://doi.org/10.1590/1984-70332017v17n2s29
» https://doi.org/10.1590/1984-70332017v17n2s29 -
BICAS, L.J.; MOLINA, G.; DIONÍSIO, A.P.; BARROS, C.F.F.; WAGNER, R.; MARÓSTICA, J.M.R. Volatile constituents of exotic fruits from Brazil. Food Research International, Ottawa, v.44. n.7, p.1843-55, 2011. https://doi.org/10.1016/j.foodres.2011.01.012
» https://doi.org/10.1016/j.foodres.2011.01.012 -
CRUZ, C.D. Genes Software – extended and integrated with the R, Matlab and Selegen. Acta Scientiarum, Maringá, v.38, n.4, p.547-52, 2016. https://doi.org/10.4025/actasciagronv38i4.32629
» https://doi.org/10.4025/actasciagronv38i4.32629 - CRUZ, C.D.; REGAZZI, A.J.; CARNEIRO, P.C.S. Modelos biométricos aplicados ao melhoramento genético 4.ed. Viçosa: UFV, 2012. v.1, 514 p. Available from: https://www.scirp.org/(S(lz5mqp453edsnp55rrgjct55.))/reference/referencespapers.aspx?referenceid=1502833
-
DIAS, A.O.; NETO, P.R.M.; MAGALHÃES, A.P.; NETO, S.V.C.; MIRANDA, Z.P. Caracterização morfométrica de frutos e sementes e aspectos morfológicos da germinação e plântula de mangaba (Hancornia speciosa Gomes) nativa da savana amapaense. Research, Society and Development, Itabira, v.10, n.13, p.e193101321176, 2021. https://doi.org/org./10.33448/rsd-v10i13.1321176
» https://doi.org/org./10.33448/rsd-v10i13.1321176 - FIDALGO, O.; BONONI, V.L.R. Técnicas de coleta, preservação e herborização de material botânico São Paulo: Instituto de Botânica, 1989. 62p. Available from: https://www.infraestruturameioambiente.sp.gov.br/institutodebotanica/1989/01/tecnicas-de-coleta-preservacao-e-herborizacao-de-material-botanico/
- GUSMÃO, E.; VIEIRA, F.A.; FONSECA JÚNIOR, E.M. Biometria de frutos e endocarpos de murici (Byrsonima verbascifolia Rich. ex A. Juss.). Cerne, Lavras, v.12, n.1, p.84-91, 2006.
- HENRIQUE, L.A.V.; POLETINEL, J.P.; BRONDANIL, S.T.; BARELLI, M.A.; SILVA, V.P. Caracterização morfoagronômica e divergência genética de acessos de feijão comum. Journal of Agronomic Sciences, Umuarama, v.9, n.especial, p.128-48, 2020.
- KLINK, C.A.; MACHADO, R.B. A conservação do Cerrado brasileiro. Megadiversidade, Belo Horizonte, v.1, n.1, p.147-55, 2005.
-
MEDEIROS, J.X. de; FELICIANO, A.L.P.; MEDEIROS, J.E. de; SANTOS, H.H.D.; MATOS, V.P. Morfologia da germinação de sementes de senna cana (Nees and amp; Mart.) H.S. Irwin and Barneby. Nativa, Sinop, v.7, n.6, p.784-8, 2019. https://doi.org/10.31413/nativa.v7i6.8626
» https://doi.org/10.31413/nativa.v7i6.8626 -
MENEZES, A.P.A; RESENDE-MOREIRA, L.C; BUZATTI, R.S.O; NAZARENO, A.G; CARLSEN, M; LOBO, F.P; LOVATO, M.B. Chloroplast genomes of Byrsonima species (Malpighiaceae): comparative analysis and screening of high divergence sequences. Scientific Reports, London, v.8. n.1, p.1–12, 2018. https://doi.org/10.1038/s41598-018-20189-4
» https://doi.org/10.1038/s41598-018-20189-4 -
MOJENA, R. Hierarquial grouping methods and stopping rules: an evaluation. The Computer Journal, Oxford, v.20, p.359-63, 1977. https://doi.org/10.1093/comjnl/20.4.359
» https://doi.org/10.1093/comjnl/20.4.359 -
MOREIRA, A.M.; MOREIRA, A.C.M.; BUENO, E.S.; AZEVEDO, L.S.; DINIZ, V.S.S. Biometria de frutos e sementes e emergência de plântulas de duas espécies do gênero hymenaea (fabaceae). Enciclopédia Biosfera, Goiânia, v.16, n.29, 2019. https://doi.org/10.18677/EnciBio_2019A32
» https://doi.org/10.18677/EnciBio_2019A32 -
PAWLOWSKA, M.; DE LEO, M.; BRACA, A. Phenolics of Arbutus unedo L. (Ericaceae) fruits:? identification of anthocyanins and gallic acid derivatives. Journal of Agricultural and Food Chemistry, Easton, v.54, n.26, p.10234-8, 2006. https://doi.org/10.1021/jf062230o
» https://doi.org/10.1021/jf062230o -
PENA, G.F; MAFRA, G.S; FAZ AMARAL JÚNIOR, A.T; ALFENAS, R.F; BHERING, L.L; SANTOS, J.S; KAMPHORST, S.H; DE LIMA, V.J; DE OLIVEIRA SANTOS, T.; BISPO, R.B. Mixed modeling in genetic divergence study of elite popcorn hybrids (Zea mays var. everta). Agriculture, Basel, v.12, n.7, p.910, 2022. https://doi.org/10.3390/agriculture12070910
» https://doi.org/10.3390/agriculture12070910 -
PERALTA, M.A.M.; SANTILLAN, P.S.; GARCIAL, A.R.R.; LAGARDA, J.L.V.LUZARDO, M.B.B.; GUTIÉRREZ, L.A. Caracterización y evaluación de frutos de ‘nanche’ (Byrsonima crassifolia L.). Revista Mexicana de Ciencias Agrícolas Texcoco, v.11, n.1, 2020. https://doi.org/10.29312/remexca.v11i1.1950
» https://doi.org/10.29312/remexca.v11i1. -
RUFINO, M.M.S.; ALVES, E.R.; DE BRITO, S.E.; PÉREZ-JIMÉNEZ, J.; SAURA-CALIXTO, F.; MANCINI FILHO, J. Bioactive compounds and antioxidant capacities of 18 non-traditional tropical fruits from Brazil. Food Chemistry, London, v.121, n.4, p.996-1002, 2010. https://doi.org/10.1016/j.foodchem.2010.01.037
» https://doi.org/10.1016/j.foodchem.2010.01.037 -
SANNOMIYA, M.; CARDOSO, C.R.P.; FIGUEIREDO, M.E.; RODRIGUES, C.M.; DOS SANTOS, L.C.; DOS SANTOS, F.v.; SERPELONI, J.M.; CÓLUS, I.M.S.; VILEGAS, E.A.W.VARANDA, E.A. Avaliação mutagênica e investigação química de Byrsonima intermedia A. Juss. extratos de folhas. Journal of Ethnopharmacology, Amsterdam, v.112. n.2, p.319-26, 2007. https://doi.org/10.1016/j.jep.2007.03.014
» https://doi.org/10.1016/j.jep.2007.03.014 -
SANTANA, I.B.B.; OLIVEIRA, E.J.; SOARES FILHO, W.S.; RITZINGER, R.; AMORIM, E.P.; COSTA, M.A.P.C.; MOREIRA, R.F.C. Variabilidade genética entre acessos de umbu-cajazeira mediante análise de marcadores ISSR. Revista Brasileira de Fruticultura, Jaboticabal, v.33, p.868-76, 2011. https://doi.org/10.1590/S0100-29452011005000090
» https://doi.org/10.1590/S0100-29452011005000090 -
SANTOS, J.F.L.; SANTOS, D.B.; ROSSI, A.A.B.; PENA, G.P.; TIAGO, A.V.Caracterização biométrica de frutos e sementes de murici (Byrsonima crassifólia L.) na região norte do Mato Grosso, Brasil. Enciclopédia Biosfera, Goiânia, v.15 n.27, p.1, 2018.https://doi.org/10.18677/EnciBio_2018A24
» https://doi.org/10.18677/EnciBio_2018A24 -
SANTOS, J.F.L.; ROSSI, A.A.B.; PENA, G.P.; TIAGO, A.v.; ZORTÉA, K.E.; CARDOSO, E.S.; PEDRI, E.C.M.; SANTOS, I.C.B.; SANTOS, D.B.; SANTOS, I.R.B. Morfologia, viabilidade polínica e índice meiótico de Byrsonima crassifolia (L.) Kunth. Brazilian Journal of Development, Curitiba, v.6, n.6, p.37514-36, 2020. https://doi.org/10.34117/bjdv6n6-328
» https://doi.org/10.34117/bjdv6n6-328 -
SILVA, G.C.; OLIVEIRA, F.J.; ANUNCIAÇÃO FILHO, C.J.; SIMÕES NETO, D.E.; MELO, L.J.O.T. Divergência genética entre genótipos de cana-de-açúcar. Revista Brasileira de Ciências Agrárias, Recife, v.6, p.52-8, 2011. https://doi.org/10.5039/agraria.v6i1a848
» https://doi.org/10.5039/agraria.v6i1a848 -
SILVA, S.S.; CRUZ, E.M.O.; REIS, R.V.; FERREIRA, C.P.; PASSOS, A.R.Caracterização morfológica e molecular de genótipos de mangaba. Revista Brasileira de Fruticultura, Jaboticabal, v.35, n.4, p.1093-100, 2013.https://doi.org/10.1590/S0100-29452013000400021
» https://doi.org/10.1590/S0100-29452013000400021 -
SINGH, K. On the asymptotic accuracy of Efron's bootstrap. The Annals of Statistics, San Francisco, v.9, n.6, p.1187-95, 1981. https://doi.org/10.1214/aos/1176345636
» https://doi.org/10.1214/aos/1176345636 -
SOBRINHO, A.C.G.; ROGEZ, H.L.G.; NASCIMENTO,V.H.A.do, TEIXEIRA, B.J.B.; DIAS, A.L.DE S.; SOUZA, J.N.S. de. Determinação de compostos bioativos e capacidade sequestradora de radicais livres em extratos de folhas de Byrsonima crassifolia e Inga edulis. Brazilian Journal of Development, Curitiba, v.6, n.6, p.34954-69, 2020. https://doi.org/10.34117/bjdv6n6-147
» https://doi.org/10.34117/bjdv6n6-147 -
SOKAL, R.R.; ROHLF, F.J. The comparison of dendrograms by objective methods. Taxonomy, Basel, v.11, n.2, p.33-40, 1962. https://doi.org/10.2307/1217208
» https://doi.org/10.2307/1217208 -
TABARELLI, M.; VICENTE, A.; BARBOSA, D.C.A. Variation of seed dispersal spectrum of woody plants across a rainfall gradient in northeastern Brazil. Journal of Arid Environments, London, v.53, n.2, p.197-210, 2003. https://doi.org/10.1006/jare.2002.1038
» https://doi.org/10.1006/jare.2002.1038 - VIEIRA, R.F.; AGOSTINI, C.T.; SILVA, D.B.; FERREIRA, F.R.; SANO, S.M. Frutas nativas da região centro-oeste Brasília: Embrapa Recursos Genéticos e Biotecnologia, 2006. 320p. Available from: https://www.researchgate.net/profile/Josue-Junior/publication/265250187_Araca/links/54062bcc0cf2c48563b248f1/Araca.pdf
Edited by
-
Scientific Editor
Alexandre Pio Viana
-
Associate Editor
Willian Krause