ABSTRACT
Water deficit is one of the major stresses affecting plant growth and productivity worldwide. Plants induce various morphological, physiological, biochemical and molecular changes to adapt to the changing environment. Safflower (Carthamus tinctorius L.), a potential oil producer, is highly adaptable to various environmental conditions, such as lack of rainfall and temperatures. The objective of this work was to study the physiological and production characteristics of six safflower lines in response to water deficit followed by rehydration. The experiment was conducted in a protected environment and consisted of 30 days of water deficit followed by 18 days of rehydration. A differential response in terms of photosynthetic pigments, electrolyte leakage, water potential, relative water content, grain yield, oil content, oil yield and water use efficiency was observed in the six lines under water stress. Lines IMA 04, IMA 10, IMA 14 showed physiological characteristics of drought tolerance, with IMA 14 and IMA 16 being the most productive after water deficit. IMA 02 and IMA 21 lines displayed intermediate characteristics of drought tolerance. It was concluded that the lines responded differently to water deficit stress, showing considerable genetic variation and influence to the environment.
Key words:
Carthamus tinctorius L.; drought physiology; irrigation; water use efficiency; yield.
INTRODUCTION
Safflower (Carthamus tinctorius L.) is one of the world’s oldest cultivated crops. It is an oilseed crop, from the Asteraceae family, not very popular compared to other oil crops such as soybean, sunflower and peanut because it is not widely cultivated around the world (Canavar et al. 2014).
The areas with safflower production are generally without irrigation, in arid and semiarid climates with low agricultural potential, and without additional use of fertilizers (Hojati et al. 2011HOJATI M, MODARRES-SANAVY SAM, KARIMI M AND GHANATI F. 2011. Responses of growth and antioxidant systems in Carthamus tinctorius L. under water deficit stress. Acta Physiol Plant 33: 105-112.).
Safflower cultivation has expanded in the Asian, European and American continents, due to it’s ability to overcame environment stresses, as well as to the recognition of its numerous utilities, such as, a source of good quality oil, high value for industrial and food purposes and for ornamental use (Sehgal et al. 2009SEHGAL D, RAINA SN, DEVARUMATHA RM, SASANUMA T AND SASAKUMA T. 2009. Nuclear DNA assay in solving issues related to ancestry f the domesticated diploid safflower (Carthamus tinctorius L.) and the polyploid (Carthamus) taxa, and phylogenetic and genomic relationships in the genus Carthamus L. (Asteraceae). Mol Phylogenet Evol 53: 631-644.). In recent years, its importance has been growing, mainly for the production of biofuels (Canavar et al. 2014).
The total area of safflower harvested in the world was 1 million ha in 2014, totaling a production of 867 thousand tons of seeds. Asia is the largest producing region in the world, accounting for 51.5% of production, with a harvested area of 574 thousand ha, followed by the Americas with 35.6% and 281 thousand ha. The production of safflower grains increased by 20.82% in 2014 compared to 2013, the harvested area increased by 13.49% and productivity by 6.44% (Faostat 2014). According to Faostat (2014), the world production of safflower oil was 106 thousand tons, and the main producing region is Americas, responsible for 58% of production, followed by Asia, with 40.2%.
Water deficit is one of the major problems that affect most of the growing areas of the world, and has been the main factor limiting crop productivity. Water stress affects mainly regions without irrigation and poor rainfall distribution.
Plants can adapt to water deficit by inducing various morphological, physiological, biochemical and molecular changes, thus, drought tolerance is defined as the ability to grow, bloom and produce in low water availability (Faraooq et al. 2009). The maintenance of a satisfactory water status in plants exposed to water deficit conditions is an important adaptation to drought (Canavar et al. 2014).
Species differ in their response to water deficit and recovery from stress (Foster et al. 2015FOSTER K, LAMBERS H, REAL D, RAMANKUTTY P, CAWTHRAY GR AND RYAN MH. 2015. Drought resistance and recovery in mature Bituminaria bituminosa var. albomarginata. Ann Appl Biol 166: 154-169.). The recovery may be incomplete and depends on plant age, stress severity and species, and it is attributed to various morphological, physiological and biochemical characteristics, such as maintenance of membrane stability, osmotic adjustment and phytohormone accumulation (Shi et al. 2014SHI J, YASUOR H, YERMIYAHU U, ZUO Q AND BEN-GAL A. 2014. Dynamic responses of wheat to drought and nitrogen stresses during re-watering cycles. Agric Water Manage 146: 163-172., Hu et al. 2010HU L, WANG Z AND HUANG B. 2010. Diffusion limitations and metabolic factors associated with inhibition and recovery of photosynthesis from drought stress in C3 perennial grass species. Physiol Plant 139: 93-106., Xu et al. 2009XU Z, ZHOU G AND SHIMIZU H. 2009. Are plant growth and photosynthesis limited by pre-drought following rewatering in grass? J Exp Bot 60: 3737-3749.).
Many studies have indicated that when subjected to water deficit, the leaves of different crops exhibit a large reduction of the relative water content (RWC) and water potential (Ψw) (Hojati et al. 2011HOJATI M, MODARRES-SANAVY SAM, KARIMI M AND GHANATI F. 2011. Responses of growth and antioxidant systems in Carthamus tinctorius L. under water deficit stress. Acta Physiol Plant 33: 105-112., Faraooq et al. 2009).
Leaf chlorophyll content is a fundamental variable for the understanding of plant responses to the environment and it is a potential indicator of the degree of stress, since it has a direct role in the photosynthetic process of light capture and electron transport (Schlemmer et al. 2005SCHLEMMER MR, FRANCIS DD, SHANAHAN JF AND SCHEPERS JS. 2005. Remotely measuring chlorophyll content in corn leaves with differing nitrogen levels and relative water content. Agron J 97: 106-112.). In addition, water deficit is responsible for the loss of pigments indicating that susceptible plants tend to have a reduced chlorophyll content, which leads to a reduction of the leaf photosynthetic activity (Homayoun et al. 2011HOMAYOUN H, SAM DALIRI M AND MEHRABI P. 2011. Effect of drought stress on leaf chlorophyll in corn cultivars (Zea mays). Middle East J Sci Res 9: 418-420.).
The cell membranes are also affected by water deficit. According to Farooq et al. (2009FAROOQ M, WAHID A, KOBAYASHI N, FUJITA D AND BASRA SMA. 2009. Plant drought stress: effects, mechanisms and management. Agron Sustain Dev 29: 185-212.), changes in cell membranes may be one of the earliest signs of stress. The membrane has great importance in maintaining the viability of the cell, promoting osmotic and ionic equilibrium between the cell, its components and the environment, therefore, the maintenance of the integrity and stability of the membranes is a mechanism of stress tolerance (Bajji et al. 2002BAJJI M, KINET JM AND LUTTS S. 2002. The use of the electrolyte leakage method for assessing cell membrane stability as a water stress tolerance test in durum wheat. Plant Growth Regul 36: 61-70.).
Safflower has favorable characteristics for cultivation under the conditions present in all regions of the Brazilian territory, due to its adaptability, to drought and heat, and low cost of production, and it can be an alternative planting in the off season. It is fundamental to know and identify physiological characteristics related to the capacity to maintain water status and plant productivity helping to understand the mechanisms of drought tolerance of safflower lines and improve the knowledge about the crop and techniques of culture. The increasing consumption of vegetable oil and need for ornamental flowers, are important factors that shows necessity of extension of safflower research programs. Thus, the objective of this work was to evaluate the physiological and productivity characteristics of six safflower lines in response to water deficit and rehydration capacity, in order to assist in the selection of lines that best adapt to arid and semiarid regions.
MATERIALS AND METHODS
SITE DESCRIPTION
The experiment was carried out in a protected environment without temperature and humidity control, located in the Department of Crop Production and Breeding of the School of Agricultural Sciences - UNESP, in Botucatu - São Paulo, Brazil (22º51’01” South latitude and 48º25’55” West longitude and 800.1 m above sea level), between May and October 2014.
PLANT MATERIAL
Six lines of safflower, IMA 02, IMA 04, IMA 10, IMA 14, IMA 16 and IMA 21, with the same growth stage, were evaluated under two water regimes, field capacity and 50% of field capacity. The lines were provided by the Instituto Matogrossense do Algodão (IMA, MT, Brazil).
Each experimental unit consisted of a box, 0.57 m high, 1.0 m long and 0.8 m wide, with drainage, covering 0.8 m2 of surface and containing approximately 300 L of soil, classified as clay loam fluvicinceptisol, medium texture, obtained from an agricultural production environment. Soil pH was 5.6 and organic matter was 9 g dm-3, 34 mg dm-3 content of P, with 18, 1.4, 78, 29, 108 mmol dm-3 for, H + Al, K, Ca, Mg and sun of bases (SB), and cation exchange capacity (CEC) was 126 and base saturation (V%) was 86. Each box contained two rows, spaced 0.5 m between rows, with eight safflower plants in each row, and 0.1 m spaced between plants.
All the boxes were maintained at field capacity (FC) for up to 55 days after sowing (DAS), corresponding to the vegetative phase of stem elongation and branching. After this, the plants were exposed to a moderate water deficit stress for a period of 30 days. In the treatment without a deficit (-D) the plants were watered with the amount necessary to maintain the ideal moisture content in the soil, around -10 KPa (corresponding to 100% field capacity), while in the treatment with a deficit (+D), the plants were maintained with 50% of the moisture content, characterized as moderate stress.
After the 30 day deficit period, the plants were rehydrated for 18 days, restoring the water supply corresponding to 100% field capacity.
On average, field capacity required applying a total of 423, 485, 473, 519, 439 and 464 mm, and in the treatment of water deficit followed by rehydration requires 279, 307, 301, 356, 327 and 260 mm of water for the lines, IMA 02 , IMA 04, IMA 10, IMA 14, IMA 16 and IMA 21, respectively.
DATA COLLECTION
The evaluations were carried out at two periods, 30 days after plant exposure to water deficit (85 DAS), and 18 days after the end of the water deficit (plant recovery) (103 DAS). The harvest was at 161 DAS.
PHOTOSYNTHETIC PIGMENTS
The photosynthetic pigments were determined from leaves collected from the upper third of the plants and taken to the laboratory, where two leaf discs (0.69 cm2 each) were sampled from the leaf blade by a punch between the edge and the central leaf rib. The values of chlorophyll a, chlorophyll b, chlorophyll total (a + b) and carotenoids were determined according to the methodology described by Lichtenthaler (1987), in which the absorbance reading of 1 mL of chlorophyll extract diluted in 1 mL of deionized water was performed in spectrophotometer (7315, Jenway, Staffordshire, UK) at wavelengths of 470, 645 and 663 nm.
ELECTROLYTE LEAKAGE
The evaluations of electrolyte leakage were determined through indirect determination. Ten leaf discs of 0.69 cm2 in diameter were collected from fully expanded leaves of the upper third of each plant. The methodology of Scotti Campos and Pham Thi (1997) was used and electrolyte leakage was expressed as the percentage of initial conductivity (IC) in relation to total conductivity (TC), according to equation 1:
LEAF WATER POTENTIAL
The evaluation of leaf water potential occurred between 09:00 and 11:00 a.m. Leaves were collected from the upper third of the plants and the readings taken at the tip of these leaves using a pressure chamber (Scholander, Soil Moisture Equipment, Santa Barbara, CA, USA).
RELATIVE WATER CONTENT
Two discs (0.69 cm2 each) were extracted from the leaves to determine the leaf relative water content (RWC). The fresh tissue mass (Mf), the turgid tissue mass (Mt) and the dry tissue mass (Md) of the discs were determined using a precision analytical balance. The RWC was calculated, according to the methodology of Jamaux et al. (1997JAMAUX I, STEINMETZ A AND BELHASSEN E. 1997. Looking for molecular and physiological markers of osmotic adjustment in sunflower. New Phytol 137: 117-127.), using equation 2:
GRAIN YIELD
The grain yield was obtained by harvesting all plants in the plot, and, combining their grain weight, which was converting to kg ha-1.
OIL CONTENT (%)
Oil content was determined using a Time-domain nuclear magnetic resonance (TD-NMR), spectrometer (Model SLK-SG-200, Spinlock Magnetic Resonance Solutions, Malagueño, Córdoba, Argentina).
OIL YIELD
The oil yield (kg ha-1) was calculated using equation 3:
WATER USE EFFICIENCY
Water use efficiency (WUE) was evaluated at the end of the experiment, so the values represent the performance of each line after undergoing water deficit and rehydration regimes.
WUE is given in terms of the yield weight per amount of irrigation (mm) during the experiment and evaluated as (kg ha-1 mm-1), according to equation 4:
Irrigation represents the amount of irrigation (mm) during the experiment.
EXPERIMENTAL DESIGN AND STATISTICAL ANALYSIS
The experiment was conducted under a randomized complete block design with four replicates. Physiological parameters were analyzed in a 6 x 3 factorial scheme. The first factor was composed of six safflower lines and the second factor consisted of three water regimes (control, deficit, rehydration). Productivity parameters were analyzed at the end of the experimental period, in a 6 x 2 factorial scheme. The first factor was composed of six safflower lines and the second factor consisted of two water regimes (control, deficit followed by rehydration).
The data were analyzed for normality test and an analysis of variance (ANOVA), and Tukey test was used. Data were submitted to the multivariate principal component analysis. Data were considered significant at p≤0.05. Data analyzes was performed using the statistical software Sisvar version 5.3.
RESULTS
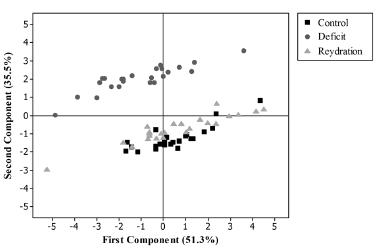
The principal component analysis provided an overview of all the physiological parameters evaluated for the different treatments. The results showed a clear separation between the treatments, as seen in Figure 1. Irrigated, water deficit and rehydration conditions formed three distinct groups, indicating that the treatments influenced the evaluated traits. It should be noted that the plants in the rehydration treatment did not fully recover after rehydration, being positioned between the values of the traits under irrigation and under water deficit (Fig. 1).
Distribution of the evaluation periods of safflower lines, according to first and second principal components, irrigated (before water deficit), water deficit (for 30 days), and rehydration (for 18 days).
Regarding the principal components analyses, the first component (PC1) explains 51.3% of the data variability and the second component (PC2) explains 35.5% (Table I). The most significant variables, in descending order in PC 1, were total chlorophyll content, chlorophyll a content, carotenoids, chlorophyll b content, water potential and electrolyte leakage (Table I). These traits were highlighted in the differentiation of lines during water deficit followed by rehydration.
Correlation coefficients between the principal components (PC1 and PC2) and the physiological characteristics of the safflower lines (IMA 02, IMA 04, IMA 10, IMA 14, IMA 16 and IMA 21) for three evaluation periods: before water deficit, after 30 days of water deficit and after 18 days of rehydration .
PHOTOSSYNTHETIC PIGMENTS
The photosynthetic pigments, chlorophyll a, and b, were significantly affected by the lines, water regime and interaction (p≤0.05). Total chlorophyll and carotenoid were significantly affected by the lines and the interaction between the factors.
Regarding to chlorophyll a, was observed an increase in the content after rehydration for line IMA 10 (Table II). In general, lines IMA 10 and IMA 14 had the highest production of chlorophyll a, b (Table II), total chlorophyll and carotenoid (Table III). Line IMA 16 had the lowest chlorophyll a, b, total and carotenoid content production.
The greatest damage caused by the water deficit in the chlorophyll a content was observed in lines IMA 04 and IMA 16, with reductions of 10.9 and 15.5%, respectively. Lines IMA 14 and IMA 21 had an increase of 37.1 and 2.1%, respectively, while lines IMA 02 and IMA 10 mostly maintained similar values.
Considering the chlorophyll b content, the highest decrease under water deficit was observed in lines IMA 02, IMA 04 and IMA 16, with 23.3, 25.2 and 23.2%, respectively, while line IMA 10 had a reduction of only 18.7%. On the other hand, the lines IMA 14 and IMA 21 showed an increase of 36.1% and 2.9%, respectively. Regarding the amount of total chlorophyll, the greatest reduction after water deficit was verified in the lines IMA 04 and IMA 16, of 14.5 and 17.5%, respectively. Line IMA 14, had an increase of 36.8%, followed by line IMA 21 (2.3%), while lines IMA 02 and IMA 10 showed the lowest reduction rates, 8.7 and 2.3%, respectively.
Concerning about carotenoid content, line IMA 16 had the highest reduction after stress, of 9.7%, while line IMA 14 had an increase of 33.2%, confirming a higher tolerance to water stress. Lines IMA 02 and IMA 21 showed an increase of 1.5 and 0.7%, respectively, and lines IMA 04 and IMA 10 had the lowest reductions in carotenoids, 5.1 and 5.5%, respectively.
After rehydration, line IMA 14 maintained the same values of chlorophyll a, b, total and carotenoids shown after the water deficit, while line IMA 16 maintained the same value of chlorophyll total, a 3.3% increase in chlorophyll a content with a reduction of 13.2 and 5.9% of chlorophyll b and carotenoids content, respectively. Line IMA 21 had a reduction of 15.1 and 3.0% in the chlorophyll total and b values, respectively and maintained the values of chlorophyll a and carotenoids, and line IMA 02 maintained the carotenoid values, showing a reduction of 3.8% in chlorophyll b and an increase of 8.7 and 5.6% in chlorophyll total and a. Lines IMA 10 and IMA 04 were highlighted after rehydration with increased levels of chlorophylls a, b, total and carotenoids of 24.4, 16.8, 22.7 and 18.2, and of 18.4, 16.2, 17.9 and 4.8%, respectively.
ELECTROLYTE LEAKAGE
Electrolyte leakage was significantly affected by lines, water regime and their interaction (p≤0.05). The mean values were 26.9, 78.9 and 35.6% in the control, deficit and rehydration respectively (Table IV).
Line IMA 02 had the highest electrolyte leakage and line IMA 21 had the lowest (Table IV). The water deficit increased the electrolyte leakage, which decrease after rehydration, but some lines could not reach the control values.
The highest increase of electrolyte leakage after water deficit was observed the line IMA 04, with an increase of 228% in electrolyte release, followed by lines IMA 14 (205.8%), IMA 21 (203.5%) and IMA 10 (193.8%). The lowest leakage increase was observed in the line IMA 16, 147.0%.
Regarding to recovery after rehydration, lines IMA 14 and IMA 10 had the highest rates of membrane recovery, with an electrolyte leakage of 30.4 and 32.8% respectively, both recovering 62.5% of the membrane capacity. Line IMA 21 and IMA 02 had the lowest recovery capacity, respectively 45.3 and 43.6%, that is, the release of electrolytes from their cells continued high.
PLANT WATER RELATIONS
The leaf water potential (Ψw) was significantly affected by the lines, by the water treatments, as well as by the interaction between these factors (Table IV).
The mean values of Ψw were -0.83, -3.12 and -1.38 MPa in the control, deficit and rehydration regimes, respectively (Table IV). Line IMA 16 had the highest value and lines IMA 10 and IMA 14 had the lowest.
The greatest reductions after the imposition of water deficit were observed in lines IMA 04, IMA 16 and IMA 02, of 388, 362 and 324%, respectively. While lines IMA 14 and IMA 21 had the lowest reductions, 188 and 187%, respectively.
After rehydration, the values of Ψw decreased, but these remained higher than those of the control treatment. Lines IMA 02, IMA 04, and IMA 14 had the highest recovery rates, i.e., 59.6, 59.5 and 58.1% respectively, while line IMA 21 showed the lowest recovery rate, i.e., 45.4%.
The relative water content (RWC) was significantly affected by the water regime (p≤0.05), but there was no effect of the interaction and the lines (Table IV). RWC mean values were 84.0, 45.9 and 84.5 in the control, deficit and rehydration respectively.
After rehydration, the lines showed an increase in RWC values, reaching the same values as those of the control regime, indicating good recovery.
GRAIN YIELD
Grain yield was significantly affected by lines (p≤0.05) and water regime, but there was no interaction between these factors (Table V).
In the control regime the grain yield mean value was 1,552.1 kg ha-1, and the mean value of the water deficit followed by rehydration regime was 1,144.9 kg ha-1 (Table V). Lines IMA 16 and IMA 21 had the highest productivity and line IMA 02 showed the lowest.
OIL CONTENT
The oil content was significantly affected by lines, water treatments and the interaction between these factors (p≤0.05) (Table V).
In the control regime the mean value was 24.18%, while in the water deficit treatment followed by rehydration the mean value was 26.61% (Table V). Lines IMA 04 and IMA 10 had the highest value for oil content, and line IMA 02 showed the lowest.
Responses of the lines under water deficit and rehydration varied with respect to the oil content. Line IMA 04 stood out in the oil content in the control treatment, 30.69%, and had the lowest reduction under water deficit and rehydration, i.e., only 2%, and the lines IMA 21 and IMA 14 had the greatest reduction of 6 and 13%, respectively. On the other hand, other lines showed an increase in oil content under water deficit followed by rehydration. Line IMA 10, had a 74% increase in the oil content, and lines IMA 02 and IMA 16 showed an increase of 13 and 9%, respectively.
OIL YIELD
The oil yield was affected significantly by line and water treatments (p≤0.05), but there was no interaction between these factors (Table VI).
In the control treatment, the mean value was 379.5 kg ha-1, while in the treatment with water deficit followed by rehydration the mean value was 310.7 kg ha-1 (Table VI). Lines IMA 04, IMA 16, IMA 10, IMA 21 and IMA 14 were the most productive, while line IMA 02 had the lowest oil yield.
WATER USE EFFICIENCY
The water use efficiency (WUE) was significantly affected by the lines (p≤0.05), by not by the water regime and the interaction between the two factors (Table VI). The mean value for the control regime was 3.37 kg ha-1 mm-1 and 3.73 kg ha-1 mm-1 in the treatment of water deficit followed by rehydration.
The lines IMA 16 and IMA 21 had the highest value for water use efficiency, and the line IMA 03 had the lowest value (Table VI).
DISCUSSION
Water deficiency usually promotes the degradation of chlorophyll, caused by photo-inhibition, reduction of photosynthetic efficiency or other processes, such as cell division and expansion (Araújo and Deminicis 2009ARAÚJO SAC AND DEMINICIS BB. 2009. Fotoinibição da fotossíntese. Rev Bras Biociênc 7: 463-472.). In this way, it is expected that lines that maintain a higher contents of photosynthetic pigments under water deficit can tolerate this condition (O’Neill et al. 2006). The concentration of pigments in the leaves may change due to abiotic factors, such as light and water, so the quantification of the pigments can provide important information about the relationship between the plant and the environment (Larcher 1995LARCHER W. 1995. Physiological plant ecology, 3rd ed., Berlin: Springer.).
Increase in chlorophyll content in safflower genotypes may indicate tolerance to water deficit. Our data showed a reduction in chlorophyll a, b, total and carotenoid values after water deficit in safflower genotypes considered susceptible to stress and an increase in these levels in the tolerant genotypes, and this effect was also observed in safflower by Amini et al. (2013AMINI H, ARZANI A AND BAHRAMI F. 2013. Seed yield and some physiological traits of safflower as affected by water deficit stress. Int J of Plant Prod 7: 597-614.). The reduction in chlorophyll content is associated with losses in the process of photosynthesis, mainly in the assimilation of CO2, which, consequently, leads to lower productivity. In fact, the content of photosynthetic pigments is a good indicator of plant vigor, and photosynthetic capacity is directly dependent on this characteristic (Carter and Spiering 2002CARTER AG AND SPIERING BA. 2002. Optical properties of intact leaves for estimating chlorophyll concentration. J Environ Qual 31: 1424-1432.). Therefore, line IMA 14 can be considered as stress tolerant because of the increase in the photosynthetic pigment indices, and the low reduction in leaf water relations.
Carotenoids are accessory pigments that play a key role in protecting against photosynthetic photo-inhibition, and they are important in preventing oxidative damage caused by stress (Wahid 2007WAHID A. 2007. Physiological implications of metabolite biosynthesis for net assimilation and heat-stress tolerance of sugarcane (Saccharum officinarum) sprouts. J Plant Res 120: 219-228.). Previous research in others crops systems such as rice has shown a reduction of 30.6% to 48.3% in the carotenoid content in rice genotypes classified as sensitive and a decrease of 10.0 to 12.9% in genotypes classified as stress tolerant (Chutipaijit et al. 2012CHUTIPAIJIT S, CHA-UM S AND SOMPORNPAILIN K. 2012. An evaluation of water deficit tolerance screening in pigmented indica rice genotypes. Pak J Bot 44: 65-72.). Therefore, an increase or a slight reduction in these levels are important indicators of stress tolerance. The line IMA 14 maintained high levels of carotenoids, and can be considered to be stress tolerante. Arunyanark et al. (2008ARUNYANARK A, JOGLOY S, AKKASAENG C, VORASOOT N, KESMALA T, NAGESWARA RAO RC, WRIGHT GC AND PATANOTHAI A. 2008. Chlorophyll stability is an indicator of drought tolerance in peanut. J Agron Crop Sci 194: 113-125.) demonstrated that pigment content is important in the differentiation of peanut genotypes, and that, genotypes with the capacity to maintain high values of photosynthetic pigments are more tolerant to stress.
The higher the stress, the more damages to the cell membranes, leading to an increase in electrolyte leakage. The plant’s ability to maintain plasma membrane integrity is lower, which may indicate stress sensitivity. The maintenance of membrane integrity after water deficit is an important indicator of stress tolerance (Bajji et al. 2002BAJJI M, KINET JM AND LUTTS S. 2002. The use of the electrolyte leakage method for assessing cell membrane stability as a water stress tolerance test in durum wheat. Plant Growth Regul 36: 61-70.). Wheat cultivars with lower electrolyte leakage were classified as stress tolerant because they demonstrated the ability to maintain membrane integrity. The same was observed in safflower (Zebarjadi et al. 2010ZEBARJADI AR, GHASEMPOUR HR AND SOHEILIKHAH Z. 2010. Effects of drought stress on biochemical and physiological parameters in callus cultures of Carthamus tinctorius varieties. Acta Agron Hung 58: 394-406.) and in peanut cultivars (Clavel et al. 2005CLAVEL D, DRAME NK, ROY-MACAULEY H, BRACONNIER S AND LAFFRAY D. 2005. Analysis of early responses to drought associated with field drought adaptation in four Sahelian groundnut (Arachis hypogaea L.) cultivars. Environ Exp Bot 54: 219-230.). In the present study, line IMA 16 showed the lowest electrolyte leakage under stress and good ability to maintain membrane stability, indicating drought tolerance.
Modifications in the lipid composition of the plasma membrane, and maintenance of its integrity and functionality are essential when the plant undergoes periods of abiotic stress, such as water stress (Amini et al. 2013AMINI H, ARZANI A AND BAHRAMI F. 2013. Seed yield and some physiological traits of safflower as affected by water deficit stress. Int J of Plant Prod 7: 597-614.). In our study, lines IMA 10 and IMA 14 can be considered tolerant because they have a high capacity to recover the stability of the plasma membrane.
Gholami et al. (2012GHOLAMI M, RAHEMI M AND RASTEGAR S. 2012. Use of rapid screening methods for detecting drought tolerant cultivars of fig (Ficus carica L.). Sci Hortic 143: 7-14.) also observed a recovery in membrane integrity values after rehydration, and they classified as tolerant the cultivars with greater capacity to maintain membrane stability and recovery of this characteristic after rehydration.
A number of studies showed that relative water content and water potential are affected by water deficit in safflower (Hussain et al. 2016HUSSAIN MI, LYRA DA, FAROOQ M, NIKOLOUDAKIS N AND KHALID N. 2016. Salt and drought stresses in safflower: a review. Agron Sustain Dev 36: 4., Singh et al. 2016aSINGH S, ANGADI SV, GROVER K, BEGNA S AND AULD D. 2016a. Drought response and yield formation of spring safflower under different water regimes in the semiarid Southern High Plains. Agric Water Manage 163: 354-362., c, Eslam 2011ESLAM BP. 2011. Evaluation of physiological indices for improving water deficit tolerance in spring safflower. J Agric Sci Technol 13: 327-338., Hojati et al. 2011HOJATI M, MODARRES-SANAVY SAM, KARIMI M AND GHANATI F. 2011. Responses of growth and antioxidant systems in Carthamus tinctorius L. under water deficit stress. Acta Physiol Plant 33: 105-112.) and fig (Gholami et al. 2012GHOLAMI M, RAHEMI M AND RASTEGAR S. 2012. Use of rapid screening methods for detecting drought tolerant cultivars of fig (Ficus carica L.). Sci Hortic 143: 7-14.), and they are widely used as indicator of the water status of the plant (Hojati et al. 2011).
Eslam (2011ESLAM BP. 2011. Evaluation of physiological indices for improving water deficit tolerance in spring safflower. J Agric Sci Technol 13: 327-338.), evaluating safflower genotypes under water stress conditions, obtained a significant reduction in RWC and water potential values in comparison with the control, showing that RWC can be used as a tool to select safflower genotypes under water stress. Stress tolerant species are expected to maintain high levels of RWC and Ψw (Canavar et al. 2014, Gholami et al. 2012GHOLAMI M, RAHEMI M AND RASTEGAR S. 2012. Use of rapid screening methods for detecting drought tolerant cultivars of fig (Ficus carica L.). Sci Hortic 143: 7-14.). Hojati et al. (2011HOJATI M, MODARRES-SANAVY SAM, KARIMI M AND GHANATI F. 2011. Responses of growth and antioxidant systems in Carthamus tinctorius L. under water deficit stress. Acta Physiol Plant 33: 105-112.) classified as stress tolerant the cultivar that maintained the highest value of RWC during water deficit. In the present study, water deficit caused varying levels of reduction in RWC and Ψw of different safflower lines tested. Lines IMA 14 and IMA 21 maintained better values of water potential during stress, with the line IMA 14 showing a better recovery rate. These lines can therefore be considered as tolerant to stress.
Hojati et al. (2011HOJATI M, MODARRES-SANAVY SAM, KARIMI M AND GHANATI F. 2011. Responses of growth and antioxidant systems in Carthamus tinctorius L. under water deficit stress. Acta Physiol Plant 33: 105-112.) observed a significant decrease in RWC and water potential after stress due to water deficit in safflower genotypes, with reductions of 20% in RWC and 69% in water potential compared to the control.
Plants that exhibit high leaf dehydration frequently undergo osmotic adjustment, or changes in cell wall elasticity, since these mechanisms are essential for the maintenance of physiological activity during long periods of drought (Faraooq et al. 2009).
After rehydration of a plant, the restoration of the stomatal opening takes at least a few days to normalize, and reestablish the total recovery of the water status of the plant (Távora and Melo 1991TÁVORA FJAF AND MELO FI. 1991. Respostas de linhagens de amendoim a ciclos de deficiência hídrica: Crescimento vegetativo, reprodutivo e relações hídricas. Ciênc Agron 22: 47-60.). This character, however, is governed genetically, varying with the potential for crop recovery. Stress tolerant plants are able to maintain turgor during stress, or survive turgor reduction, or recover turgor completely after rehydration (Gazanchian et al. 2007GAZANCHIAN A, HAJHEIDARI M, SIMA NK AND SALEKDEH GH. 2007. Proteome response of Elymuse longatum to severe water stress and recovery. J Exp Bot 58: 291-300.). The maintenance of turgor under low water availability could be due to the osmotic adjustment and could be a drought tolerance mechanism (Singh et al. 2016cSINGH S, ANGADI SV, HILAIRE RS, GROVER K AND VAN LEEUWEN DM. 2016c. Spring safflower performance under growth stage based irrigation in the Southern High Plains. Crop Sci 56: 1878-1889.).
Productivity is the result of a complex interaction between physiological factors (Farooq et al. 2009FAROOQ M, WAHID A, KOBAYASHI N, FUJITA D AND BASRA SMA. 2009. Plant drought stress: effects, mechanisms and management. Agron Sustain Dev 29: 185-212.). Under stress conditions, there is a reduction in grain yield, due to the reduction in the assimilation of carbohydrates and in the reduction of the activity of synthetic enzymes (Eslam 2011ESLAM BP. 2011. Evaluation of physiological indices for improving water deficit tolerance in spring safflower. J Agric Sci Technol 13: 327-338., Farooq et al. 2009). Yield can be determined by genetic factors, stress resistance or water use efficiency, and genotypes that maintain high yields under stress conditions are considered resistant (Blum 2005BLUM A. 2005 Drought resistance, water-use efficiency, and yield potential-are they compatible, dissonant, or mutually exclusive? Australian J Agri Research 56: 1159-1168.). In arid and semi-arid climates, maintaining high yields is an important feature in the selection of safflower genotypes (Hussain et al. 2016HUSSAIN MI, LYRA DA, FAROOQ M, NIKOLOUDAKIS N AND KHALID N. 2016. Salt and drought stresses in safflower: a review. Agron Sustain Dev 36: 4.). Therefore, the lines IMA 14 and IMA 16 can be considered stress tolerant, and the lines IMA 02 and IMA 21 can be considered as stress susceptible.
Grain yield was reported to be reduced under conditions of water stress in safflower (Eslam 2011ESLAM BP. 2011. Evaluation of physiological indices for improving water deficit tolerance in spring safflower. J Agric Sci Technol 13: 327-338., Singh et al. 2016aSINGH S, ANGADI SV, GROVER K, BEGNA S AND AULD D. 2016a. Drought response and yield formation of spring safflower under different water regimes in the semiarid Southern High Plains. Agric Water Manage 163: 354-362.), and other crops, such as, flax and mustard (Kar et al. 2007KAR G, KUMAR A AND MARTHA M. 2007. Water use efficiency and crop coefficients of dry season oilseed crops. Agric Water Manage 87: 73-82.), eggplant (Lovelli et al. 2007LOVELLI S, PERNIOLA M, FERRARA A AND DI TOMMASO T. 2007. Yield response factor to water (Ky) and water use efficiency of Carthamus tinctorius L. and Solanum melongena L. Agric Water Manage 92: 73-80.). Istanbulluoglu et al. (2009ISTANBULLUOGLU A, GOCMEN E, GEZER E, PASA C AND KONUKCU F. 2009. Effects of water stress at different development stages on yield and water productivity of winter and summer safflower (Carthamus tinctorius L.). Agric Water Manage 96: 1429-1434.) obtained higher yields in safflower in the irrigated treatment, with reductions of 44.2% after water deficit in the vegetative stage, while Kar et al. (2007) reported a 220% increase in yield in the irrigation treatment during safflower grown cycle. Lovelli et al. (2007) obtained a reduction of 30% in the grain yield of safflower under water deficit corresponding to 50% of the crop evapotranspiration replacement.
Another important trait affect by stress is oil content. Singh et al. (2016aSINGH S, ANGADI SV, GROVER K, BEGNA S AND AULD D. 2016a. Drought response and yield formation of spring safflower under different water regimes in the semiarid Southern High Plains. Agric Water Manage 163: 354-362.) observed an increase in oil content of safflower lines under water deficit. During stress, there is an alteration of the plant dynamics, which prioritizes the translocation of photo assimilates for the development of the seeds, and lower water availability may cause an increase in the oil content of the seeds. In our study, line IMA 04 had the highest oil content in the control regime, while lines IMA 21 and IMA 14 had the lowest decrease after water stress and rehydration, and the lines IMA 10, IMA 02 and IMA 16 had an increase in the oil content after imposing stress.
In contrast to our results, Ashrafi and Razmjoo (2010ASHRAFI E AND RAZJMJOO K. 2010. Effect of irrigation regimes on oil content and composition of safflower (Carthamus tinctorius L.) cultivars. J Am Oil Chem Soc 87: 499-506.) verified that the oil content in the stress free treatment ranged from 25.2 to 30.7% among the genotypes, and as water stress increased the oil content reduced, with the maximum reduction of 13%. Omidi et al. (2012OMIDI AH, KHAZAEI H, MONNEVEUX P AND STODDARD F. 2012. Effect of cultivar and water regime on yield and yield components in safflower (Carthamus tinctorius L.). Turk J Field Crops 17: 10-15.) reported that this trait depended mainly on genetics and was not influenced by the environment. Some authors agree that water deficit had no influence on the oil content of safflower genotypes (Dordas and Sioulas 2008DORDAS CA AND SIOULAS C. 2008. Safflower yield, chlorophyll content, photosynthesis, and water use efficiency response to nitrogen fertilization under rainfed conditions. Ind Crops Prod 27: 75-85., Gharmarnia 2010, Movahhedy-Dehnavy 2010, Omidi et al. 2012), and that, the oil content varied according to the genetic material used (Koutroubas et al. 2009KOUTROUBAS SD, PAPAKOSTA DK AND DOITSINIS A. 2009. Phenotypic variation in physiological determinants of yield in spring sown safflower under Mediterranean conditions. Field Crop Res 112: 199-204., Omidi et al. 2012).
On the other hand, Camas (2007CAMAS N, CIRAK C AND ESENDAL E. 2007. Seed yield, oil content and fatty acids composition of safflower (Carthamus tinctorius L.) grown in northern Turkey conditions. J Fac Agric Ondokuz Mayıs Univ 22: 98-104.) and Hussain et al. (2016HUSSAIN MI, LYRA DA, FAROOQ M, NIKOLOUDAKIS N AND KHALID N. 2016. Salt and drought stresses in safflower: a review. Agron Sustain Dev 36: 4.) reported that the differences in the oil content among the genotypes are a result of the genotype x environment interaction, in which the expression of the genes that control the oil production is in function of the environment.
The oil yield is determined by the oil content and grain yield (Koutroubas et al. 2009KOUTROUBAS SD, PAPAKOSTA DK AND DOITSINIS A. 2009. Phenotypic variation in physiological determinants of yield in spring sown safflower under Mediterranean conditions. Field Crop Res 112: 199-204.), thus, influenced by the line response to water regimes for both grain yield and oil content. Ghamarnia et al. (2010GHAMARNIA H AND SEPEHRI S. 2010. Different irrigation regimes affected water use, yield and other yield components of safflower (Carthamus tinctorius L.) crop in a semi-arid region of Iran. J Food Agric Environ 8: 590-593.) observed variations in oil yield as a function of grain yield. Omidi et al. (2012OMIDI AH, KHAZAEI H, MONNEVEUX P AND STODDARD F. 2012. Effect of cultivar and water regime on yield and yield components in safflower (Carthamus tinctorius L.). Turk J Field Crops 17: 10-15.) and Eslam (2011ESLAM BP. 2011. Evaluation of physiological indices for improving water deficit tolerance in spring safflower. J Agric Sci Technol 13: 327-338.) reported a higher oil yield in the irrigated treatment than after water deficit there was reductions for this variable.
Singh et al. (2016bSINGH S, ANGADI SV, HILAIRE RS, GROVER K AND HILAIRE R. 2016b. Effect of growth stage based irrigation on soil water extraction and water use efficiency of spring safflower cultivars. Agric Water Manage 177: 432-439.) observed a reduction in oil yield in safflower lines under water deficit, the lowest reduction occurred when the stress was in the vegetative phase and the highest reduction occurred when the stress was in the reproductive phase.
It is known that water deficit leads to increase in WUE (Lovelli et al. 2007LOVELLI S, PERNIOLA M, FERRARA A AND DI TOMMASO T. 2007. Yield response factor to water (Ky) and water use efficiency of Carthamus tinctorius L. and Solanum melongena L. Agric Water Manage 92: 73-80.). Istanbulluoglu et al. (2009ISTANBULLUOGLU A, GOCMEN E, GEZER E, PASA C AND KONUKCU F. 2009. Effects of water stress at different development stages on yield and water productivity of winter and summer safflower (Carthamus tinctorius L.). Agric Water Manage 96: 1429-1434.) and Lovelli et al. (2007) reported an increase in water use efficiency in safflower under water deficit compared to the irrigated treatment. Singh et al. (2016bSINGH S, ANGADI SV, HILAIRE RS, GROVER K AND HILAIRE R. 2016b. Effect of growth stage based irrigation on soil water extraction and water use efficiency of spring safflower cultivars. Agric Water Manage 177: 432-439.) also observed an increase in water use efficiency after a period of drought stress with no improvement in yield with excessive irrigation. Ngouajio et al. (2007NGOUAJIO M, WANG G AND GOLDY R. 2007. Withholding of drip irrigation between transplanting and flowering increases the yield of field-grown tomato under plastic mulch. Agric Water Manage 87: 285-291.) reported an increase in WUE and yield in tomato cultivars (Lycopersicon esculentum) and Sapeta et al. (2013SAPETA H, COSTA JM, LOURENCO T, MAROCO J, VAN DER LINDE P AND OLIVEIRA MM. 2013. Drought stress response in Jatropha curcas: Growth and physiology. Environ Exp Bot 85: 76-84.) in Jatropha curcas after water deficit. While Kar et al. (2007KAR G, KUMAR A AND MARTHA M. 2007. Water use efficiency and crop coefficients of dry season oilseed crops. Agric Water Manage 87: 73-82.) and Songsri et al. (2009SONGSRI P, JOGLOY S, HOLBROOK CC, KESMALA T, VORASOOT N, AKKASAENG C AND PATANOTHAI A. 2009. Association of root, specific leaf area and SPAD chlorophyll meter reading to water use efficiency of peanut under different available soil water. Agric Water Manage 96: 790-798.) noted an increase in the WUE with increased irrigation.
Water stress tolerant species maintain water use efficiency by reducing water loss (Farooq et al. 2009FAROOQ M, WAHID A, KOBAYASHI N, FUJITA D AND BASRA SMA. 2009. Plant drought stress: effects, mechanisms and management. Agron Sustain Dev 29: 185-212.). WUE can be considered as a mechanism of stress tolerance and leads to an increase in productivity due to changes in water use (Canavar et al. 2014). The decrease of WUE after the period of stress will result in a reduction in the productivity of these lines, indicating a greater susceptibility to water stress. WUE can be determinant for crop productivity (Lovelli et al. 2007LOVELLI S, PERNIOLA M, FERRARA A AND DI TOMMASO T. 2007. Yield response factor to water (Ky) and water use efficiency of Carthamus tinctorius L. and Solanum melongena L. Agric Water Manage 92: 73-80.).
Recovery after rehydration is necessary to regulate plant metabolism, and it is associated with repair of possible damage caused by stress (Sun et al. 2016SUN C, GAO X, CHEN X, FU J AND ZHANG Y. 2016. Metabolic and growth responses of maize to successive drought and re-watering cycles. Agric Water Manage 172: 62-73.). Several studies have shown that the plant has a gradual recovery after rehydration (Miyashita et al. 2005MIYASHITA K, TANAKAMARU S, MAITANI T AND KIMURA K. 2005. Recovery responses of photosynthesis, transpiration, and stomatal conductance in kidney bean following drought stress. Environ Exp Bot 53: 205-214., Shi et al. 2014SHI J, YASUOR H, YERMIYAHU U, ZUO Q AND BEN-GAL A. 2014. Dynamic responses of wheat to drought and nitrogen stresses during re-watering cycles. Agric Water Manage 146: 163-172.). The recovery of the physiological and production traits in the safflower lines after rehydration suggests that water stress did not cause permanent damage to the leaf photosystem, indicating some stress resistance of these lines (Chaves et al. 2009CHAVES MM, FLEXAS J AND PINHEIRO C. 2009. Photosynthesis under drought and salt stress: regulation mechanisms from whole plant to cell. Ann Bot 103: 551-560., 2011).
CONCLUSIONS
This study evaluated the effect of water deficit on the physiology and production of six safflower lines. In response to water deficit the safflower lines showed varying responses in terms of changes in the leaf relative water content, leaf water potential, grain yield, cell electrolyte leakage, chlorophyll a, b, totals and carotenoids content, oil content, oil yield and water use efficiency.
Lines IMA 04, IMA 10 and IMA 14 showed physiological responses of high tolerance to drought, in terms of better recovery of the parameters evaluated after rehydration. Lines IMA 02 and IMA 21 showed intermediate characteristics, as they recovered photosynthetic pigments, but they did not completely recover leaf water potential and electrolyte leakage. The line IMA 16 had a higher index of leaf dehydration, and no recovery of the chlorophyll a, b, total, carotenoids and leaf water potential after rehydration, indicating susceptibility to drought.
Regarding grain yield, lines IMA 14 and IMA 16 were more productive after water deficit and rehydration. However, under irrigated conditions, line IMA 21 was the most productive. For the variables oil content and oil yield the lines IMA 04 and IMA 16 were the most productive for all treatments. While, for water use efficiency, lines IMA 04 and IMA 14 were the most efficient.
In general, line IMA 14 can be considered tolerant to water stress since it was the least affected by water deficit followed by rehydration, as it showed little reduction in grain yield and water potential, as well as an increase in photosynthetic pigments and water use efficiency. However, line IMA 16 maintained high grain yield and low electrolyte leakage rate, but its water potential, relative water content and photosynthetic pigment were affected by water deficit and had low recovery after rehydration, indicating that its ability to tolerate water deficit may be related to other physiological and/or biochemical mechanisms, which have not been contemplated in this study.
ACKNOWLEDGMENTS
FPAPB acknowledges the Coordenação de Aperfeiçoamento de Pessoal de Nível Superior (CAPES, Brazil) for a Master’s scholarship, and MAS acknowledges the Conselho Nacional de Desenvolvimento Científico e Tecnológico (CNPq, Brazil) for ‘‘Productivity in Research’’ fellowship (Proc. 311255/2012-4). We thank Professor Maurício D. Zanotto for the donation of the line seeds.
REFERENCES
- AMINI H, ARZANI A AND BAHRAMI F. 2013. Seed yield and some physiological traits of safflower as affected by water deficit stress. Int J of Plant Prod 7: 597-614.
- ARAÚJO SAC AND DEMINICIS BB. 2009. Fotoinibição da fotossíntese. Rev Bras Biociênc 7: 463-472.
- ARUNYANARK A, JOGLOY S, AKKASAENG C, VORASOOT N, KESMALA T, NAGESWARA RAO RC, WRIGHT GC AND PATANOTHAI A. 2008. Chlorophyll stability is an indicator of drought tolerance in peanut. J Agron Crop Sci 194: 113-125.
- ASHRAFI E AND RAZJMJOO K. 2010. Effect of irrigation regimes on oil content and composition of safflower (Carthamus tinctorius L.) cultivars. J Am Oil Chem Soc 87: 499-506.
- BAJJI M, KINET JM AND LUTTS S. 2002. The use of the electrolyte leakage method for assessing cell membrane stability as a water stress tolerance test in durum wheat. Plant Growth Regul 36: 61-70.
- BLUM A. 2005 Drought resistance, water-use efficiency, and yield potential-are they compatible, dissonant, or mutually exclusive? Australian J Agri Research 56: 1159-1168.
- CAMAS N, CIRAK C AND ESENDAL E. 2007. Seed yield, oil content and fatty acids composition of safflower (Carthamus tinctorius L.) grown in northern Turkey conditions. J Fac Agric Ondokuz Mayıs Univ 22: 98-104.
- CANAVAR O, GOTZ KP, KOCA YO AND ELLMER F. 2014. Relationship between water use efficiency and δ13c isotope discrimination of safflower (Carthamus tinctorius L.) under drought stress. Turk J Field Crops 19: 212-220.
- CARTER AG AND SPIERING BA. 2002. Optical properties of intact leaves for estimating chlorophyll concentration. J Environ Qual 31: 1424-1432.
- CHAVES MM, COSTA JM AND SAIBO NJM. 2011. Recent advances in photosynthesis under drought and salinity. Adv Bot Res 57: 49-104.
- CHAVES MM, FLEXAS J AND PINHEIRO C. 2009. Photosynthesis under drought and salt stress: regulation mechanisms from whole plant to cell. Ann Bot 103: 551-560.
- CHUTIPAIJIT S, CHA-UM S AND SOMPORNPAILIN K. 2012. An evaluation of water deficit tolerance screening in pigmented indica rice genotypes. Pak J Bot 44: 65-72.
- CLAVEL D, DRAME NK, ROY-MACAULEY H, BRACONNIER S AND LAFFRAY D. 2005. Analysis of early responses to drought associated with field drought adaptation in four Sahelian groundnut (Arachis hypogaea L.) cultivars. Environ Exp Bot 54: 219-230.
- DORDAS CA AND SIOULAS C. 2008. Safflower yield, chlorophyll content, photosynthesis, and water use efficiency response to nitrogen fertilization under rainfed conditions. Ind Crops Prod 27: 75-85.
- ESLAM BP. 2011. Evaluation of physiological indices for improving water deficit tolerance in spring safflower. J Agric Sci Technol 13: 327-338.
- FAROOQ M, WAHID A, KOBAYASHI N, FUJITA D AND BASRA SMA. 2009. Plant drought stress: effects, mechanisms and management. Agron Sustain Dev 29: 185-212.
- FOOD AND AGRICULTURE ORGANIZATION OF THE UNITED NATIONS STATISTICS. 2014. http://faostat3.fao.org/browse/Q/QC/E (Acessed on January 25, 2017).
» http://faostat3.fao.org/browse/Q/QC/E - FOSTER K, LAMBERS H, REAL D, RAMANKUTTY P, CAWTHRAY GR AND RYAN MH. 2015. Drought resistance and recovery in mature Bituminaria bituminosa var. albomarginata. Ann Appl Biol 166: 154-169.
- GAZANCHIAN A, HAJHEIDARI M, SIMA NK AND SALEKDEH GH. 2007. Proteome response of Elymuse longatum to severe water stress and recovery. J Exp Bot 58: 291-300.
- GHAMARNIA H AND SEPEHRI S. 2010. Different irrigation regimes affected water use, yield and other yield components of safflower (Carthamus tinctorius L.) crop in a semi-arid region of Iran. J Food Agric Environ 8: 590-593.
- GHOLAMI M, RAHEMI M AND RASTEGAR S. 2012. Use of rapid screening methods for detecting drought tolerant cultivars of fig (Ficus carica L.). Sci Hortic 143: 7-14.
- HOJATI M, MODARRES-SANAVY SAM, KARIMI M AND GHANATI F. 2011. Responses of growth and antioxidant systems in Carthamus tinctorius L. under water deficit stress. Acta Physiol Plant 33: 105-112.
- HOMAYOUN H, SAM DALIRI M AND MEHRABI P. 2011. Effect of drought stress on leaf chlorophyll in corn cultivars (Zea mays). Middle East J Sci Res 9: 418-420.
- HU L, WANG Z AND HUANG B. 2010. Diffusion limitations and metabolic factors associated with inhibition and recovery of photosynthesis from drought stress in C3 perennial grass species. Physiol Plant 139: 93-106.
- HUSSAIN MI, LYRA DA, FAROOQ M, NIKOLOUDAKIS N AND KHALID N. 2016. Salt and drought stresses in safflower: a review. Agron Sustain Dev 36: 4.
- ISTANBULLUOGLU A, GOCMEN E, GEZER E, PASA C AND KONUKCU F. 2009. Effects of water stress at different development stages on yield and water productivity of winter and summer safflower (Carthamus tinctorius L.). Agric Water Manage 96: 1429-1434.
- JAMAUX I, STEINMETZ A AND BELHASSEN E. 1997. Looking for molecular and physiological markers of osmotic adjustment in sunflower. New Phytol 137: 117-127.
- KAR G, KUMAR A AND MARTHA M. 2007. Water use efficiency and crop coefficients of dry season oilseed crops. Agric Water Manage 87: 73-82.
- KOUTROUBAS SD, PAPAKOSTA DK AND DOITSINIS A. 2009. Phenotypic variation in physiological determinants of yield in spring sown safflower under Mediterranean conditions. Field Crop Res 112: 199-204.
- LARCHER W. 1995. Physiological plant ecology, 3rd ed., Berlin: Springer.
- LICHTENTHALER HK. 1897. Chlorophyll and carotenoids, the pigments of photosynthetic biomembranes. Methods Enzymol 148: 331-382.
- LOVELLI S, PERNIOLA M, FERRARA A AND DI TOMMASO T. 2007. Yield response factor to water (Ky) and water use efficiency of Carthamus tinctorius L. and Solanum melongena L. Agric Water Manage 92: 73-80.
- MIYASHITA K, TANAKAMARU S, MAITANI T AND KIMURA K. 2005. Recovery responses of photosynthesis, transpiration, and stomatal conductance in kidney bean following drought stress. Environ Exp Bot 53: 205-214.
- MOVAHHEDY-DEHNAVY M, MODARRES-SANAVY SAM AND MOKHTASSI-BIDGOLI A. 2009. Foliar application of zinc and manganese improves seed yield and quality of safflower (Carthamus tinctorius L.) grown under water deficit stress. Ind Crops Prod 30: 82-92.
- NGOUAJIO M, WANG G AND GOLDY R. 2007. Withholding of drip irrigation between transplanting and flowering increases the yield of field-grown tomato under plastic mulch. Agric Water Manage 87: 285-291.
- OMIDI AH, KHAZAEI H, MONNEVEUX P AND STODDARD F. 2012. Effect of cultivar and water regime on yield and yield components in safflower (Carthamus tinctorius L.). Turk J Field Crops 17: 10-15.
- O’NEILL PM, SHANAHAN JF AND SCHEPERS JS. 2006. Use of chlorophyll fluorescence assessments to differentiate corn hybrid response to variable water conditions. Crop Sci 46: 681-687.
- SAPETA H, COSTA JM, LOURENCO T, MAROCO J, VAN DER LINDE P AND OLIVEIRA MM. 2013. Drought stress response in Jatropha curcas: Growth and physiology. Environ Exp Bot 85: 76-84.
- SCHLEMMER MR, FRANCIS DD, SHANAHAN JF AND SCHEPERS JS. 2005. Remotely measuring chlorophyll content in corn leaves with differing nitrogen levels and relative water content. Agron J 97: 106-112.
- SCOTTI CAMPOS P AND PHAM THI AP. 1997. Effect of abscisic acid pretreatment on membrane leakage and lipid composition of Vigna unguiculata leaf discs subjected to osmotic stress. Plant Sci 130: 11-18.
- SEHGAL D, RAINA SN, DEVARUMATHA RM, SASANUMA T AND SASAKUMA T. 2009. Nuclear DNA assay in solving issues related to ancestry f the domesticated diploid safflower (Carthamus tinctorius L.) and the polyploid (Carthamus) taxa, and phylogenetic and genomic relationships in the genus Carthamus L. (Asteraceae). Mol Phylogenet Evol 53: 631-644.
- SHI J, YASUOR H, YERMIYAHU U, ZUO Q AND BEN-GAL A. 2014. Dynamic responses of wheat to drought and nitrogen stresses during re-watering cycles. Agric Water Manage 146: 163-172.
- SINGH S, ANGADI SV, GROVER K, BEGNA S AND AULD D. 2016a. Drought response and yield formation of spring safflower under different water regimes in the semiarid Southern High Plains. Agric Water Manage 163: 354-362.
- SINGH S, ANGADI SV, HILAIRE RS, GROVER K AND HILAIRE R. 2016b. Effect of growth stage based irrigation on soil water extraction and water use efficiency of spring safflower cultivars. Agric Water Manage 177: 432-439.
- SINGH S, ANGADI SV, HILAIRE RS, GROVER K AND VAN LEEUWEN DM. 2016c. Spring safflower performance under growth stage based irrigation in the Southern High Plains. Crop Sci 56: 1878-1889.
- SONGSRI P, JOGLOY S, HOLBROOK CC, KESMALA T, VORASOOT N, AKKASAENG C AND PATANOTHAI A. 2009. Association of root, specific leaf area and SPAD chlorophyll meter reading to water use efficiency of peanut under different available soil water. Agric Water Manage 96: 790-798.
- SUN C, GAO X, CHEN X, FU J AND ZHANG Y. 2016. Metabolic and growth responses of maize to successive drought and re-watering cycles. Agric Water Manage 172: 62-73.
- TÁVORA FJAF AND MELO FI. 1991. Respostas de linhagens de amendoim a ciclos de deficiência hídrica: Crescimento vegetativo, reprodutivo e relações hídricas. Ciênc Agron 22: 47-60.
- WAHID A. 2007. Physiological implications of metabolite biosynthesis for net assimilation and heat-stress tolerance of sugarcane (Saccharum officinarum) sprouts. J Plant Res 120: 219-228.
- XU Z, ZHOU G AND SHIMIZU H. 2009. Are plant growth and photosynthesis limited by pre-drought following rewatering in grass? J Exp Bot 60: 3737-3749.
- ZEBARJADI AR, GHASEMPOUR HR AND SOHEILIKHAH Z. 2010. Effects of drought stress on biochemical and physiological parameters in callus cultures of Carthamus tinctorius varieties. Acta Agron Hung 58: 394-406.
Publication Dates
-
Publication in this collection
07 Dec 2017 -
Date of issue
Oct-Dec 2017
History
-
Received
21 June 2017 -
Accepted
21 Aug 2017