Abstracts
PURPOSE: To evaluate the retinal nerve fiber layer measurements with time-domain (TD) and spectral-domain (SD) optical coherence tomography (OCT), and to test the diagnostic ability of both technologies in glaucomatous patients with asymmetric visual hemifield loss. METHODS: 36 patients with primary open-angle glaucoma with visual field loss in one hemifield (affected) and absent loss in the other (non-affected), and 36 age-matched healthy controls had the study eye imaged with Stratus-OCT (Carl Zeiss Meditec Inc., Dublin, California, USA) and 3 D OCT-1000 (Topcon, Tokyo, Japan). Peripapillary retinal nerve fiber layer measurements and normative classification were recorded. Total deviation values were averaged in each hemifield (hemifield mean deviation) for each subject. Visual field and retinal nerve fiber layer "asymmetry indexes" were calculated as the ratio between affected versus non-affected hemifields and corresponding hemiretinas. RESULTS: Retinal nerve fiber layer measurements in non-affected hemifields (mean [SD] 87.0 [17.1] µm and 84.3 [20.2] µm, for TD and SD-OCT, respectively) were thinner than in controls (119.0 [12.2] µm and 117.0 [17.7] µm, P<0.001). The optical coherence tomography normative database classified 42% and 67% of hemiretinas corresponding to non-affected hemifields as abnormal in TD and SD-OCT, respectively (P=0.01). Retinal nerve fiber layer measurements were consistently thicker with TD compared to SD-OCT. Retinal nerve fiber layer thickness asymmetry index was similar in TD (0.76 [0.17]) and SD-OCT (0.79 [0.12]) and significantly greater than the visual field asymmetry index (0.36 [0.20], P<0.001). CONCLUSIONS: Normal hemifields of glaucoma patients had thinner retinal nerve fiber layer than healthy eyes, as measured by TD and SD-OCT. Retinal nerve fiber layer measurements were thicker with TD than SD-OCT. SD-OCT detected abnormal retinal nerve fiber layer thickness more often than TD-OCT.
Glaucoma, open-angle; Visual fields; Tomography, optical coherence; Optic disc; Optic nerve diseases; Nerve fibers; Retina
OBJETIVO: Avaliar as medidas da camada de fibras nervosas da retina com a tomografia de coerência óptica (OCT) "time domain" (TD) e "spectral domain" (SD), e testar a habilidade diagnóstica de ambas as tecnologias em pacientes com perda assimétrica glaucomatosa de hemicampo visual. MÉTODOS: Trinta e seis pacientes com glaucoma primário de ângulo aberto com perda de campo visual em um hemicampo (acometido) e ausência de perda no hemicampo oposto (não-acometido), e 36 controles pareados por idade tiveram o olho de estudo examinado com Stratus-OCT (Carl Zeiss Meditec Inc., Dublin, California, USA) e 3 D OCT-1000 (Topcon, Tokyo, Japan). As medidas de espessura da camada de fibras nervosas da retina peripapilar e classificação normativa fornecida pelos aparelhos foram registrados para análise. A média aritmética dos valores do gráfico de desvio total em cada hemicampo foi calculada para cada indivíduo. "Índices de assimetria" para campo visual e camada de fibras nervosas da retina foram calculados como a razão entre hemicampos acometido e não-acometido e hemirretinas correspondentes, respectivamente. RESULTADOS: As medidas da camada de fibras nervosas da retina em hemicampos não-acometidos (média [SD] 87.0 [17.1] µm e 84.3 [20.2] µm, para TD e SD-OCT, respectivamente) foram menores do que em controles (119.0 [12.2] µm e 117.0 [17.7] µm, P<0.001). O banco de dados normativo classificou como alterado 42% e 67% das hemirretinas correspondentes a hemicampos não-acometidos com TD e SD-OCT, respectivamente (P=0.01). As medidas da camada de fibras nervosas da retina foram consistentemente mais espessas com TD comparados com SD-OCT. Índices de assimetria da camada de fibras nervosas da retina foram semelhantes entre TD (0.76 [0.17]) e SD-OCT (0.79 [0.12]) e significantemente maiores do que o índice de assimetria do campo visual (0.36 [0.20], P<0.001). CONCLUSÃO: Os hemicampos normais de pacientes com glaucoma apresentaram camada de fibras nervosas da retina mais fina do que olhos saudáveis. As medidas da camada de fibras nervosas da retina foram mais espessas com TD do que com SD-OCT, que por sua vez detectou anormalidades na espessura da camada de fibras nervosas da retina mais frequentemente do que o TD-OCT.
Glaucoma de ângulo aberto; Campos visuais; Tomografia de coerência óptica; Disco óptico; Doenças do nervo óptico; Fibras nervosas; Retina
ORIGINAL ARTICLE ARTIGO ORIGINAL
Nerve fiber layer in glaucomatous hemifield loss: a case-control study with time- and spectral-domain optical coherence tomography
Camada de fibras nervosas na perda de hemicampo glaucomatoso: um estudo caso-controle com tomografia de coerência óptica time- e spectral-domain
Alexandre Soares Castro ReisI, II; Kallene Summer Moreira VidalI; André Carvalho KreuzI; Mario Luiz Ribeiro MonteiroI; Marcelo Teixeira NicolelaII; Roberto Freire Santiago MaltaI
IPhysician, Department of Ophthalmology, Universidade de São Paulo - USP - São Paulo (SP), Brazil
IIPhysician, Ophthalmology and Visual Sciences, Faculty of Medicine, Dalhousie University, Halifax, NS, Canada
Correspondence address Correspondence address: Alexandre S.C. Reis Rua Pascoal Vita, 342 Apto. 122 São Paulo (SP) - 05445-000 - Brazil E-mail: alexandrescreis@gmail.com
ABSTRACT
PURPOSE: To evaluate the retinal nerve fiber layer measurements with time-domain (TD) and spectral-domain (SD) optical coherence tomography (OCT), and to test the diagnostic ability of both technologies in glaucomatous patients with asymmetric visual hemifield loss.
METHODS: 36 patients with primary open-angle glaucoma with visual field loss in one hemifield (affected) and absent loss in the other (non-affected), and 36 age-matched healthy controls had the study eye imaged with Stratus-OCT (Carl Zeiss Meditec Inc., Dublin, California, USA) and 3 D OCT-1000 (Topcon, Tokyo, Japan). Peripapillary retinal nerve fiber layer measurements and normative classification were recorded. Total deviation values were averaged in each hemifield (hemifield mean deviation) for each subject. Visual field and retinal nerve fiber layer "asymmetry indexes" were calculated as the ratio between affected versus non-affected hemifields and corresponding hemiretinas.
RESULTS: Retinal nerve fiber layer measurements in non-affected hemifields (mean [SD] 87.0 [17.1] µm and 84.3 [20.2] µm, for TD and SD-OCT, respectively) were thinner than in controls (119.0 [12.2] µm and 117.0 [17.7] µm, P<0.001). The optical coherence tomography normative database classified 42% and 67% of hemiretinas corresponding to non-affected hemifields as abnormal in TD and SD-OCT, respectively (P=0.01). Retinal nerve fiber layer measurements were consistently thicker with TD compared to SD-OCT. Retinal nerve fiber layer thickness asymmetry index was similar in TD (0.76 [0.17]) and SD-OCT (0.79 [0.12]) and significantly greater than the visual field asymmetry index (0.36 [0.20], P<0.001).
CONCLUSIONS: Normal hemifields of glaucoma patients had thinner retinal nerve fiber layer than healthy eyes, as measured by TD and SD-OCT. Retinal nerve fiber layer measurements were thicker with TD than SD-OCT. SD-OCT detected abnormal retinal nerve fiber layer thickness more often than TD-OCT.
Keywords: Glaucoma, open-angle; Visual fields; Tomography, optical coherence/methods; Optic disc; Optic nerve diseases/diagnosis; Nerve fibers/pathology; Retina
RESUMO
OBJETIVO: Avaliar as medidas da camada de fibras nervosas da retina com a tomografia de coerência óptica (OCT) "time domain" (TD) e "spectral domain" (SD), e testar a habilidade diagnóstica de ambas as tecnologias em pacientes com perda assimétrica glaucomatosa de hemicampo visual.
MÉTODOS: Trinta e seis pacientes com glaucoma primário de ângulo aberto com perda de campo visual em um hemicampo (acometido) e ausência de perda no hemicampo oposto (não-acometido), e 36 controles pareados por idade tiveram o olho de estudo examinado com Stratus-OCT (Carl Zeiss Meditec Inc., Dublin, California, USA) e 3 D OCT-1000 (Topcon, Tokyo, Japan). As medidas de espessura da camada de fibras nervosas da retina peripapilar e classificação normativa fornecida pelos aparelhos foram registrados para análise. A média aritmética dos valores do gráfico de desvio total em cada hemicampo foi calculada para cada indivíduo. "Índices de assimetria" para campo visual e camada de fibras nervosas da retina foram calculados como a razão entre hemicampos acometido e não-acometido e hemirretinas correspondentes, respectivamente.
RESULTADOS: As medidas da camada de fibras nervosas da retina em hemicampos não-acometidos (média [SD] 87.0 [17.1] µm e 84.3 [20.2] µm, para TD e SD-OCT, respectivamente) foram menores do que em controles (119.0 [12.2] µm e 117.0 [17.7] µm, P<0.001). O banco de dados normativo classificou como alterado 42% e 67% das hemirretinas correspondentes a hemicampos não-acometidos com TD e SD-OCT, respectivamente (P=0.01). As medidas da camada de fibras nervosas da retina foram consistentemente mais espessas com TD comparados com SD-OCT. Índices de assimetria da camada de fibras nervosas da retina foram semelhantes entre TD (0.76 [0.17]) e SD-OCT (0.79 [0.12]) e significantemente maiores do que o índice de assimetria do campo visual (0.36 [0.20], P<0.001).
CONCLUSÃO: Os hemicampos normais de pacientes com glaucoma apresentaram camada de fibras nervosas da retina mais fina do que olhos saudáveis. As medidas da camada de fibras nervosas da retina foram mais espessas com TD do que com SD-OCT, que por sua vez detectou anormalidades na espessura da camada de fibras nervosas da retina mais frequentemente do que o TD-OCT.
Descritores: Glaucoma de ângulo aberto; Campos visuais; Tomografia de coerência óptica/métodos; Disco óptico; Doenças do nervo óptico/diagnóstico; Fibras nervosas/patologia; Retina
INTRODUCTION
Optical coherence tomography (OCT) is an imaging technology widely used in the management of glaucoma, which enables high-resolution, in vivo measurements of the retina(1,2). In particular, OCT-measured retinal nerve fiber layer (RNFL) thickness may detect glaucoma-related damage before the development of visual field (VF) defects(3,4). Recent advances in OCT technology, using spectral-domain (SD) signal detection, significantly increased scanning speed and resolution compared to time-domain (TD) OCT(5-7). The basic differences between TD and SD-OCT have been described elsewhere(7). In brief, both technologies use an interferometer to measure echo time delay of backscattered light, however, SD-OCT utilizes information obtained from wavelength-specific interference patterns to determine signal depth. In contrast, TD-OCT depends on movements of a reference mirror resulting in increased image acquisition time. Among the advantages of SD over TD-OCT are: reduction in motion artifacts, improvement in axial resolution and better reproducibility of RNFL measurements(8,9). In fact, recent studies have shown that these related, but distinct technologies are not interchangeable, with significant differences in RNFL measurements between them(10,11). There is still controversy whether SD improves diagnostic ability compared to TD-OCT in glaucoma(12-14).
Previous cross-sectional studies suggested that glaucomatous VF defects commonly occurs in one hemifield (superior more commonly than inferior), frequently respecting the horizontal meridian until moderate to advanced stages of the disease(15,16). The assumption that glaucomatous damage occurs asymmetrically across the horizontal meridian is taken into account for example when Glaucoma Hemifield TestTM (GHT, Carl-Zeiss Meditec, Dublin, CA) assesses significant differences between superior and inferior regions of the VF. Asymmetric glaucomatous damage is also observed in hemiretinas, both in peripapillary RNFL(17,18), and in macular thickness measurements(19).
Taking into account evidence that RNFL thinning precedes VF loss in glaucoma(20,21), the asymmetric glaucoma damage may be an interesting model to evaluate TD and SD-OCT ability to detect RNFL loss before development of VF defect. This study aims to evaluate the RNFL thickness measured with TD and SD-OCT, and to compare the diagnostic ability of both equipments to detect RNFL loss in glaucomatous patients with asymmetric VF loss restricted to one hemifield.
METHODS
SUBJECTS
Thirty-six patients with glaucoma and 36 age-matched healthy controls participated in this cross-sectional study, conducted at the Division of Ophthalmology of the University of São Paulo Medical School. Institutional Review Board / Ethics Committee approved the study, and written informed consent was obtained from all participants before inclusion in the study. The protocol was in compliance with Good Clinical Practices and the Declaration of Helsinki (1996).
The study population included adults between 45 and 85 years old from both genders, with diagnosis of primary open-angle glaucoma (POAG) and asymmetric glaucomatous hemifield sensitivity loss. Patients were selected based on pattern deviation maps using a modified Hodapp's criterion for diagnosis of glaucoma(22), which was applied to hemifield rather than global VF deficit. An eye was classified as having asymmetrical VF loss when all the following conditions were present: (1) presence of at least 3 abnormal contiguous points in one hemifield (affected hemifield), at a significance level of less than 1%, with at least one of those less than 0.5%; (2) presence of a GHT "outside normal limits"; and (3) absence of any test point in the opposite hemifield (non-affected) with significance level of less than 2% (Figure 1). Two consecutive VFs were required to confirm the defect. Only one eye per patient was included; when both eyes were eligible one eye was randomly selected.
Other inclusion criteria were best corrected visual acuity (BCVA) equal to or better than +0.3 (20/40) logarithm minimum angle of resolution (logMAR) in the study eye, spherical refraction within ± 5.00 diopters (D) and cylinder refraction within ± 3.00 D. Exclusion criteria were concomitant ocular disease, systemic medication known to affect the optic nerve and/or the VF, and a mean deviation (MD) worse than -16.0 dB.
Healthy controls were recruited from patients' relatives and church groups. They had a normal eye examination, intraocular pressure <21 mmHg, BCVA equal to or better than +0.3 logMAR, spherical refraction within ± 5.00 D, cylinder refraction within ± 3.00 D, and normal VFs (defined as a GHT "within normal limits" and an MD equal to or better than -2.0 dB). For comparative analysis one eye was randomly selected as the study eye.
VISUAL FIELD ASSESSMENT
Standard automated perimety (SAP) was performed using the Humphrey Field Analyzer (Carl Zeiss Meditec, Dublin, CA, Sweedish Interactive Threshold Algorithm, 24-2 test). The hemifield sensitivity loss (hemifield MD) in dB units was calculated by averaging total deviation values in the superior and inferior hemifields separately for patients and healthy controls. Only patients with at least 2 previous VF tests were included.
OPTICAL COHERENCE TOMOGRAPHY ASSESSMENT
On the same visit subjects underwent imaging with two commercially available OCT systems: 1) Stratus-OCT (Carl Zeiss Meditec Inc., Dublin, California, USA), and 2) 3D OCT-1000 (Topcon, Tokyo, Japan). Stratus-OCT uses TD signal detection to acquire an image with 8 to 10 µm axial resolution and 512 axial scans in 1.3 seconds. The fast RNFL protocol was used to obtain RNFL thickness measurements in TD-OCT (Figure 1). Three images were acquired from each subject, with each image consisting of 256 A scans along a 3.4 mm-diameter circular ring. RNFL thickness parameters calculated by Stratus-OCT software (version 4.0.1) and evaluated in this study were average thickness (360 degrees), superior quadrant thickness (46-135 degrees) and inferior quadrant thickness (226-315 degrees).
The 3D OCT-1000 uses SD signal detection to acquire an image with 6 µm axial resolution. The acquisition scan protocol used for SD-OCT acquires a set of three high-definition OCT images of the optic nerve head (ONH) region in a raster pattern covering a 6 x 6 mm area with a scan density of 128 x 512 in 3.6 seconds (18,000 A scans/sec). Among the available analysis we chose the map closest to that used by the Stratus-OCT in order to make findings from the two devices as comparable as possible. Thus, we employed the RNFL peripapillary map, which consists of a 3.4 mm-diameter circle around the optic disc. RNFL thickness parameters calculated by 3 D OCT-1000 and used in this study were similar to the ones provided by Stratus-OCT.
One author (ASCR) reviewed the images with respect to their subjective and objective quality. For TD-OCT the examiner required that the scans had good quality with focused images, signal strength >7 and presence of a centered circular ring around the optic disc. Criteria for acceptable 3 D OCT-1000 included: 1) no large eye movements, defined as an abrupt shift completely disconnecting a large retinal vessel; 2) consistent signal intensity level across the scan; and 3) no black bands (caused by blinking) throughout the examination.
ANALYSIS
Mann-Whitney and Kruskal-Wallis tests were used to compare continuous data between groups, and Wilcoxon between OCTs. Pearson's Chi-Square test was used to compare categorical data. Spearman rank correlation was performed to test correlations between the two devices. Presence of RNFL thinning was established on the basis of the normative database provided by OCT software. RNFL thickness measurements outside the 95% prediction interval for age-matched normal thickness were considered abnormal.
The degree of VF asymmetry was evaluated by ''asymmetry index''(17), defined as the ratio between affected and non-affected hemifield MD in eyes with glaucoma. For the purpose of comparing with RNFL thickness ratio, each test point in the total deviation plot was converted to 1/Lambert units (dB = 10 x Log [1/Lambert]). An asymmetry index of 1 indicated comparable values in the hemifields (perfect symmetry) and an asymmetry index lower than 1 signified larger differences between affected and non-affected glaucomatous hemifields (increased asymmetry)(17). RNFL ratios were calculated using the inferior and superior peripapillary measurements similarly to VF "asymmetry index" in micron units. All analyses were performed in the open-source environment R(23).
RESULTS
Data from 36 patients with asymmetric hemifield defect and 36 healthy age-matched controls included in this analysis are shown in Table 1. The groups were similar in age (P=0.92) and gender (P=0.91). Patients with glaucoma had on average early to moderate VF damage (mean [SD] MD, -8.8 [3.4] dB); 27 had the superior and 9 had the inferior hemifield affected. Global RNFL thickness was greater with TD than with SD-OCT (P=0.02 and <0.001, for patients and controls, respectively, Table 1).
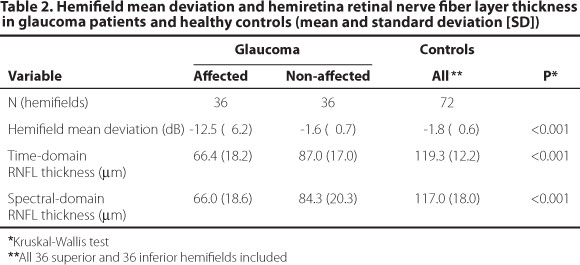
The hemifield MD and corresponding hemiretina RNFL measurements in glaucoma patients and healthy controls are shown in Table 2. Affected hemifields had worse MD compared with non-affected hemifields (P<0.001). Hemiretinas corresponding to affected hemifields had thinner RNFL measurements compared to the opposite hemirretinas both in TD and in SD-OCT (P<0.001 for both). Healthy controls had similar MD in opposite hemifields (P=0.65), in addition to similar RNFL measurements in opposite hemiretinas, in both TD (P=0.61) and SD-OCT (P=0.54). RNFL measurements obtained with both devices were correlated in patients (ρ=0.61 and 0.78, P<0.001, for global and hemiretina measurements, respectively) and controls (ρ=0.53 and 0.57, P<0.001, for global and hemiretina measurements, respectively).
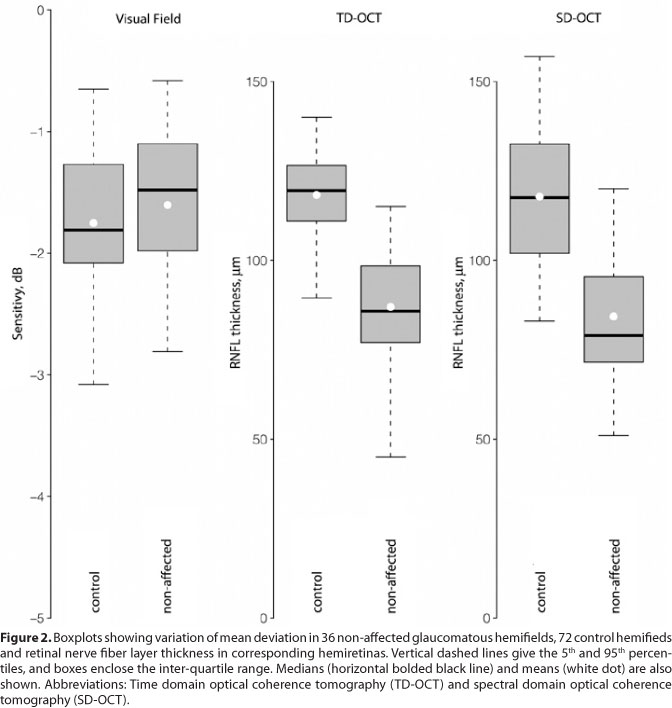
Non-affected glaucomatous hemifields had similar MD (mean [SD], -1.6 [0.7] dB) compared to healthy controls (-1.8 [0.6] dB, P=0.15, Figure 2). RNFL measurements in hemiretinas corresponding to non-affected hemifields (87.0 [17.1] µm and 84.3 [20.2] µm, for TD and SD-OCT, respectively) were thinner than in hemiretinas of healthy controls (119.3 [12.2] P<0.001, and 117.0 [18.0] P<0.001, for TD and SD-OCT, respectively, Figure 2).
On the basis of the normative database supplied by OCT software, RNFL thinning (outside the 95% prediction interval for normal thickness) was present in 32 of 36 (89%) of hemiretinas corresponding to affected hemifields for both TD and SD-OCT. RNFL thinning was present in 15 of 36 (42%) for TD-OCT, and in 24 of 36 (67%) of hemiretinas corresponding to non-affected hemifields in SD-OCT (P=0.01, chi-square test). Fourteen (39%) hemiretinas corresponding to non-affected hemifieds presented RNFL thinning in both TD and SD-OCT, 1 (3%) only in TD and 10 (28%) only in SD-OCT. RNFL thinning was not observed in hemiretinas of healthy controls according to normative databases.
The RNFL thickness asymmetry index in patients with glaucoma was similar between OCTs (mean, [SD] 0.76 [0.17] for TD, and 0.79 [0.12] for SD-OCT) and significantly greater than the VF asymmetry index (0.36 [0.20], P<0.001), indicating greater asymmetry in VF sensitivity than in RNFL thickness between hemifields and hemiretinas, respectively. VF asymmetry indexes were better correlated to SD-OCT RNFL asymmetry indexes (ρ=0.33, P=0.04) than to TD-OCT asymmetry indexes (ρ=0.19, P=0.33).
DISCUSSION
Numerous cross-sectional studies have shown that the Stratus-OCT is an effective tool for the diagnosis of glaucoma(2-4,12), but in recent years, several companies have developed newer versions of OCT, such as the 3D OCT-1000, which uses SD-OCT technology. These new generation OCTs offer scanning speed up to 200 times faster and higher axial resolution than the conventional TD-OCT(14). However, despite increased imaging resolution, it is still controversial whether SD-OCT has improved diagnostic ability compared to TD-OCT in glaucoma patients(12-14,24).
In the current study the presence of RNFL thinning in glaucoma patients with asymmetric visual hemifield loss was investigated with Stratus-OCT and 3D OCT-1000. As expected, RNFL in corresponding hemifields with VF loss (affected hemifields) was found to be significantly thinner than in corresponding hemifields with no VF loss (non-affected hemifields). Comparison of RNFL thickness measurements with normative database supplied by OCT software indicated that 89% of affected hemifields had RNFL thinning for both devices. Surprisingly both OCTs did not detect RNFL loss in 11% of corresponding hemifields with confirmed VF loss. It is possible that in these hemiretinas, RNFL defects were present, but were small or focal and therefore not detected by the average RNFL thickness measurements.
Since structural damage may precede irreversible functional decay in glaucoma(21,25), we were particularly interested in investigating the OCT ability to detect RNFL loss in hemiretinas corresponding to normal hemifields of patients with glaucoma. RNFL thickness in such hemiretinas was significantly thinner than the corresponding hemiretinas of normal controls, measured with both devices. In addition, SD-OCT assigned a significant higher percentage of hemiretinas as abnormal (67%) compared to TD-OCT (42%). The higher sensitivity of SD-OCT in our study may be due to the higher scan resolution and more accurate data registration from the improved technology. Sung and colleagues(13) also found a higher sensitivity of SD-OCT compared to TD-OCT in an abnormal classification of mean RNFL thickness from glaucomatous eyes as defined by the VF test. Differently, Chang et al.(26), reported that the sensitivity and specificity of SD-OCT for classification of abnormal RNFL thickness for glaucoma detection were equivalent to those of TD-OCT.
Despite fundamental differences between these two technologies, such as distinct scan registration, image segmentation algorithms, data processing and analysis, RNFL measurements demonstrated moderate associations between the two devices (ρ=0.61 and 0.53, P<0.001, for global measurements in glaucoma patients and healthy controls, respectively). However, RNFL measurements with TD-OCT were consistently greater than those with SD-OCT, confirming previous observations(8,27,28). These differences appear to be primarily attributable to the analysis algorithms used to set retinal inner and outer boundaries(11,12). In our study, only hemiretinas corresponding to affected hemifields had a tendency towards similar RNFL measurements between TD and SD-OCT (Table 2). This is in agreement with a previous published work by Knight et al.(29), in which they pointed out that RNFL measurements made with TD-OCT tend to be thicker than those made with SD-OCT, except when the RNFL is very thin, as in severe glaucoma.
Badlani et al., found greater RNFL thickness symmetry compared to VF sensitivity symmetry in glaucoma patients with asymmetric visual hemifield loss using TD-OCT(17). Our results partially agree with theirs, although we did find a slightly greater RNFL asymmetry measured with TD-OCT. This slightly disagreement between the two studies might be explained by differences in study design: while in our study the non-affected hemifields had absence of any test point with significance level of less than 2%, in their study such hemifields were allowed to have up to 15% of the points depressed below the 1% level. The presence of more symmetrical RNFL loss found in both studies suggests that OCT may be capable of detecting early RNFL loss before occurrence of new, or development of advanced VF loss. Longitudinal studies in glaucoma patients with asymmetric VF loss are needed to confirm this assumption.
Our study has some limitations. In order to use internal normative databases provided by the two OCTs, we chose the quadrant analysis rather than actual hemiretinas to compare superior and inferior hemifields to inferior and superior RNFL thickness, respectively. Since we were not reporting on structure-function relationship, which requires a more precise correspondence between regions in VF and sectors of optic disc, we judged the quadrant analysis appropriate to compare the two devices. Patients were recruited on the basis of asymmetric VF loss, making it difficult to conclude that RNFL loss occurs in a more symmetrical pattern than VF loss. It may be interesting in future research to observe VF asymmetry in patients recruited on the basis of asymmetric RNFL thickness loss. In addition, it has been established that the severity of visual field loss have significant influence on the performance of imaging devices used for glaucoma diagnosis(30). In our study, the inclusion of patients with moderate to advanced visual field loss may have increased the diagnostic performance in both TD and SD-OCT devices.
CONCLUSION
The current study demonstrates that hemiretinas corresponding to normal hemifields of glaucomatous eyes have significantly lower RNFL thickness parameters than the corresponding retinal regions of healthy eyes, as measured by TD and SD-OCT. SD-OCT tended to detect more RNFL loss in such patients than TD-OCT. In addition, despite moderate correlation between RNFL measurements acquired with Stratus-OCT and 3 D OCT-1000, clinicians should be aware that the two devices cannot be directly compared due to systematic differences between measurements made by the two instruments.
Submitted for publication: August 26, 2011
Accepted for publication: December 6, 2011
Study carried out at the Departamento de Oftalmologia, Universidade de São Paulo - USP - São Paulo (SP), Brazil.
Funding: This study was supported by Fundação Capes, Ministério da Educação, Brasília, Brazil.
Financial support: Capes foundation, Brazilian Ministry of Educatiil, Brasilia, Brazil (ASCR). Fundação de Amparo à Pesquisa do Estado de São Paulo (FAPESP, grant 2009/50174-0, MLRM).
Ethics approval: Comissão de Ética para Análise de Projetos de Pesquisa (CAPPesq) da Diretoria Clínica do Hospital das Clínicas e da Faculdade de Medicina da Universidade de São Paulo. Protocolo nº 0115/08.
Disclosure of potential conflicts of interest: A.S.C.Reis, None; K.S.M.Vidal, None; A.C.Kreuz, None; M.L.R.Monteiro, None; M.T.Nicolela, None; R.F.S.Malta, None.
-
1Chang R, Budenz DL. New developments in optical coherence tomography for glaucoma. Curr Opin Ophthalmol. 2008;19(2):127-35.
-
2Sakata LM, Deleon-Ortega J, Sakata V, Girkin CA. Optical coherence tomography of the retina and optic nerve - a review. Clin Experiment Ophthalmol. 2009;37(1):90-9.
-
3Kim TW, Park UC, Park KH, Kim DM. Ability of Stratus OCT to identify localized retinal nerve fiber layer defects in patients with normal standard automated perimetry results. Invest Ophthalmol Vis Sci. 2007;48(4):1635-41.
-
4Lalezary M, Medeiros FA, Weinreb RN, Bowd C, Sample PA, Tavares IM, et al. Baseline optical coherence tomography predicts the development of glaucomatous change in glaucoma suspects. Am J Ophthalmol. 2006;142(4):576-82.
-
5Wojtkowski M, Srinivasan V, Fujimoto JG, Ko T, Schuman JS, Kowalczyk A, et al. Three-dimensional retinal imaging with high-speed ultrahigh-resolution optical coherence tomography. Ophthalmology. 2005;112(10):1734-46.
-
6van Velthoven ME, Faber DJ, Verbraak FD, van Leeuwen TG, de Smet MD. Recent developments in optical coherence tomography for imaging the retina. Prog Retin Eye Res. 2007;26(1):57-77.
-
7Drexler W, Fujimoto JG. State-of-the-art retinal optical coherence tomography. Prog Retin Eye Res. 2008;27(1):45-88.
-
8Arthur SN, Smith SD, Wright MM, Grajewski AL, Wang Q, Terry JM, et al. Reproducibility and agreement in evaluating retinal nerve fibre layer thickness between Stratus and Spectralis OCT. Eye (Lond). 2011;25(2):192-200.
-
9Gonzalez-Garcia AO, Vizzeri G, Bowd C, Medeiros FA, Zangwill LM, Weinreb RN. Reproducibility of RTVue retinal nerve fiber layer thickness and optic disc measurements and agreement with Stratus optical coherence tomography measurements. Am J Ophthalmol. 2009;147(6):1067-74.
-
10Johnson DE, El-Defrawy SR, Almeida DR, Campbell RJ. Comparison of retinal nerve fibre layer measurements from time domain and spectral domain optical coherence tomography systems. Can J Ophthalmol. 2009;44(5):562-66. Comment in: Can J Ophthalmol. 2010;45(2):176; author reply 176-7.
-
11Seibold LK, Mandava N, Kahook MY. Comparison of retinal nerve fiber layer thickness in normal eyes using time-domain and spectral-domain optical coherence tomography. Am J Ophthalmol. 2010;150(6):807-14.
-
12Naithani P, Sihota R, Sony P, Dada T, Gupta V, Kondal D, et al. Evaluation of optical coherence tomography and heidelberg retinal tomography parameters in detecting early and moderate glaucoma. Invest Ophthalmol Vis Sci. 2007;48(7):3138-45.
-
13Sung KR, Kim DY, Park SB, Kook MS. Comparison of retinal nerve fiber layer thickness measured by Cirrus HD and Stratus optical coherence tomography. Ophthalmology. 2009;116(7):1264-70.
-
14Sung KR, Kim JS, Wollstein G, Folio L, Kook MS, Schuman JS. Imaging of the retinal nerve fibre layer with spectral domain optical coherence tomography for glaucoma diagnosis. Br J Ophthalmol. 2010;95(7):909-14.
-
15Gazzard G, Foster PJ, Viswanathan AC, Devereux JG, Oen FT, Chew PT, et al. The severity and spatial distribution of visual field defects in primary glaucoma: a comparison of primary open-angle glaucoma and primary angle-closure glaucoma. Arch Ophthalmol. 2002;120(12):1636-43.
-
16Araie M. Pattern of visual field defects in normal-tension and high-tension glaucoma. Curr Opin Ophthalmol. 1995;6(2):36-45.
-
17Badlani V, Shahidi M, Shakoor A, Edward DP, Zelkha R, Wilensky J. Nerve fiber layer thicksness in glaucoma patients with asymmetric hemifield visual field loss. J Glaucoma. 2006;15(4):275-80.
-
18Choi J, Cho HS, Lee CH, Kook MS. Scanning laser polarimetry with variable corneal compensation in the area of apparently normal hemifield in eyes with normal-tension glaucoma. Ophthalmology. 2006;113(11):1954-60.
-
19Bagga H, Greenfield DS, Knighton RW. Macular symmetry testing for glaucoma detection. J Glaucoma. 2005;14(5):358-63.
-
20Hood DC, Kardon RH. A framework for comparing structural and functional measures of glaucomatous damage. Prog Retin Eye Res. 2007;26(6):688-710.
-
21Sommer A, Katz J, Quigley HA, Miller NR, Robin AL, Richter RC, et al. Clinically detectable nerve fiber atrophy precedes the onset of glaucomatous field loss. Arch Ophthalmol. 1991;109(1):77-83.
-
22Hodapp E, Parrish RK, Anderson DR. Clinical decisions in glaucoma. St Louis: CV Mosby; 1993.
-
23Development Core Team. R: A language and environment for statistical computing: R-Foundation for Statistical Computing. Vienna, Austria; 2011.
-
24Moreno-Montañés J, Olmo N, Alvarez A, Garcia N, Zarranz-Ventura J. Cirrus high-definition optical coherence tomography compared with Stratus optical coherence tomography in glaucoma diagnosis. Invest Ophthalmol Vis Sci. 2010;51(1):335-43.
-
25Zeyen TG, Caprioli J. Progression of disc and field damage in early glaucoma. Arch Ophthalmol. 1993;111(1):62-5.
-
26Chang RT, Knight OJ, Feuer WJ, Budenz DL. Sensitivity and specificity of time-domain versus spectral-domain optical coherence tomography in diagnosing early to moderate glaucoma. Ophthalmology. 2009;116(12):2294-99.
-
27Costa-Cunha LV, Cunha LP, Malta RF, Monteiro ML. Comparison of Fourier-domain and time-domain optical coherence tomography in the detection of band atrophy of the optic nerve. Am J Ophthalmol. 2009;147(1):56-63.
-
28Hong S, Seong GJ, Kim SS, Kang SY, Kim CY. Comparison of peripapillary retinal nerve fiber layer thickness measured by spectral vs. time domain optical coherence tomography. Curr Eye Res. 2011;36(2):125-34.
-
29Knight OJ, Chang RT, Feuer WJ, Budenz DL. Comparison of retinal nerve fiber layer measurements using time domain and spectral domain optical coherent tomography. Ophthalmology. 2009;116(7):1271-7.
-
30Medeiros FA, Zangwill LM, Bowd C, Sample PA, Weinreb RN. Influence of disease severity and optic disc size on the diagnostic performance of imaging instruments in glaucoma. Invest Ophthalmol Vis Sci. 2006;47(3):1008-15.
Publication Dates
-
Publication in this collection
27 Apr 2012 -
Date of issue
Feb 2012
History
-
Received
26 Aug 2011 -
Accepted
06 Dec 2011