Abstracts
Radiometric changes observed in multi-temporal optical satellite images have an important role in efforts to characterize selective-logging areas. The aim of this study was to analyze the multi-temporal behavior of spectral-mixture responses in satellite images in simulated selective-logging areas in the Amazon forest, considering red/near-infrared spectral relationships. Forest edges were used to infer the selective-logging infrastructure using differently oriented edges in the transition between forest and deforested areas in satellite images. TM/Landsat-5 images acquired at three dates with different solar-illumination geometries were used in this analysis. The method assumed that the radiometric responses between forest with selective-logging effects and forest edges in contact with recent clear-cuts are related. The spatial frequency attributes of red/near infrared bands for edge areas were analyzed. Analysis of dispersion diagrams showed two groups of pixels that represent selective-logging areas. The attributes for size and radiometric distance representing these two groups were related to solar-elevation angle. The results suggest that detection of timber exploitation areas is limited because of the complexity of the selective-logging radiometric response. Thus, the accuracy of detecting selective logging can be influenced by the solar-elevation angle at the time of image acquisition. We conclude that images with lower solar-elevation angles are less reliable for delineation of selecting logging.
Mudanças radiométricas observadas em imagens multitemporais de satélites ópticos têm importante papel na caracterização de áreas afetadas pelo corte seletivo. O objetivo desse estudo foi analisar o comportamento multitemporal da resposta da mistura espectral em imagens de satélite de áreas simuladas por corte seletivo de madeira na floresta amazônica, considerando as relações espectrais do vermelho/infravermelho próximo. Para a análise dos dados foram utilizadas as margens da floresta para inferir a infraestrutura de exploração florestal em diferentes orientações a partir da transição entre áreas de floresta e desmatamento em imagens de satélite. Imagens do sensor TM/Landsat-5 adquiridas em três datas distintas com diferentes geometrias de iluminação solar foram utilizadas na análise. O método utilizado presume que as respostas radiométricas entre a floresta com efeitos do corte seletivo e as margens da floresta em contato com áreas recém-desmatadas estão relacionadas. Os atributos da frequência espacial das bandas espectrais do vermelho/infravermelho próximo foram analisados. A análise dos diagramas de dispersão mostraram dois grupos de pixels que representam áreas de corte seletivo. Os atributos de tamanho e distância radiométrica representando esses dois grupos foram relacionados com o ângulo de elevação solar. Os resultados sugerem que a detecção de áreas exploradas é limitada devido à complexidade da resposta radiométrica do corte seletivo. Assim, a acurácia em detectar o corte seletivo pode ser influenciada pelo ângulo de elevação solar durante a aquisição das imagens. Nós concluímos que imagens com ângulos de elevação solar baixos são menos confiáveis para a delimitação do corte seletivo.
exploração madeireira; desmatamento; sensoriamento remoto; monitoramento florestal
INTRODUCTION
Timber extraction is one the primary human activities that has contributed to forest degradation in the tropics (Hirschmugl et al. 2014Hirschmugl, M.; Steinegger, M.; Gallaun, H.; Schardt, M. 2014. Mapping forest degradation due to selective logging by means of time series analysis: case studies in Central Africa. Remote Sensing, 6: 756-775.). Logging affects tropical forests at the continental scale and is difficult to detect, making monitoring a challenge to be overcome. Satellite imagery with medium spatial resolution (20 to 30 m) has potential utility for obtaining good cost-benefit results under these conditions. Among the procedures applied for detection and mapping of selective-logging activities, the most commonly used has been visual interpretation of medium spatial-resolution imagery using images enhanced by contrast-stretching techniques. However, selective logging is a kind of forest degradation that presents difficulties for detection and mapping with medium-resolution imagery (Stone and Lefebvre 1998Stone, T.A.; Lefebvre, P. 1998. Using multi-temporal satellite data to evaluate selective logging in Para, Brazil. International Journal of Remote Sensing 19: 2517- 2526.; Asner et al. 2002Asner, G.P.; Keller, M.; Pereira, R.; Zweede, J.C. 2002. Remote Sensing of Selective Logging in Amazonia: assessing limitations based on detailed field observations, Landsat ETM+, and Textural Analysis. Remote Sensing of Environment, 80: 483-496.; Anwar and Stein 2012Anwar, S.; Stein, A. 2012. Detection and spatial analysis of selective logging with geometrically corrected Landsat images. International Journal of Remote Sensing, 33: 7820-7843.).
Several detection studies of selective logging have been done in the Amazon region to estimate the area affected by this kind of forest degradation (Asner et al. 2005Asner, G.P.; Knapp, D.E.; Broadbent, E.N.; Oliveira, P.J.C.; Keller, M.; Silva, J.N. 2005. Selective logging in the Brazilian Amazon. Science, 310: 480-482.; Souza et al. 2005Souza Jr., C.; Roberts, D. A.; Cochrane, M.A. 2005. Combining spectral and spatial information to map canopy damage from selective logging and forest fires. Remote Sensing of Environment, 98: 329-343.; Graça et al. 2008Graça, P.M.L.A.; Maldonado, F.D.; Santos, J.R.; Soares, J.V. 2008. Detecção do corte seletivo de madeira por técnica de rotação radiométrica na floresta amazônica, Ambiência, 4: 97-106.). Researchers recognize that methods for selective-logging detection must be improved given the complexity of the spectral behavior of mixed pixels in altered tropical forest. In addition, spectral responses of some elements of forest logging that must be detected vary in space and time in accord with the solar-elevation angle and the solar-azimuth angle (De Wasseige and Defourny 2004De Wasseige, C.; Defourny, P.2004. Remote sensing of selective logging impact for tropical forest management. Forest Ecology and Management, 188: 161-173.). Changes occur with differing intensities for the different landscape elements that characterize timber exploitation areas. As a result, interpretation and classification of selective logging tend to be complex.
Infrastructure for selective-logging activities (such as logging decks, skid trails, access roads and canopy gaps created by tree falls) produces characteristic modifications of the forest environment (Johns et al. 1996Johns, J.S.; Barreto, P.; Uhl, C. 1996. Logging damage during planned and unplanned logging operations in the eastern Amazon. Forest Ecology and Management, 89: 59-77.). The spatial distribution of these elements allows delimitation of selective-logging areas inside the forest based on the increase in frequency of pixels with a soil-surface reflectance contribution. In some pixels these contributions vary in intensity as a result of differences in light passage through canopy gaps. The form, size and orientation of the canopy gaps are the main causes of variations in the intensity of light reflected from the soil surface inside the forest. The complexity of analysis increases when one considers that the spectral behavior of pixels in selective-logging areas can be associated with the solar illumination geometry (De Wasseige and Defourny 2004De Wasseige, C.; Defourny, P.2004. Remote sensing of selective logging impact for tropical forest management. Forest Ecology and Management, 188: 161-173.). In this context, the objective of the present study was to investigate the multi-temporal radiometric behavior of areas of selective logging using forest edges as proxy.
MATERIALS AND METHODS
Study area
This study was carried out in the municipality of Extrema de Rondônia, Rondônia state, in the Brazilian Amazon, with its central coordinates at 9° 50´ S; 66° 40´ W. The study area measured 90 km × 50 km and represented a subsample of the TM/Landsat scene (Figure 1). The study area is covered by lowland Amazonian Ombrophilous Open Forest, with an average canopy height of 25 m. There were clear-cuts and areas that had undergone timber-exploitation activities with low to moderate impact where government management plans had been established. Large areas of cattle pasture represent the predominant land use in the surrounding landscape. The predominant soil type in this region is Yellow Latosol (Oxisol) (Ker 1997Ker, J.C. 1997. Latossolos do Brasil: uma revisão. Geonomos, 5: 17-40.).
Satellite images and auxiliary information
We used three TM/Landsat-5 scenes (Path/Row 001/067) dated July 13, 2009, September 15, 2009 and October 1, 2009. Two TM spectral bands were considered: TM3 (630-680 nm) and TM4 (775-900 nm) in order to evaluate radiometric changes in this radiometric space. These are the bands used by most vegetation indices that are employed in forest-change detection (Huete and Glenn 2011Huete, A.R.; Glenn, E.P. 2011. Remote sensing of ecosystem structure and function. In: Weng, O. (Ed.). Advances in Environmental. Remote Sensing Sensors, Algorithms, and Applications. CRC Press, Boca Raton, Florida, U.S.A., p. 291-320.).
The solar elevation angles during imaging were 45°, 58° and 62° for July, September and October, respectively. Computational algorithms implemented in Matlab software were used for analyzing the frequency of pixels in two-dimensional radiometric space derived from the TM3 and TM4 bands and for the process of subtracting the spectral frequency values, as well as for assessing the separability of the thematic classes. Routines for calculating Mahalanobis distances and the Geometric Separability Index were based on the algorithms formulated by Gupta (1998Gupta, S.D. 1998. Mahalanobis distance. In: Armitage, P.; Colton, T. (Eds.). Encyclopedia of Biostatistics. John Wiley & Sons, Chichester, New York, U.S.A., p. 2369-2372.) and Thornton (1997Thornton, C. 1997. Separability is a learner's best friend. In: Bullinaria, J.A.; Glasspool, D.W.; Houghton, G. (Eds.). Proceedings of the Fourth Neural Computation and Psychology Workshop Connectionist Representations. Springer-Verlag, London, UK, p. 40-47.), respectively.
The locations of observations were georeferenced during fieldwork in September 2009. The coordinates of these locations were used to define areas representing selective logging, the condition (impact level) of the forest and the dispersion and size of the logging decks. Pixels in areas of contact between forest and recent clear-cut were also identified.
Image pre-processing
Initially, the images were corrected and normalized to allow later multi-temporal analyses. The pre-processing of the images included sensor calibration and radiometric corrections. The TIC (Temporally Invariant Cluster) among spectral bands was used to normalize images, in accord with Chen et al. (2005Chen, X.; Vierling, L.; Deering, D. 2005. A simple and effective radiometric correction method to improve landscape change detection across sensors and across time. Remote Sensing of Environment, 98: 63-79.). This technique corrects for atmospheric interference and simultaneously normalizes the data to create radiometrically comparable data sets of surface reflectance values. The comparability of corrected data was controlled with SPM (Scatter Plot Matching) (Maas and Rajan 2010Maas, S.J.; Rajan, N. 2010. Normalizing and converting image DC data using scatter plot matching. Remote Sensing, 2: 1644-1661.).

Pixel sampling
In order to analyze spectral and radiometric complexity over time, a sufficient number of pixels had to be collected for statistical analysis. Areas of logging infrastructure are difficult to sample directly for radiometric comparisons because the areas are small (e.g., logging decks normally cover 1-4 pixels in TM / Landsat images). In the study area no timber exploitation areas were found with homogeneous patterns (meaning areas where logging had taken place at the same time and intensity), that were large enough to collect the number of samples required for the analysis of separability. Therefore, a satisfactory number of pixels for this analysis was obtained in the forest edge areas close to selective-logging locations in contact areas between forest and "recent" clear-cuts.
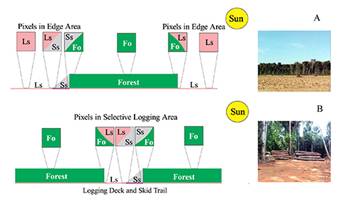
This assessment was based on the geometric similarity and the consistent illumination similarity between areas of forest selective logging and areas of forest edge in contact with recent clear-cuts. Geometric similarity between forest selective logging areas and edge areas of forest in contact with recent areas of clear-cut means that radiometric similarity can also be expected. This similarity is produced mainly by the solar illumination and by the vertical view of the optical sensor on the satellite. The schematic model in Figure 2illustrates the geometric similarity between areas of selective logging and forest edges.
The inner edges formed by logging decks and trails inside the forest are geometrically similar to forest edges bordering recent areas of clear-cut. In both areas there are abrupt contacts between soil and forest structures, and these contacts may or may not be exposed to solar illumination. Therefore, pixels with spectral mixtures between forest and soil in areas with forest cover altered by selective logging can be considered to be similar to the narrow strip of pixels at forest edges that are in contact with recent clear-cuts. These comparable aspects allow us to expect that analysis of edge areas will produce results similar to those from analysis of selective-logging areas.
Data extraction
Data used to analyze radiometric changes were obtained from three image subsets containing the areas of interest for each date. These image subsets contained only the edges of the forest in contact with areas of recent clear-cutting. The edges were defined by contacts between the forest and the clear-cut classes in images that had undergone a supervised classification. The contact lines defined the centers of five-pixel-wide strips (Figure 3). These strips, or image subsets, included only the linear contacts between forest and clear-cut, in addition to forest pixels and soil pixels. Each image subset was then divided into two image subsets based on the solar azimuth angle of each scene. One of these subsets was the sunlit subset containing only the forest edge facing the sun. The other subset, with the opposite orientation, had only forest edges under shadow. Therefore, three pairs of image subsets were obtained corresponding to July, September and October 2009.

Schematic model illustrating mixed pixels in edge areas between forest and clear-cut (a) and selective-logging areas (b). Note that mixtures are different in edge areas between forest and clear-cut, and that they are similar to those found inside selective-logging areas. Fo = Forest; Ls = Sunlit soil; Ss = Shaded soil. This figure is in color in the electronic version.

Details of the samples of forest edges: the sunlit subset is depicted by white polygons and the shaded subset by black polygons. Medium- and light-grey areas with rough texture represent the forest, while medium- and dark-grey areas with smooth texture represent exposed soil. Colored composite of TM/ Landsat-5 bands 3, 5 and 4 (RGB). This figure is in color in the electronic version.
Pixel-frequency analysis
The method developed for pixel analysis was based on algebraic operations using frequency arrays of red and near-infrared reflectance bands. Two subsets of data extracted from the images were established for each data set. The subsets represent pixels located in illuminated and shaded areas at the time of imaging of the satellite. These subsets were derived from contact between forest (pixels representative of vegetation components) and recent areas of clear-cut (pixels representative of bare-soil components). The frequencies of the reflectance values the pixels that make up each subset were positioned in a two-dimensional data array, defined by values obtained in the TM3 and TM4 bands. These data subsets were also represented in scatterplots for graphical evaluation. Subtraction operations were applied between data arrays for the same image and date. Pixel-frequency of reflectance values in the feature space from these two arrays (illuminated and shaded) were subtracted one-by-one.
The subtraction of the frequencies was defined as:
F(i,j) = Fsh(i,j) - Fsu(i,j), (1)
Where, F(i,j) is the frequency of the subtracted values in position (i,j) from red and infrared values, respectively. Fsh(i,j) is the frequency of the shaded-edge data subset, and Fsu(i,j) is the frequency of the sunlit-edge data subset. The indices i and j are non-negative integers, {i = 1,2, ..., (ρ TM3 max)} and {j = 1,2, ..., (ρ TM4 max)}
The outcome from the array of pixel frequencies represents only the values of the radiometric spatial attributes of sunlit edges (Equation 1). These pixels have mixtures formed spectrally by forest and sunlit soil. Conversely, if the sunlit-edge subset is subtracted from shaded-edge subset the outcome is the array of frequency pixels that only originate in the shaded-edge subset. The outcomes from subtraction of the arrangement frequencies in both directions were analyzed together.
Data analysis
The pixels were analyzed through their positions in red/ near-infrared radiometric space and the relations among groups in the bi-dimensional arrays were analyzed and characterized using two statistical-separability indices. These indices were D2 (Mahalanobis distance) (Gupta 1998Gupta, S.D. 1998. Mahalanobis distance. In: Armitage, P.; Colton, T. (Eds.). Encyclopedia of Biostatistics. John Wiley & Sons, Chichester, New York, U.S.A., p. 2369-2372.), and GSI (Geometric Separability Index) (Thornton 1997Thornton, C. 1997. Separability is a learner's best friend. In: Bullinaria, J.A.; Glasspool, D.W.; Houghton, G. (Eds.). Proceedings of the Fourth Neural Computation and Psychology Workshop Connectionist Representations. Springer-Verlag, London, UK, p. 40-47.). D2 (Mahalanobis distance) allows analysis of the relations among the subsets; its relative position changes between the seasons (Equation 2). The Mahalanobis distance measure was calculated using the theory of thematic classes, which involves normalized ellipses that approximately represent the data subset. These ellipses surround each subset of the data, and the larger semi-axis is directly correlated with what is represented by the group. Therefore, the Mahalanobis distance was expressed as the weighted distance between the elliptic-class centers. Mahalanobis distance calculation was performed as follows.
D2 = ( μ1-μ2 )T Σ-1 ( μ1 - μ2 ) (2)
Where, T denotes a transpose matrix, μ1 and μ2 are the means in each group, and Σ-1 denotes the covariance matrix of data in each group.
The GSI indicates the fraction of the data set that has nearest neighbors of the same class. As such, a value of one indicates a high degree of separability because all data points have nearest neighbors of the same class. A value of 0.5 corresponds to two random data sets with the same center point. This measure is based on an iterated function of the minimum Euclidean distance between individual points, where only two category subsets are involved. The separability index can be calculated quickly for any data set to provide a good indication of how successful a classifier will be if it is based on these data. The Geometric Separability Index is calculated as:
GSI(ƒ) = (Σn i=1 [ƒ(x i) + ƒ(x' i) + 1] mod 2)/n (3)
In Equation 3, ƒ(x i) is a target function of the data set, ƒ(x' i) is the nearest neighbor of x i and mod 2 is the modulus, which is the whole number remainder after division by 2. The choices are either 0 if the number is even or 1 if the number is odd. Finally, the indices allow evaluation of changes between these groups and the main group (forest). The Mahalanobis distance shows the proximities between these groups and the forest, while the GSI index indicates the overlap between these groups and the forest (the spectral separability).
RESULTS
Multi-temporal radiometric changes from frequency analysis
The results obtained with the array subtractions showed distinct spectral group. The scatter plots in Figures 4, 5 and 6 correspond to three different dates, each with a different solar-elevation angle. The relative positions of these groups could be considered as indications of the degree of separability between shaded and sunlit radiometric groups.
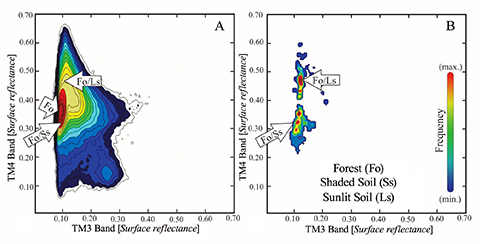
The array subtractions from July images showed that the two radiometric groups (sunlit and shaded elements) were clearly separated. However, these groups had radiometric values similar to that of the forest in the red spectral band. In the near infrared (TM4) band, the group of sunlit pixels (Fo/Ls) had slightly higher values than the forest, and the shaded group (Fo/Ss) had values slightly lower than the forest (Figure 4a). Note that, since the landscape in the image was dominated by forest cover, the scatter plot in Figure 4a had a high frequency of reflectance pixels in this class.
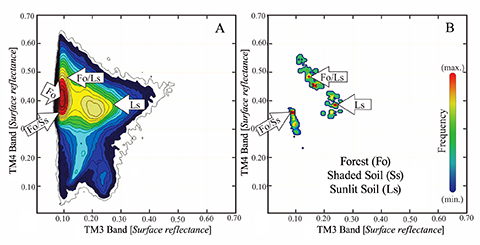
In Figure 5b, the two groups in the radiometric scatter plot for September were clearly separated. Additionally, the sunlit group (Fo/Ls) had high values in both spectral bands and a high level of dispersion in comparison with the July date. This dispersion could be a consequence of the variability of lighting of the soil surface in September. A group of pixels with a high proportion of sunlit soil (Ls) was present in this scatter plot, as could be inferred from the geometric model (Figure 1a). This group of pixels must also appear in areas of selective logging in the months with high angles of solar elevation.
In the September image (Figure 5), the shaded group (Fo/ Ss) had a position similar to that in the July image (Figure 4). This position was very close to the forest class; moreover, the frequency of pixels in the shaded group is lower than that in the sunlit group.
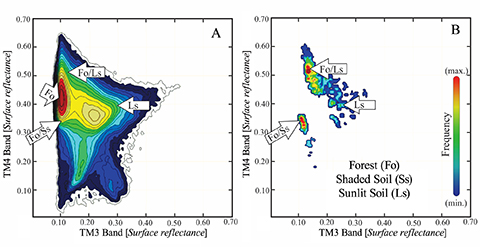
There was a higher frequency of sunlit-element pixels in the scatter plot from the October subsets as compared to the frequency of shaded elements (Figure 6b). The October image was obtained with a high angle of solar elevation (61°) and high lighting variability. The group with shaded elements in October had a lower radiometric position than the forest class in the red band, while the sunlit group had a higher frequency of pixels than the shaded group (Figure 6b). Thus, as in the September image, the dispersion of illuminated elements increased; consequently, the sunlit soil group (Ls) and intermediate elements between the forest edge and illuminated soil (Fo/Ls) increased. This effect is related to the higher solar-elevation angle in October as compared to September and July, decreasing the number of elements shaded by tall trees in the forest canopy.
Influence of solar angle on the separability of the Forest Class
The statistical parameters of the Forest Class in relation to image conditions indicated that the average reflectance value of the forest class increased with increasing solar-elevation angle (Table 1). The distance between the two spectral-mixture subsets (Forest with sunlit soil and Forest with shaded soil) can be compared with the forest in October (Figure 6). The positions of the subsets are indicated with arrows in Figure 6a, and they are shown as Mahalanobis distances in Table 2.
Separability between the forest class and the shade group (Fo/Ss) was lower by both indices (D2 and GSI) than was separability for the sunlit group for the solar-elevation angles considered. The lowest value was for the image with the lowest elevation angle (acquired in July). The distance between forest and shaded elements changed with the angle of solar elevation and the distance between forest and sunlit elements increases at higher angles (Table 2). In addition, the GSI values indicated that the separability between forest and sunlit elements was always complete, except in July (GSI=0.82). In July the solar elevation is lower than in the other months, and, considering the height of the forest, pixels containing forest gaps can have completely shaded soil; this corresponds to the group with low values in the scatter diagram in Figure 4b. The separability value between the shaded element group and the forest class was always below one; these values can be very low in July and September.
The proportions of shaded elements in the forest-edge areas decreased with increasing solar-elevation angle (Figures 3, 4 and 5 and Table 2). In the October image, with a higher solar-elevation angle, the proportion of shaded elements was strongly reduced, thereby improving the separability between groups.

Scatter plots of the image for July, a month for which the angle of solar elevation is low (45°): scatter plot of the complete image (a); scatter plot resulting from the subtraction procedure between frequencies in shaded edges and frequencies in sunlit edges and vice versa (b). Fo/Ls=Forest/Sunlit (Sunlit group) soil; Fo/Ss= Forest/Shaded soil (Shaded group). Arrows indicate the position of the sampled radiometric groups in the edge areas between forest and clear-cut and reference groups representing forest (Fo) and sunlit bare soil (Ls). This figure is in color in the electronic version.

Scatter plots of the image for September; the angle of solar elevation is intermediate (58°) in this month. Scatter plot of the complete image (a); scatter plot resulting from the subtraction procedure between frequencies in shaded edges and frequencies in sunlit edges and vice versa (b). Fo/Ls=Forest/ Sunlit (Sunlit group) soil; Fo/Ss= Forest/Shaded soil (Shaded group). Arrows indicate the position of the sampled radiometric groups in the edge areas between forest and clear-cut and reference groups representing forest (Fo) and sunlit bare soil (Ls). This figure is in color in the electronic version.

Scatter plot of the image for October image; the angle of solar elevation is greater (62°). Scatter plot of the complete image (a); scatter plot resulting from the subtraction procedure between frequencies in shaded edges and frequencies in sunlit edges and vice versa (b). Fo/Ls=Forest/Sunlit (Sunlit group) soil; Fo/Ss= Forest/Shaded soil (Shaded group). Arrows indicate the position of the sampled radiometric groups in the edge areas between forest and clear-cut and reference groups representing forest (Fo) and sunlit bare soil (Ls). This figure is in color in the electronic version.
Mahalanobis distance (D2) and Geometric Separability Index (GSI*) between subgroups in relation to the Forest Class.
DISCUSSION
Remote sensing techniques for detecting selective logging in the Amazon, including vegetation indices, should consider the effect of illumination geometry (Anderson et al. 2011Anderson, L.O.; Aragão, L.O.C.; Shimabukuro, Y.E.; Almeida S.; Huete, A. 2011. Fraction images for monitoring intra-annual phenology of different vegetation physiognomies in Amazonia. International Journal of Remote Sensing, 32:387-408.; Galvão et al. 2011Galvão, L.S.; dos Santos, J.R.; Roberts, D.A.; Breunig, F.M.; Toomey, M.; de Moura, Y.M. 2011. On intra-annual EVI variability in the dry season of tropical forest: A case study with MODIS and hyperspectral data. Remote Sensing of Environment , 115:2350- 2359.). Detection of logging activity is strongly related to operational structures; especially skid trails and logging decks for storing timber in the forest (Asner et al. 2004Asner, G.P.; Keller, M.; Pereira Jr, R.; Zweede, J.C.; Silva, J.N.M.2004. Canopy damage and recovery after selective logging in Amazonia: Field and satellite studies. Ecological Applications, 14: 280-298.; Souza et al. 2005Souza Jr., C.; Roberts, D. A.; Cochrane, M.A. 2005. Combining spectral and spatial information to map canopy damage from selective logging and forest fires. Remote Sensing of Environment, 98: 329-343.). However, the detection of features related to infrastructure is influenced by the geometry of the illumination at the time of image acquisition. Shading by tall trees in relation to the different positions of the sun can hide some of these features (De Wasseige and Defourny 2002De Wasseige, C.; Defourny, P. 2002. Retrieval of tropical forest structure characteristics from bi-directional reflectance of SPOT images. Remote Sensing of Environment , 83:362-375., 2004De Wasseige, C.; Defourny, P.2004. Remote sensing of selective logging impact for tropical forest management. Forest Ecology and Management, 188: 161-173.).
The near-infrared band performed better than did the red band for separating the shaded and sunlit groups. As De Wasseiger and Defourny (2004)De Wasseige, C.; Defourny, P.2004. Remote sensing of selective logging impact for tropical forest management. Forest Ecology and Management, 188: 161-173.point out, the near-infrared band has a high contrast between the forest and the areas affected by logging. However, the sunlit and shaded groups showed very similar values in the red band for the forest class, which makes it difficult to separate the operating structures from the forest by means of conventional statistical classifiers (e.g., maximum likelihood).
As solar-elevation angle increases, we observed that the illuminated-edge group had a greater frequency of high reflectance values in the red and near-infrared bands and an increased variability of illuminated elements. Conversely, there was a reduction in the elements present in the shaded group. Thus, the relative positions between groups were related to the solar-elevation angles. A lower angle in July increased the shaded group, and the soil surface was dark in both spectral bands. In the case with highest angle (October), the frequency of pixels with mixtures of forest and sunlit soil was dominant. Furthermore, the orientation of elongated openings, such as trails and secondary roads, produced high frequencies of pixels with sunlit soil when oriented close to the solar azimuth angle.
Logging structures such as skid trails and logging decks become more illuminated as a result of the higher solar elevation angle, increasing the reflectance values in both spectral ranges. Tropical forests have multi-layered canopies, where the treetops at the highest levels influence the spectral response of the elements present in the lower levels, such as understory vegetation, exposed soil in clearings in the forest, skid trails and logging decks. As found by Curran and Foody (1994Curran, P.J.; Foody, G.M. 1994. The use of remote sensing to characterize the regenerative states of tropical forest. In: Foody, G.M.; Curran, P.J. (Ed.). Environmental Remote Sensing from Regional to Global scales. Wiley, Chichester, UK, p. 44-83.), shadows produced by canopy foliage decrease the reflectance in near-infrared wavelengths. Thus, for images with higher solar-elevation angles, the apparent shading effect of the canopy elements was reduced and the average reflectance was higher for both spectral bands for the forest class.
Shaded elements present in selectively logged forest have reflectance values that are lower for soil, making them darker and closer to the average values of the forest-canopy reflectance. This was observed mainly in the red spectral band. This fact reduced the separability index between the forest class and the shade group (Fo/Ss) in images with lower solar-elevation angles.
In the October image the separation between the shaded group and the forest was most evident, allowing easy discrimination of the characteristic elements of selective logging within the forest. Therefore, a discriminating algorithm or even a visual interpreter has a better chance of separating the logging areas from the forest at this time of year at the latitude of our study area (~10° S).
The reliability of delimiting selective-logging areas increases when images with higher angles of solar elevation are used. This improvement in detection may be caused by the decrease in the number of shaded elements, since these elements always have low values of the separability index used to distinguish them from the forest. Moreover, the discrimination of sunlit elements is always good, and these produce a false feeling of success with the use of the current techniques. On the other hand, a large proportion of the shaded elements that are detected cannot be isolated from the forest. This demonstrates that, on average, the surface occupied by selective logging could be greatly underestimated, mainly in areas with low and medium impact from logging.
CONCLUSIONS
The results of analysis of the simulated infrastructure components in forest with selective logging show that the radiometric responses of these components vary with changes in solar-elevation angle and therefore vary seasonally. Logging infrastructure (e.g., logging decks, skid trails, access roads) has a lower rate of discrimination from forest when done using images with lower elevation angles because of the shading caused by treetops of forest canopy in the neighborhood. Thus, the results indicate that images with lower solar angles of elevation are less reliable for delineation of areas of selective logging than are images with higher solar angles of elevation. Consequently, detection algorithms and forest degradation indices from optical sensors may have a limited capacity for mapping selective logging when the influence of solar illumination is not considered in the analysis. Constraints that need to be considered the simulation procedure include the small dimensions of infrastructure such as skid trails and gaps, including those with some level of regeneration, in addition to the conditions of micro-relief in the logged area. These conditions may limit the reliability of analysis because they change the pattern that characterizes the target due to their influence on target illumination.
ACKNOWLEDGMENTS
The authors acknowledge grants from CNPq (National Council for Scientific and Technological Development) (Proc. 480108/2007-2, Proc. 573810/2008-7 (2009- 2014), 610042/2009-2) and Project PROCAD/CAPES (Coordination for the Improvement of Higher Education Personnel). Philip Fearnside and two anonymous reviewers provided comments on the manuscript.
- Anderson, L.O.; Aragão, L.O.C.; Shimabukuro, Y.E.; Almeida S.; Huete, A. 2011. Fraction images for monitoring intra-annual phenology of different vegetation physiognomies in Amazonia. International Journal of Remote Sensing, 32:387-408.
- Anwar, S.; Stein, A. 2012. Detection and spatial analysis of selective logging with geometrically corrected Landsat images. International Journal of Remote Sensing, 33: 7820-7843.
- Asner, G.P.; Keller, M.; Pereira, R.; Zweede, J.C. 2002. Remote Sensing of Selective Logging in Amazonia: assessing limitations based on detailed field observations, Landsat ETM+, and Textural Analysis. Remote Sensing of Environment, 80: 483-496.
- Asner, G.P.; Keller, M.; Silva, J.N.M. 2004. Spatial and temporal dynamics of forest canopy gaps following selective logging in the eastern Amazon. Global Change Biology, 10: 765-783.
- Asner, G.P.; Keller, M.; Pereira Jr, R.; Zweede, J.C.; Silva, J.N.M.2004. Canopy damage and recovery after selective logging in Amazonia: Field and satellite studies. Ecological Applications, 14: 280-298.
- Asner, G.P.; Knapp, D.E.; Broadbent, E.N.; Oliveira, P.J.C.; Keller, M.; Silva, J.N. 2005. Selective logging in the Brazilian Amazon. Science, 310: 480-482.
- Chen, X.; Vierling, L.; Deering, D. 2005. A simple and effective radiometric correction method to improve landscape change detection across sensors and across time. Remote Sensing of Environment, 98: 63-79.
- Curran, P.J.; Foody, G.M. 1994. The use of remote sensing to characterize the regenerative states of tropical forest. In: Foody, G.M.; Curran, P.J. (Ed.). Environmental Remote Sensing from Regional to Global scales. Wiley, Chichester, UK, p. 44-83.
- De Wasseige, C.; Defourny, P. 2002. Retrieval of tropical forest structure characteristics from bi-directional reflectance of SPOT images. Remote Sensing of Environment , 83:362-375.
- De Wasseige, C.; Defourny, P.2004. Remote sensing of selective logging impact for tropical forest management. Forest Ecology and Management, 188: 161-173.
- Galvão, L.S.; dos Santos, J.R.; Roberts, D.A.; Breunig, F.M.; Toomey, M.; de Moura, Y.M. 2011. On intra-annual EVI variability in the dry season of tropical forest: A case study with MODIS and hyperspectral data. Remote Sensing of Environment , 115:2350- 2359.
- Graça, P.M.L.A.; Maldonado, F.D.; Santos, J.R.; Soares, J.V. 2008. Detecção do corte seletivo de madeira por técnica de rotação radiométrica na floresta amazônica, Ambiência, 4: 97-106.
- Gupta, S.D. 1998. Mahalanobis distance. In: Armitage, P.; Colton, T. (Eds.). Encyclopedia of Biostatistics. John Wiley & Sons, Chichester, New York, U.S.A., p. 2369-2372.
- Hirschmugl, M.; Steinegger, M.; Gallaun, H.; Schardt, M. 2014. Mapping forest degradation due to selective logging by means of time series analysis: case studies in Central Africa. Remote Sensing, 6: 756-775.
- Huete, A.R.; Glenn, E.P. 2011. Remote sensing of ecosystem structure and function. In: Weng, O. (Ed.). Advances in Environmental. Remote Sensing Sensors, Algorithms, and Applications. CRC Press, Boca Raton, Florida, U.S.A., p. 291-320.
- Johns, J.S.; Barreto, P.; Uhl, C. 1996. Logging damage during planned and unplanned logging operations in the eastern Amazon. Forest Ecology and Management, 89: 59-77.
- Ker, J.C. 1997. Latossolos do Brasil: uma revisão. Geonomos, 5: 17-40.
- Maas, S.J.; Rajan, N. 2010. Normalizing and converting image DC data using scatter plot matching. Remote Sensing, 2: 1644-1661.
- Souza Jr., C.; Roberts, D. A.; Cochrane, M.A. 2005. Combining spectral and spatial information to map canopy damage from selective logging and forest fires. Remote Sensing of Environment, 98: 329-343.
- Stone, T.A.; Lefebvre, P. 1998. Using multi-temporal satellite data to evaluate selective logging in Para, Brazil. International Journal of Remote Sensing 19: 2517- 2526.
- Thornton, C. 1997. Separability is a learner's best friend. In: Bullinaria, J.A.; Glasspool, D.W.; Houghton, G. (Eds.). Proceedings of the Fourth Neural Computation and Psychology Workshop Connectionist Representations. Springer-Verlag, London, UK, p. 40-47.
Publication Dates
-
Publication in this collection
Jan-Mar 2015
History
-
Received
20 Mar 2014 -
Accepted
10 July 2014