
ABSTRACT:
Patients with chronic kidney disease (CKD) have paradoxical hemostatic potential because they have bleeding episodes but are also prone to thrombosis. Few studies have evaluated blood viscoelastic properties in dogs with kidney disease; on the other hand, hypercoagulability has been observed in these patients. It is also emphasized that the platelet function and its participation in this process have not yet been fully understood. The objective of this study was to evaluate and compare the Thrombin Generation Test (TGT) and also viscoelastic properties of the blood measured by thromboelastometry (TEM) in dogs with proteinuria in CKD. Twenty healthy dogs (Control Group) and 19 dogs with CKD in stage III or IV, classified according to International Renal Interest Society - IRIS, were selected, and the reference test of urine protein:creatinine ratio (UPCR) should be greater than one (CKD group). Blood samples for TEM, thrombin generation, Prothrombin Time (PT), activated Partial Thromboplastin Time (aPTT), and fibrinogen concentration was collected at a single time for both groups after inclusion criteria being confirmed. Statistical analysis was performed according to the distribution of variables at 5% significance level. Differences were observed between healthy dogs and those with proteinuria in CKD noted in TEM. The TGT was unable to differentiate between sick and healthy groups. However, when the nephropathy was stratified, increases in TTP and peak thrombin concentration by TGT were observed in females and dogs over 30 days of diagnosis of CKD. Both tests signaled a discrete state of hypercoagulability. In fact, TEM is more sensitive to detect hypercoagulability in dogs with CKD. However, the TGT has potential clinical application by allowing long-term sample storage.
INDEX TERMS:
Comparative analysis; thrombin generation; thromboelastometry; dogs; proteinuria in chronic kidney disease; chronic kidney disease; hemostasis; thrombosis; hemorrhage
RESUMO:
Os pacientes com doença renal crônica (DRC) apresentam um potencial hemostático paradoxal, pois apresentam episódios de sangramento, mas também são propensos à trombose. Poucos estudos avaliaram as propriedades viscoelásticas sanguíneas em cães com doenças renais, entretanto, a hipercoagulabilidade já foi observada nestes pacientes. Ressalta-se ainda que a função plaquetária e sua participação neste processo ainda não foram totalmente esclarecidas. O objetivo foi avaliar e comparar o teste de geração de trombina (TGT) e as propriedades viscoelásticas sanguíneas medidas pela tromboelastometria (TEM) em cães com DRC proteinúrica. Foram selecionados 20 cães saudáveis (grupo controle) e 19 cães com DRC em estágios III ou IV classificados segundo o IRIS e a relação proteína/creatinina urinária maior que um (grupo DRC). As amostras de sangue para a realização da tromboelastometria (TEM), geração de trombina, tempo de protrombina (TP), tempo de tromboplastina parcial ativada (TTPA) e concentração de fibrinogênio foram colhidas em momento único para ambos os grupos após os critérios de inclusão confirmados. A análise estatística foi realizada de acordo com a distribuição das variáveis, ao nível de 5% de significância. Foi observada diferença entre os cães saudáveis e os com DRC proteinúrica observados na TEM. O teste de geração de trombina não foi capaz de diferenciar os grupos doente e saudável. Entretanto, quando os nefropatas foram analisados de forma estratificada, foram observados aumentos do ETP e da concentração máxima de trombina (peak) pelo TGT em fêmeas e em cães com mais de 30 dias de diagnóstico da DRC. Ambos os testes sinalizando para um discreto estado de hipercoagulabiliade. A tromboelastometria é mais sensível para detectar a hipercoagulabilidade em cães com DRC. Entretanto, o teste de geração de trombina tem melhor aplicabilidade por permitir o armazenamento da amostra em longo prazo.
TERMOS DE INDEXAÇÃO:
Análise comparativa; testes de geração; trombina; tromboelastometria; cães; doença renal crônica proteinúrica; geração de trombina; hemostasia; trombose; hemorragia
Introduction
It has been noted that patients with chronic kidney disease (CKD) present paradoxical hemostatic potential, with increased rates of bleeding, and unfortunatelly these patients are prone to thrombosis (Eberst & Berkowitz 1994Eberst M.E. & Berkowitz L.R. 1994. Hemostasis in renal disease: pathophysiology and management. Am. J. Med. 96(2):168-179. <http://dx.doi.org/10.1016/0002-9343(94)90138-4> <PMid:8109602>
https://doi.org/10.1016/0002-9343(94)901...
, Lutz et al. 2014Lutz J., Menke J., Sollinger D., Schinzel H. & Thürmel K. 2014. Haemostasis in chronic kidney disease. Nephrol. Dial. Transplant. 29(1):29-40. <http://dx.doi.org/10.1093/ndt/gft209> <PMid:24132242>
https://doi.org/10.1093/ndt/gft209...
). Increased bleeding might be mainly caused by platelet dysfunction, even as additional contributions from changes in the coagulation cascade, nitric oxide, and fibrinolysis, and also anemia (Mischke & Schulze 2004Mischke R. & Schulze U. 2004. Studies on platelet aggregation using the born method in normal and uraemic dogs. Vet. J. 168(3):270-275. <http://dx.doi.org/10.1016/j.tvjl.2004.02.009> <PMid:15501144>
https://doi.org/10.1016/j.tvjl.2004.02.0...
, Sohal et al. 2006Sohal A.S., Gangji A.S., Crowther M.A. & Treleaven D. 2006. Uremic bleeding: pathophysiology and clinical risk factors. Thromb. Res. 118(3):417-422. <http://dx.doi.org/10.1016/j.thromres.2005.03.032> <PMid:15993929>
https://doi.org/10.1016/j.thromres.2005....
, Marques et al. 2010Marques M., Sacristán D., Mateos-Cáceres P.J., Herrero J., Arribas M.J., González-Armengol J.J., Villegas A., Macaya C., Barrientos A. & López-Farré A.J. 2010. Different protein expression in normal and dysfunctional platelets from uremic patients. J. Nephrol. 23(1):90-101. <PMid:20091492>). However, the mechanisms favoring the prothrombotic state are unclear.
Few studies have been evaluated blood viscoelastic properties and hypercoagulability in dogs with kidney disease (Falco et al. 2013Falco S., Zanatta R., Bruno B., Maurella C., Scalone A., Tarducci A. & Borrelli A. 2013. Thromboelastometry used for evaluation of blood coagulability in dogs with kidney diseases. Acta Vet. Brno 82(2):209-214. <http://dx.doi.org/10.2754/avb201382020209>
https://doi.org/10.2754/avb201382020209...
, Lennon et al. 2013Lennon M., Hanel R.M., Walker J.M. & Vaden S.L. 2013. Hypercoagulability in dogs with protein-losing nephropathy as assessed by thromboelastography. J. Vet. Intern. Med. 27(3):462-468. <http://dx.doi.org/10.1111/jvim.12067> <PMid:23528002>
https://doi.org/10.1111/jvim.12067...
). Platelet function (Gonçalves 2016Gonçalves D.S. 2016. Avaliação das alterações hemorrágicas e tromboembólicas em cães com doença renal crônica. Dissertação de Mestrado, Universidade Estadual Paulista, Botucatu. 48p., Dudley et al. 2017Dudley A., Byron J.K., Burkhard M.J., Warry E. & Guillaumin J. 2017. Comparison of platelet function and viscoelastic test results between healthy dogs and dogs with naturally occurring chronic kidney disease. Am. J. Vet. Res. 78(5):589-600. <http://dx.doi.org/10.2460/ajvr.78.5.589> <PMid:28441050>
https://doi.org/10.2460/ajvr.78.5.589...
) and its participation in hypercoagulability have not yet been fully understood. In addition, there are no reports on thrombin generation potential associated with dogs with CKD. However, in humans, changes in thrombin generation in CKD patients were not observed (Trappenburg et al. 2012Trappenburg M.C., van Schilfgaarde M., Frerichs F.C.P., Spronk H.M.H., ten Cate H., de Fijter C.W.H., Terpstra W.E. & Leyte A. 2012. Chronic renal failure is accompanied by endothelial activation and a large increase in microparticle numbers with reduced procoagulant capacity. Nephrol. Dial. Transplant. 227(4):1446-1453. <http://dx.doi.org/10.1093/ndt/gfr474> <PMid:21873622>
https://doi.org/10.1093/ndt/gfr474...
).
The Thrombin Generation Test (TGT) consists of continuous assessment of plasma thrombin generation after the addition of activators, such as tissue factor (TF) (Hemker et al. 2003Hemker H.C., Giesen P., Al Dieri R., Regnault V., De Smedt E., Wagenvoord R., Lecompte T. & Béguin S. 2003. Calibrated automated thrombin generation measurement in clotting plasma. Pathophysiol. Haemost. Thromb. 33(1):4-15. <http://dx.doi.org/10.1159/000071636> <PMid:12853707>
https://doi.org/10.1159/000071636...
). TGT can measure the potential of a total thrombin generation and have advantage over conventional coagulometric methods. Conventional tests, such as Prothrombin Time (PT) and activated Partial Thromboplastin Time (aPTT), are not capable of detecting hemostatic changes; therefore, they cannot determine the thrombin potential. It is also known that only 5% of the thrombin which is generated can contribute to convert fibrinogen into fibrin, thus leading to the final stages of the PT and APTT reactions (Lecut et al. 2015Lecut C., Peters P., Massion P.B. & Gothot A. 2015. Is there a place for thrombin generation assay in routine clinical laboratory® Ann. Biol. Clin., Paris 72(2):137-149. <http://dx.doi.org/10.1684/abc.2014.1018> <PMid:25847735>
https://doi.org/10.1684/abc.2014.1018...
). Due to this property, thrombin levels are underestimated by these screening tests. Thrombin has been widely studied, and a new model for cell surface-based coagulation cascade has been proposed, in which thrombin is the primary regulator (Smith 2009Smith S.A. 2009. The cell-based model of coagulation. J. Vet. Emerg. Crit. Care 19(1):3-10. <http://dx.doi.org/10.1111/j.1476-4431.2009.00389.x> <PMid:19691581>
https://doi.org/10.1111/j.1476-4431.2009...
).
TEM is a viscoelastic hemostatic assay widely used in clinical settings and being closer to in vivo coagulation characteristics when compared with conventional coagulation tests. It consists of measurement and recording of entire coagulation process, from the beginning of platelet-fibrin interaction, platelet aggregation, and clot formation, to its eventual lysis, being able to detect blood hypocoagulability with hemorrhagic risk and hypercoagulability with thrombotic risk (Kol & Borjesson 2010Kol A. & Borjesson L. 2010. Application of thrombelastography/thromboelastometry to veterinary medicine. Vet. Clin. Pathol. 39(4):405-416. <http://dx.doi.org/10.1111/j.1939-165X.2010.00263.x> <PMid:20969608>
https://doi.org/10.1111/j.1939-165X.2010...
). The state of hypercoagulability has already been characterized in dogs by shortening clotting time (CT), increasing maximum clot firmness (MCF) and alpha angle (α angle) (Hanel et al. 2014Hanel R.M., Chan D.L., Conner B., Gauthier V., Holowaychuk M., Istvan S., Walker J.M., Wood D., Goggs R. & Wiinberg B. 2014. Systematic evaluation of evidence on veterinary viscoelastic testing Part 4: Definitions and data reporting. J. Vet. Emerg. Crit. Care 24(1):47-56. <http://dx.doi.org/10.1111/vec.12145> <PMid:24472100>
https://doi.org/10.1111/vec.12145...
).
Clinical studies are needed to better characterize the hemostatic profile in dogs with CKD, given to the prevalence of CKD from 0.37% to 3.74% in diverse dog populations (Polzin, 2011Polzin D.J. 2011. Chronic kidney disease in small animals. Vet. Clin. N. Am. Small Anim. Pract. 41(1):15-30. <http://dx.doi.org/10.1016/j.cvsm.2010.09.004> <PMid:21251509>
https://doi.org/10.1016/j.cvsm.2010.09.0...
, O’Neill et al. 2013O’Neill D.G., Elliott J., Church D.B., McGreevy P.D., Thomson P.C. & Brodbelt D.C. 2013. Chronic kidney disease in dogs in UK veterinary practices: prevalence, risk factors, and survival. J. Vet. Intern. Med. 27(4):814-821. <http://dx.doi.org/10.1111/jvim.12090> <PMid:23647231>
https://doi.org/10.1111/jvim.12090...
). In addition to complications such as anemia, secondary hyperparathyroidism, uremic gastritis, and hypertension (Polzin 2011Polzin D.J. 2011. Chronic kidney disease in small animals. Vet. Clin. N. Am. Small Anim. Pract. 41(1):15-30. <http://dx.doi.org/10.1016/j.cvsm.2010.09.004> <PMid:21251509>
https://doi.org/10.1016/j.cvsm.2010.09.0...
), CKD may be accompanied by hemostatic changes, which undoubtedly aggravates the disease.
Due to the gap in the hemostatic profile in dogs with CKD, the present study aimed to investigate hemostatic changes in these dogs with proteinuria in CKD, employing tests that allow the global evaluation of hemostasis, in order to establish a similar hemostatic profile, using both methodologies.
Materials and Methods
Experimental design. A cross-sectional observational study was performed on dogs treated at Faculdade de Medicina Veterinária e Zootecnia (FMVZ) Universidade Estadual Paulista (Unesp) in Veterinary Hospital routine from March 2014 to February 2016, after being approved by the Animal Use Ethics Committee (protocol 33/2014).
Animals. 19 dogs with CKD in stages III and IV were selected, and classified according to IRIS (2018)IRIS 2018. Staging of Chronic Kidney Disease. Available at <Available at http://www.iris-kidney.com/pdf/IRIS_2017_Staging_of_CKD_09May18.pdf
> Access on May 1, 2018.
http://www.iris-kidney.com/pdf/IRIS_2017...
. Inclusion criteria were renal azotemia (serum creatinine>2mg/dL), urinary protein/creatinine ratio (PRC) >1.0, and characteristic ultrasound findings (e.g. small and irregular kidneys, loss of corticomedullary renal definition). Excluded criteria from this group were animals with neoplasia, concomitant infectious diseases, congestive heart failure, liver disease, nephrolithiasis, and animals in shock or another disease that would mask and/or influence the results of hemostatic tests. Animals that used erythropoietin or drugs that interfered with the hemostatic process were also excluded from the study.
The animals with CKD were subclassified according to age (up to 5 years and >5 years), sex, proteinuria degree (RPC up to 2.5 and >2.5), anemia degree (hemoglobin up to 8g/dL and >8g/dL) and disease history (up to 30 days and >30 days) for assessing comparative analysis of thrombogram and TEM. The subclassifications were determined according to the distribution of the sample population.
In the same period, 20 healthy dogs from voluntary owners were analyzed. Blood count selected healthy animals, by assessing their biochemical profiles (urea, creatinine, protein and fractions, Alanine Aminotransferase (ALT), Alkaline Phosphatase (ALP), Gamma-glutamyl transferase (GGT) and cholesterol and fractions), urinalysis (including PRC), including those animals with results within the reference limits (Kaneko et al. 2008Kaneko J.J., Harvey J.W. & Bruss M.L. 2008. Blood analyte reference values in small and some laboratory animals, p.81-115. In: Ibid. (Eds), Clinical Biochemistry of Domestic Animals. Elsevier, California., Rizzi et al. 2010Rizzi T.E., Meinkoth J.H. & Clinkenbeard K.D. 2010. Normal hematology of the dog, p.799-810. In: Weiss D.J., Wardrop K.J. (Eds), Schalm’s Veterinary Hematology. Willey-Blackwell, Iowa.), and absence of previous disease.
Sample collection and processing. Blood collection was performed at a single time, preferably by jugular venipuncture using 10mL syringe (20G needle), immediately transferred to tubes with EDTA K31 1 BD®, New Jersey, United States of America. and 3.2% sodium citrate4 (according to manufacturer’s instructions. Urine samples were collected by catheterization or cystocentesis and immediately analyzed. The blood count was performed in a blood counter2 2 Sysmex®, Poch - 100iV, Miami, United States of America. immediately after collection. Plasma samples were centrifuged at 1700g for 10 minutes and then kept at -80°C until the time of analysis.
Thrombin generation. The thrombogram was performed on a fluorimeter3
3
Fluoroskan Ascent Analyser, Thermo Scientific, Shangai, China.
by Calibrated Automated Thrombogram (CAT) method developed by Hemker et al. (2003)Hemker H.C., Giesen P., Al Dieri R., Regnault V., De Smedt E., Wagenvoord R., Lecompte T. & Béguin S. 2003. Calibrated automated thrombin generation measurement in clotting plasma. Pathophysiol. Haemost. Thromb. 33(1):4-15. <http://dx.doi.org/10.1159/000071636> <PMid:12853707>
https://doi.org/10.1159/000071636...
using standard reagents4
4
Diagnostica Stago, Assiernes, France.
, and according to the manufacturer’s instructions. In short, 80μL of each sample was placed into the wells of a 96-well microplate, and then 20μL of the coagulation activation triggering reagent (PPP-Low or PPP-High Tissue Factor) was added. For each plasma tested, a well containing the same plasma volume was made, but replacing the coagulation triggering agent with 20μL of the thrombin bound (Thrombin calibrator-α2 macroglobulin). Thus, the microplate was incubated for 10 minutes at 37°C, and then 20μL of the trigger agent with calcium chloride and the fluorogenic agent (FluCa® kit) were automatically dispensed into each well by the fluorimeter. Thrombin generation was evaluated using the wavelengths of 390nm and 460nm to detect fluorescence for one hour. Data were collected from Thrombinoscopee BV software5
5
Thrombinoscope BV®, Maastricht, Netherlands.
and included lagtime (corresponding to CT), peak (maximum thrombin concentration), time to peak (representing time to maximum thrombin generated), and Endogenous Thrombin Potential (ETP) which represents the amount of thrombin formed within 60 minutes.
Thromboelastometry. Three channels were used simultaneously to perform TEM. 300μL of recalcified citrated whole blood were used and 20μL of 0.2 mol/L calcium chloride (startem8), and coagulation activation was performed separately in each channel using extem reagent8 (20μL, tissue thromboplastin). The following variables were evaluated on the ROTEM Delta6 6 Pentapham, Munique, Germany. apparatus maintained at 37°C for two hours: CT: latency until initial fibrin formation; α angle: fibrin accumulation and cross-linking velocity (fibrinogen level); and MCF: measure of peak clot strength/resistance.
Statistical analysis. The sample size calculation7 7 Statstodo Trading Pty Ltd., Hong Kong, China. (n) was performed considering a statistical power of 80%. The Shapiro-Wilk test was used to assess the normality of the data. For comparison between groups, the Mann-Whitney U test was applied. Kruskal-Wallis test was used to compare the median between groups and Dunn’s test was used to adjust the p values resulting from multiple comparisons. Results were expressed as median, second, and third quartiles. Analyzes were performed with GraphPad Prism version 5.01 at the 5% significance level.
Results
Nineteen dogs diagnosed with proteinuria in CKD were analyzed in this study, eleven females and eight males. The average age was eight years (8±3 years). The average weight of the dogs was 20 (±11.7) kg. The evaluated races were: Dalmatian (1), Weimaraner (1), Yorkshire (1), Rottweiler (1), German Shepherd (1), Boxer (1), and mixed breed (13).
The healthy group consisted of 20 dogs, ten females and ten males, with an average age of five years (5 ± 2.5 years). The breeds evaluated were: Border Collie (1), Dachshund (1), Fox Terrier (1), Labrador (6), Lhasa Apso (1), Pitbull (4), Poodle (1), Redhiller (1), Shitzu (1), Yorkshire (1) and mixed breed (2). According to the results of this group, reference values were obtained for TGT and TEM, assuming a confidence interval of 95%.
The proteinuria in CKD group in healthy animals presented anemia (median [2nd and 3rd quartiles] Ht: 27% [22-30] P<0.001, Hb: 8.4g/dL [7.2-9.6] P<0.001), between normocytic (MCV: 70fL [68-73], P=0.17), normochromic anemia (CHCM: 33 32-33], P<0.001) and platelets (276x103 [205-358] within reference values (Rizzi et al. 2010Rizzi T.E., Meinkoth J.H. & Clinkenbeard K.D. 2010. Normal hematology of the dog, p.799-810. In: Weiss D.J., Wardrop K.J. (Eds), Schalm’s Veterinary Hematology. Willey-Blackwell, Iowa.) (P=0.80). The CKD group had a higher leukocyte count (11x103/μL, P<0.05) compared to the healthy group, but both groups were within reference limits (Rizzi et al. 2010Rizzi T.E., Meinkoth J.H. & Clinkenbeard K.D. 2010. Normal hematology of the dog, p.799-810. In: Weiss D.J., Wardrop K.J. (Eds), Schalm’s Veterinary Hematology. Willey-Blackwell, Iowa.). Eleven (11/19) dogs were classified in stage III CKD and 8/19 in stage IV CKD, according to IRIS (2018)IRIS 2018. Staging of Chronic Kidney Disease. Available at <Available at http://www.iris-kidney.com/pdf/IRIS_2017_Staging_of_CKD_09May18.pdf
> Access on May 1, 2018.
http://www.iris-kidney.com/pdf/IRIS_2017...
guidelines. Albumin levels were significantly reduced in the CKD group (2.3g/dL, P<0.001) compared to the healthy group. PRC ranged from 1.4 to 12.4 in the proteinuria in CKD group, with 16/19 animals presenting PCU>1.6. The results obtained by thrombin generation analysis are shown in Figure 1-4 and Table 1. In TEM (Fig.5-8, Table 2), animals up to 20kg presented increased values of MCF and α angle. The other subclassifications did not present statistically significant differences.

Thrombin Generation Test (TGT) of healthy dogs with proteinuria in CKD in stages III and IV. ETP = Endogenous Thrombin Potential.
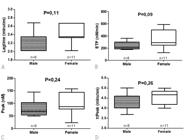
Thrombin Generation Test (TGT) of dogs with proteinuria in CKD, classified by sex. ETP = Endogenous Thrombin Potential.

Thrombin Generation Test (TGT) of dogs with proteinuria in CKD, classified according to the degree of proteinuria. ETP = Endogenous Thrombin Potential, UCPR: Urine Protein:Creatinine Ratio.

Thrombin Generation Test (TGT) of dogs with proteinuria in CKD, the dogs were classified according to the degree of anemia. ETP = Endogenous Thrombin Potential.

Thromboelastometry (TEM) of healthy dogs with proteinuria in CKD in stages III and IV. EXTEM® = tissue factor activation, CT = Coagulation Time, MCF = Maximum Clot Firmness.

Thromboelastometry (TEM) of dogs with proteinuria in CKD, the dogs were classified by gender. EXTEM® = tissue factor activation, CT = Coagulation Time, MCF = Maximum Clot Firmness.

Thromboelastometry (TEM) of dogs with proteinuria in CKD, the dogs were classified according to the degree of proteinuria EXTEM® = tissue factor activation, CT = Coagulation Time, MCF = Maximum Clot Firmness., UCPR: Urine Protein:Creatinine Ratio.

Thromboelastometry (TEM) of dogs with proteinuria in CKD, the dogs were classified according to the degree of anemia. EXTEM® = tissue factor activation, CT = Coagulation Time, MCF = Maximum Clot Firmness; Hb = hemoglobin.
Discussion
This study aimed to understand hemostatic changes in dogs with CKD in stages III and IV by using two global assessment tests for hemostasis, including TGT and TEM. In addition, there are no reports of thrombin generation potential in dogs with CKD.
Considering all TGT parameters, endogenous thrombin potential (ETP) seems to be the most widely used, with the best correlation to the clinical phenotype (Lipets & Ataullakhanov 2015Lipets E.N. & Ataullakhanov F.I. 2015. Global assays of hemostasis in the diagnostics of hypercoagulation and evaluation of thrombosis risk. Thromb. J. 13(1):1-15. <http://dx.doi.org/10.1186/s12959-015-0038-0> <PMid:25635172>
https://doi.org/10.1186/s12959-015-0038-...
). However, according to our results, no TGT parameter performed with low concentration tissue factor (1pM) was able to discriminate between healthy group and dogs with CKD (Table 1). Although not significant, it is important to characterize that dogs with CKD in stage III had higher ETP (P=0.40) and peak (P=0.48) values. The findings of TGT are probably explained by the association of natural anticoagulant reduction factors by proteinuria in CKD, as well as hyperfibrinogenemia in these patients.
However, when several variables stratified sick animals, some findings should be discussed. Thus, females presented a tendency to increase ETP (P=0.09) when compared to males; this may be partly explained by hormonal factors that may contribute to increased thrombin generation. Concerning women who use oral contraceptives, it could be observed among them a potential thrombin generation (Brummel-Ziedins et al. 2005Brummel-Ziedins K.E., Vossen C.Y., Butenas S., Mann K.G. & Rosendaal F.R. 2005. Thrombin generation profiles in deep venous thrombosis. J. Thromb. Haemost. 3(11):2497-2505. <http://dx.doi.org/10.1111/j.1538-7836.2005.01584.x> <PMid:16241948>
https://doi.org/10.1111/j.1538-7836.2005...
), and it can be inferred that different hormones may influence the hemostatic profile.
Patients presenting severe anemia (hemoglobin <8g/dL) had higher ETP than the others, despite the P=0.49 value. In humans, ETP increases hematocrit levels due to higher exposure of membrane phospholipids (Horne et al. 2006Horne 3rd M.K., Cullinane A.M., Merryman P.K. & Hoddeson E.K. 2006. The effect of red blood cells on thrombin generation. Brit. J. Haematol. 133(4):403-408. <http://dx.doi.org/10.1111/j.1365-2141.2006.06047.x> <PMid:16643448>
https://doi.org/10.1111/j.1365-2141.2006...
). In fact, the increase in ETP observed in this study can be understood by the higher platelet exposure. Normocytic and normochromic anemia in CKD are proportional to the degree of erythropoietin deficiency, while the most significant endothelial lesions owing to worsening renal disease occur (Polzin 2011Polzin D.J. 2011. Chronic kidney disease in small animals. Vet. Clin. N. Am. Small Anim. Pract. 41(1):15-30. <http://dx.doi.org/10.1016/j.cvsm.2010.09.004> <PMid:21251509>
https://doi.org/10.1016/j.cvsm.2010.09.0...
). Thus, on such lesions, there would be activation of platelets and hemostatic mechanism, being the main activation surface for thrombin generation (Whelihan & Mann 2013Whelihan M.F. & Mann K.G. 2013. The role of the red cell membrane in thrombin generation. Thromb. Res. 131(5):377-382. <http://dx.doi.org/10.1016/j.thromres.2013.01.023> <PMid:23402970>
https://doi.org/10.1016/j.thromres.2013....
). In addition, decreased competence of the natural anticoagulation system (due to proteinuria), it may be factors favoring a higher generation of thrombin. Blood viscosity is independent of erythrocyte volume (Brooks et al. 2014Brooks A.C., Guillaumin J., Cooper E.S. & Couto C. 2014. Effects of hematocrit and red blood cell-independent viscosity on canine thromboelastographic tracings. Transfusion 54(3):727-734. <http://dx.doi.org/10.1111/trf.12354> <PMid:23901836>
https://doi.org/10.1111/trf.12354...
), and even with the presence of anemia, hypercoagulability was characterized in patients with CKD.
Proteinuria could be present in all patients with CKD, however, animals with more intense protein loss (RPC>2.5) had higher thrombin generation potential (P=0.49) (Table 2). Although there is no significant difference, thisincrease can be explained, at least partially, by the occurrence of significant renal injury, which would facilitate the loss of antithrombin in the urine (Prihirunkit et al. 2011Prihirunkit K., Lekcharoensuk C., Pooripanpipat S. & Tipsawek S. 2011. Alteration of some natural anticoagulants in dogs with chronic renal failure. Comp. Clin. Pathol. 20(3):217-221. <http://dx.doi.org/10.1007/s00580-010-0981-x>
https://doi.org/10.1007/s00580-010-0981-...
). Protein S (PS) is also a natural anticoagulant, and its urinary loss also occurs in CKD. Only 40% of PS is known to perform anticoagulant function (free PS), while the remainder circulates in C4bBP-bound protein (C4b-binding protein), which increases in inflammatory processes such as CKD. The inflammatory process contributes to the reduction of free PS (anticoagulant) and higher formation of the PS-C4bBP complex, contributing more to thrombin generation (Prihirunkit et al. 2011Prihirunkit K., Lekcharoensuk C., Pooripanpipat S. & Tipsawek S. 2011. Alteration of some natural anticoagulants in dogs with chronic renal failure. Comp. Clin. Pathol. 20(3):217-221. <http://dx.doi.org/10.1007/s00580-010-0981-x>
https://doi.org/10.1007/s00580-010-0981-...
), and consequent hypercoagulability state.
According to the time course of disease, it was observed in the present study that dogs with >30 days of diagnosis had lower ttpeak (P=0.05) compared to those with recent diagnoses, this result suggests a faster speed to reach reaction peak rate. This could be related to a slight, though not significant, increase in thrombin generation, justified by the worsening of the disease over time.
Overweight and/or obesity have already been associated as a predictor of thrombotic events in humans (Beijers et al. 2010Beijers H.J.B.H., Ferreira I., Spronk H.M.H., Bravenboer B., Dekker J.M., Nijpels G., ten Cate H. & Stehouwer C.D.A. 2010. Body composition as determinant of thrombin generation in plasma. Arterioscl. Throm. Vasc. Biol. 30(12):2639-2647. <http://dx.doi.org/10.1161/ATVBAHA.110.211946> <PMid:20847307>
https://doi.org/10.1161/ATVBAHA.110.2119...
). Regarding the weight variable, in the present study, the body scores of the animals were not included - a limiting factor for interpretation by this classification. Considering the different breeds included in the study and that SRD dogs have different sizes, we cannot attribute any findings to the variable weight.
When MET results were compared between groups, significant differences could be observed for CT, MCF and α angle parameters (Fig 7); these results indicate better differences between sick and healthy dogs. TEM seems to be more efficient for detecting hemostatic changes than TGT in the studied groups. Assuming that TEM is sensitive to changes in fibrinogen levels and TGT not, it could be assumed that levels of this coagulant protein were probably higher in CKD animals, which is compatible with the pathophysiology of CKD (Polzin 2011Polzin D.J. 2011. Chronic kidney disease in small animals. Vet. Clin. N. Am. Small Anim. Pract. 41(1):15-30. <http://dx.doi.org/10.1016/j.cvsm.2010.09.004> <PMid:21251509>
https://doi.org/10.1016/j.cvsm.2010.09.0...
, O’Neill et al. 2013O’Neill D.G., Elliott J., Church D.B., McGreevy P.D., Thomson P.C. & Brodbelt D.C. 2013. Chronic kidney disease in dogs in UK veterinary practices: prevalence, risk factors, and survival. J. Vet. Intern. Med. 27(4):814-821. <http://dx.doi.org/10.1111/jvim.12090> <PMid:23647231>
https://doi.org/10.1111/jvim.12090...
). Blood figurative elements regarding the process of hemostatic alterations in dogs with CKD, which would contribute to tissue factor exposure enhancing the activation of the coagulation cascade and consequent fibrin formation, cannot be excluded.
When animals with CKD were stratified by age, sex, proteinuria degree, and anemia degree, such variables were not able to influence the hemostatic profile revealed by TEM. This fact may be explained by the limited sample size that was not able to show small differences among subgroups.
Despite the limitations of information in the patients’ clinical files, patients’ history allows us to evaluate how long the CKD patient has been suffering from pathophysiological changes of this disease. According to our TEM data, there was a tendency (P=0.08) to increase α angle as a function of shorter disease duration, as well as in dogs up to 20kg (P=0.02). Although α angle is not specific, it may be signaling increased platelet function, fibrinogen concentration and/or coagulation factors (Kol & Borjesson 2010Kol A. & Borjesson L. 2010. Application of thrombelastography/thromboelastometry to veterinary medicine. Vet. Clin. Pathol. 39(4):405-416. <http://dx.doi.org/10.1111/j.1939-165X.2010.00263.x> <PMid:20969608>
https://doi.org/10.1111/j.1939-165X.2010...
). Furthermore, recent diagnosis of the disease and shorter treatment time could reflect more severe hemostatic changes due to the treatment period and patient compensation.
In fact, TEM was able to detect increased MCF and α angle in dogs with CKD when compared to healthy dogs. Such observation may have significant clinical relevance regarding the antithrombotic therapeutic protocol. However, more robust studies are needed to understand hemostatic changes in dogs with CKD.
A complete analysis of the data revealed that TEM was able to discriminate between healthy and CKD dogs. However, when there was stratification of the sample originated from diseased dogs, the convergence of results was observed regarding the two methods used to evaluate hemostasis. Thus, it should be emphasized that both TGT and TEM showed hemostatic changes, suggesting hypercoagulability up to 30 days of diagnosis as well as in those dogs under 20kg, especially in TEM.
Given the multifactorial context of hemostatic changes in CKD, further clinical studies are needed to understand and determine the predictive values of global hemostatic tests in thrombotic or hemorrhagic risk of CKD. Such knowledge could revert to appropriate prophylactic therapeutic actions in such patients contributing to a siginificant quality of life and more prolonged survival of these patients.
Thromboelastometry may be considered an effective tool for hemostatic evaluation, but its applicability is restricted to intensive care centers and hospitals, due to simplify sample processing time. In contrast, the thrombin generation test allows storage of citrated plasma samples for later analysis, allowing their performance in laboratories. However, one technique does not replace another one: both are important.
Conclusion
Thromboelastometry is more sensitive to detect hypercoagulability in dogs with CKD, however, the thrombin generation test is applicable for allowing long-term sample storage.
References
- Beijers H.J.B.H., Ferreira I., Spronk H.M.H., Bravenboer B., Dekker J.M., Nijpels G., ten Cate H. & Stehouwer C.D.A. 2010. Body composition as determinant of thrombin generation in plasma. Arterioscl. Throm. Vasc. Biol. 30(12):2639-2647. <http://dx.doi.org/10.1161/ATVBAHA.110.211946> <PMid:20847307>
» https://doi.org/10.1161/ATVBAHA.110.211946 - Brooks A.C., Guillaumin J., Cooper E.S. & Couto C. 2014. Effects of hematocrit and red blood cell-independent viscosity on canine thromboelastographic tracings. Transfusion 54(3):727-734. <http://dx.doi.org/10.1111/trf.12354> <PMid:23901836>
» https://doi.org/10.1111/trf.12354 - Brummel-Ziedins K.E., Vossen C.Y., Butenas S., Mann K.G. & Rosendaal F.R. 2005. Thrombin generation profiles in deep venous thrombosis. J. Thromb. Haemost. 3(11):2497-2505. <http://dx.doi.org/10.1111/j.1538-7836.2005.01584.x> <PMid:16241948>
» https://doi.org/10.1111/j.1538-7836.2005.01584.x - Dudley A., Byron J.K., Burkhard M.J., Warry E. & Guillaumin J. 2017. Comparison of platelet function and viscoelastic test results between healthy dogs and dogs with naturally occurring chronic kidney disease. Am. J. Vet. Res. 78(5):589-600. <http://dx.doi.org/10.2460/ajvr.78.5.589> <PMid:28441050>
» https://doi.org/10.2460/ajvr.78.5.589 - Eberst M.E. & Berkowitz L.R. 1994. Hemostasis in renal disease: pathophysiology and management. Am. J. Med. 96(2):168-179. <http://dx.doi.org/10.1016/0002-9343(94)90138-4> <PMid:8109602>
» https://doi.org/10.1016/0002-9343(94)90138-4 - Falco S., Zanatta R., Bruno B., Maurella C., Scalone A., Tarducci A. & Borrelli A. 2013. Thromboelastometry used for evaluation of blood coagulability in dogs with kidney diseases. Acta Vet. Brno 82(2):209-214. <http://dx.doi.org/10.2754/avb201382020209>
» https://doi.org/10.2754/avb201382020209 - Gonçalves D.S. 2016. Avaliação das alterações hemorrágicas e tromboembólicas em cães com doença renal crônica. Dissertação de Mestrado, Universidade Estadual Paulista, Botucatu. 48p.
- Hanel R.M., Chan D.L., Conner B., Gauthier V., Holowaychuk M., Istvan S., Walker J.M., Wood D., Goggs R. & Wiinberg B. 2014. Systematic evaluation of evidence on veterinary viscoelastic testing Part 4: Definitions and data reporting. J. Vet. Emerg. Crit. Care 24(1):47-56. <http://dx.doi.org/10.1111/vec.12145> <PMid:24472100>
» https://doi.org/10.1111/vec.12145 - Hemker H.C., Giesen P., Al Dieri R., Regnault V., De Smedt E., Wagenvoord R., Lecompte T. & Béguin S. 2003. Calibrated automated thrombin generation measurement in clotting plasma. Pathophysiol. Haemost. Thromb. 33(1):4-15. <http://dx.doi.org/10.1159/000071636> <PMid:12853707>
» https://doi.org/10.1159/000071636 - Horne 3rd M.K., Cullinane A.M., Merryman P.K. & Hoddeson E.K. 2006. The effect of red blood cells on thrombin generation. Brit. J. Haematol. 133(4):403-408. <http://dx.doi.org/10.1111/j.1365-2141.2006.06047.x> <PMid:16643448>
» https://doi.org/10.1111/j.1365-2141.2006.06047.x - IRIS 2018. Staging of Chronic Kidney Disease. Available at <Available at http://www.iris-kidney.com/pdf/IRIS_2017_Staging_of_CKD_09May18.pdf > Access on May 1, 2018.
» http://www.iris-kidney.com/pdf/IRIS_2017_Staging_of_CKD_09May18.pdf - Kaneko J.J., Harvey J.W. & Bruss M.L. 2008. Blood analyte reference values in small and some laboratory animals, p.81-115. In: Ibid. (Eds), Clinical Biochemistry of Domestic Animals. Elsevier, California.
- Kol A. & Borjesson L. 2010. Application of thrombelastography/thromboelastometry to veterinary medicine. Vet. Clin. Pathol. 39(4):405-416. <http://dx.doi.org/10.1111/j.1939-165X.2010.00263.x> <PMid:20969608>
» https://doi.org/10.1111/j.1939-165X.2010.00263.x - Lecut C., Peters P., Massion P.B. & Gothot A. 2015. Is there a place for thrombin generation assay in routine clinical laboratory® Ann. Biol. Clin., Paris 72(2):137-149. <http://dx.doi.org/10.1684/abc.2014.1018> <PMid:25847735>
» https://doi.org/10.1684/abc.2014.1018 - Lennon M., Hanel R.M., Walker J.M. & Vaden S.L. 2013. Hypercoagulability in dogs with protein-losing nephropathy as assessed by thromboelastography. J. Vet. Intern. Med. 27(3):462-468. <http://dx.doi.org/10.1111/jvim.12067> <PMid:23528002>
» https://doi.org/10.1111/jvim.12067 - Lipets E.N. & Ataullakhanov F.I. 2015. Global assays of hemostasis in the diagnostics of hypercoagulation and evaluation of thrombosis risk. Thromb. J. 13(1):1-15. <http://dx.doi.org/10.1186/s12959-015-0038-0> <PMid:25635172>
» https://doi.org/10.1186/s12959-015-0038-0 - Lutz J., Menke J., Sollinger D., Schinzel H. & Thürmel K. 2014. Haemostasis in chronic kidney disease. Nephrol. Dial. Transplant. 29(1):29-40. <http://dx.doi.org/10.1093/ndt/gft209> <PMid:24132242>
» https://doi.org/10.1093/ndt/gft209 - Marques M., Sacristán D., Mateos-Cáceres P.J., Herrero J., Arribas M.J., González-Armengol J.J., Villegas A., Macaya C., Barrientos A. & López-Farré A.J. 2010. Different protein expression in normal and dysfunctional platelets from uremic patients. J. Nephrol. 23(1):90-101. <PMid:20091492>
- Mischke R. & Schulze U. 2004. Studies on platelet aggregation using the born method in normal and uraemic dogs. Vet. J. 168(3):270-275. <http://dx.doi.org/10.1016/j.tvjl.2004.02.009> <PMid:15501144>
» https://doi.org/10.1016/j.tvjl.2004.02.009 - O’Neill D.G., Elliott J., Church D.B., McGreevy P.D., Thomson P.C. & Brodbelt D.C. 2013. Chronic kidney disease in dogs in UK veterinary practices: prevalence, risk factors, and survival. J. Vet. Intern. Med. 27(4):814-821. <http://dx.doi.org/10.1111/jvim.12090> <PMid:23647231>
» https://doi.org/10.1111/jvim.12090 - Polzin D.J. 2011. Chronic kidney disease in small animals. Vet. Clin. N. Am. Small Anim. Pract. 41(1):15-30. <http://dx.doi.org/10.1016/j.cvsm.2010.09.004> <PMid:21251509>
» https://doi.org/10.1016/j.cvsm.2010.09.004 - Prihirunkit K., Lekcharoensuk C., Pooripanpipat S. & Tipsawek S. 2011. Alteration of some natural anticoagulants in dogs with chronic renal failure. Comp. Clin. Pathol. 20(3):217-221. <http://dx.doi.org/10.1007/s00580-010-0981-x>
» https://doi.org/10.1007/s00580-010-0981-x - Rizzi T.E., Meinkoth J.H. & Clinkenbeard K.D. 2010. Normal hematology of the dog, p.799-810. In: Weiss D.J., Wardrop K.J. (Eds), Schalm’s Veterinary Hematology. Willey-Blackwell, Iowa.
- Smith S.A. 2009. The cell-based model of coagulation. J. Vet. Emerg. Crit. Care 19(1):3-10. <http://dx.doi.org/10.1111/j.1476-4431.2009.00389.x> <PMid:19691581>
» https://doi.org/10.1111/j.1476-4431.2009.00389.x - Sohal A.S., Gangji A.S., Crowther M.A. & Treleaven D. 2006. Uremic bleeding: pathophysiology and clinical risk factors. Thromb. Res. 118(3):417-422. <http://dx.doi.org/10.1016/j.thromres.2005.03.032> <PMid:15993929>
» https://doi.org/10.1016/j.thromres.2005.03.032 - Trappenburg M.C., van Schilfgaarde M., Frerichs F.C.P., Spronk H.M.H., ten Cate H., de Fijter C.W.H., Terpstra W.E. & Leyte A. 2012. Chronic renal failure is accompanied by endothelial activation and a large increase in microparticle numbers with reduced procoagulant capacity. Nephrol. Dial. Transplant. 227(4):1446-1453. <http://dx.doi.org/10.1093/ndt/gfr474> <PMid:21873622>
» https://doi.org/10.1093/ndt/gfr474 - Whelihan M.F. & Mann K.G. 2013. The role of the red cell membrane in thrombin generation. Thromb. Res. 131(5):377-382. <http://dx.doi.org/10.1016/j.thromres.2013.01.023> <PMid:23402970>
» https://doi.org/10.1016/j.thromres.2013.01.023
-
1
BD®, New Jersey, United States of America.
-
2
Sysmex®, Poch - 100iV, Miami, United States of America.
-
3
Fluoroskan Ascent Analyser, Thermo Scientific, Shangai, China.
-
4
Diagnostica Stago, Assiernes, France.
-
5
Thrombinoscope BV®, Maastricht, Netherlands.
-
6
Pentapham, Munique, Germany.
-
7
Statstodo Trading Pty Ltd., Hong Kong, China.
Publication Dates
-
Publication in this collection
09 Apr 2020 -
Date of issue
Feb 2020
History
-
Received
03 Aug 2019 -
Accepted
05 Sept 2019


