Abstract
The chemical profiles of four ginseng roots samples from three species of ginseng (Panax quinquefolius, Panax ginseng and Panax notoginseng) and two commercial ginseng products containing P. quinquefolius and red P. ginseng were compared using ultra-performance liquid chromatography coupled with quadrupole time of flight mass spectrometry (UPLC/QTOF-MS). Principal component analysis allowed a holistic approach in showing distinct chemical differences between the three ginseng species and correct classification of the two commercial products to their respective species. Further investigation of the chemical profile variations yielded ten main markers that were distinct for the three species. This study shows the potential of chemical profiling for the classification of complex natural product samples, such as ginseng, and application to commercial products sold in the market. This methodology can assist the industry in authenticating the various species of ginseng and providing a quick assessment of the quality of commercial ginseng products.
Keywords:
metabolic profiling; natural product; mass spectrometry; authentication; LC-MS
Introduction
Ginseng (Panax species, Araliaceae family) has been well-used and studied in traditional Chinese medicine and has been widely adapted in North America as a herbal supplement with high growth in sales every year.11 Sengupta, S.; Toh, S.-A.; Sellers, L. A.; Skepper, J. N.; Koolwijk, P.; Leung, H. W.; Yeung, H.-W.; Wong, R. N. S.; Sasisekharan, R.; Fan, T.-P. D.; Circulation 2004, 110, 1219. Ginseng has been known for its therapeutic effects on the endocrine, cardiovascular, immune, central nervous system and also reported to possess anti-cancer properties.22 Kang, J.; Lee, S.; Kang, S.; Kwon, H.; Park, J.; Kwon, S.; Park, S.; Arch. Pharmacal Res. 2008, 31, 330.,33 Nag, S. A.; Qin, J.-J.; Wang, W.; Wang, M.-H.; Wang, H.; Zhang, R.; Front. Pharmacol. 2012, 3, 25.Panax ginseng C. A. Meyer (Asian or Korean ginseng), Panax quinquefolius L. (American ginseng) and Panax notoginseng (Burk) F. H. Chen (Tienchi or Sanchi, notoginseng) are the most commonly used and studied ginseng herbs.11 Sengupta, S.; Toh, S.-A.; Sellers, L. A.; Skepper, J. N.; Koolwijk, P.; Leung, H. W.; Yeung, H.-W.; Wong, R. N. S.; Sasisekharan, R.; Fan, T.-P. D.; Circulation 2004, 110, 1219. Due to the continual increases in sales, there has been an increase in concern of adulteration of herbal products sold in the market.44 Smolinske, S. C.; J. Pharm. Pract. 2005, 18, 188. Practices including misidentification of herbal species and the addition of unlabeled pharmaceuticals55 Phua, D. H.; Zosel, A.; Heard, K.; Int. J. Emerg. Med. 2009, 2, 69. can cause harm to the consumer and potential mistrust in the herbal and traditional medicine industry. Specifically for ginseng, intentional substitution of the wrong species in ginseng products in the market is a known issue.66 Wang, C.-Z.; Ni, M.; Sun, S. H. I.; Li, X.-L.; He, H. U. I.; Mehendale, S. R.; Yuan, C.-S.; J. Agric. Food Chem. 2009, 57, 2363. To address this growing concern, many analytical methods have been developed to authenticate and classify the various species of ginseng.
Morphological examinations77 Hon, C. C.; Chow, Y. C.; Zeng, F. Y.; Leung, F. C. C.; Acta Pharmacol. Sin.
2003, 24, 841. to genetic testing88 Bai, D. P.; Brandle, J.; Reeleder, R.; Genome
1997, 40, 111. has been commonly used to authenticate different species of ginseng. However, certain products in the market can be packaged ground into powder or prepared differently (extracts) which can decrease the effectiveness of these methods. Chemical methods using analytical instrumentation such as high-performance liquid chromatography (HPLC) with diode array,99 Brown, P. N.; J. AOAC Int.
2011, 94, 1391.
10 McIntyre, K.; Luu, A.; Sun, C.; Brown, D.; Lui, E. M. K.; Arnason, J. In The Biological Activity of Phytochemicals, vol. 41; Gang, D. R., ed.; Springer: New York, 2011, p. 97.-1111 Kim, I.-W.; Cha, K.-M.; Wee, J. J.; Ye, M. B.; Kim, S.-K.; J. Ginseng Res.
2013, 37, 475. nuclear magnetic resonance (NMR) spectroscopy,22 Kang, J.; Lee, S.; Kang, S.; Kwon, H.; Park, J.; Kwon, S.; Park, S.; Arch. Pharmacal Res.
2008, 31, 330.,1212 Kang, J.; Choi, M.-Y.; Kang, S.; Kwon, H. N.; Wen, H.; Lee, C. H.; Park, M.; Wiklund, S.; Kim, H. J.; Kwon, S. W.; Park, S.; J. Agric. Food Chem.
2008, 56, 11589.,1313 Yuk, J.; McIntyre, K.; Fischer, C.; Hicks, J.; Colson, K.; Lui, E.; Brown, D.; Arnason, J.; Anal. Bioanal. Chem.
2013, 405, 4499. and liquid chromatography-mass spectrometry (LC-MS)1414 Chan, T. W. D.; But, P. P. H.; Cheng, S. W.; Kwok, I. M. Y.; Lau, F. W.; Xu, H. X.; Anal. Chem.
2000, 72, 1281. have also been used to profile ginseng species. Many of these studies have focused on identifying key chemical components in the various ginseng species for authentication. However, spiking in specific markers to represent a natural product in commercial products could be done and can mislead regulators.1515 Smillie, T. J.; Khan, I. A.; Clin. Pharmacol. Ther.
2010, 87, 175. A newer approach has been the development of untargeted methods to compare whole chemical profiles through the sample's spectrum or chromatogram using authenticated references.1616 Xian-Ke, Z.; Di-Cai, L.; Jian-Guo, J.; Curr. Med. Chem.
2009, 16, 3064. This chemical profiling methodology offers many benefits as a targeted list of key compounds typically found in the natural product are not needed for authentication. Instead, the data analysis using chemometrics takes into consideration the complete chemical signature for comparison. This makes adulterations much more difficult as the assessment for quality is based on the entire chemical constituents of the natural product rather than just a set list of markers. Chemical profiling allows researchers to have a holistic comparison of the samples (authentic vs. commercial) and through multivariate modeling, detect specific chemical signals to focus on which could be indicative of adulteration (i.e., spiking, species substitution, etc.) or quality controls concerns (i.e., growth conditions, environment contaminants, sample preparation, etc.). Chemical profiling is a growing trend and is becoming a popular method for the quality control and standardization of traditional Chinese herbs.1717 Fu, P. P.; Chiang, H.-M.; Xia, Q.; Chen, T. A. O.; Chen, B. H.; Yin, J.-J.; Wen, K.-C.; Lin, G. E.; Yu, H.; J. Environ. Sci. Health, Part C: Environ. Carcinog. Ecotoxicol. Rev.
2009, 27, 91. One important requirement for untargeted methods is obtaining a well-known source for the authenticated natural products (i.e., arboretum, botanical garden, etc.) which will allow an appropriate reference for comparison. For ginseng, chemical profiling studies have been investigated for various types of species,66 Wang, C.-Z.; Ni, M.; Sun, S. H. I.; Li, X.-L.; He, H. U. I.; Mehendale, S. R.; Yuan, C.-S.; J. Agric. Food Chem.
2009, 57, 2363.,1818 Lee, E.-J.; Shaykhutdinov, R.; Weljie, A. M.; Vogel, H. J.; Facchini, P. J.; Park, S.-U.; Kim, Y.-K.; Yang, T.-J.; J. Agric. Food Chem.
2009, 57, 7513. farms,1313 Yuk, J.; McIntyre, K.; Fischer, C.; Hicks, J.; Colson, K.; Lui, E.; Brown, D.; Arnason, J.; Anal. Bioanal. Chem.
2013, 405, 4499. cultivation ages1919 Yang, S. O.; Shin, Y. S.; Hyun, S. H.; Cho, S.; Bang, K. H.; Lee, D.; Choi, S. P.; Choi, H. K.; J. Pharm. Biomed. Anal.
2012, 58, 19. including effects of processing conditions.2020 Zhang, H.-M.; Li, S.-L.; Zhang, H.; Wang, Y.; Zhao, Z.-L.; Chen, S.-L.; Xu, H.-X.; J. Pharm. Biomed. Anal.
2012, 62, 258. Each of these studies utilize an analytical platform (HPLC, LC-MS or NMR) but require multiple informatics platforms to acquire, process, and analyze the data. These approaches of data analysis and results interpretation using multiple software packages is extremely laborious, time consuming and can be harder to replicate in other laboratories.
In this study, four types of ginseng (P. quinquefolius, P. notoginseng, P. ginseng and red P. ginseng) and two commercial ginseng products were analyzed and profiled using ultra-performance liquid chromatography (UPLC) coupled with a quadrupole time-of-flight (QTOF)-MS. UPLC is becoming a common analytical platform for chemical profiling as the higher pressure (12,000-15,000 psi compared to ca. 6,000 psi for HPLC) and smaller particle size (ca. sub 2 µm) provides a much more rapid and efficient separation for complex natural product mixtures.2121 Lei, Z.; Huhman, D. V.; Sumner, L. W.; J. Biol. Chem. 2011, 286, 25435. A chemical profiling study by Nordstorm et al.2222 Nordström, A.; O'Maille, G.; Qin, C.; Siuzdak, G.; Anal. Chem. 2006, 78, 3289. compared a UPLC/QTOF-MS study with HPLC-MS and found a 20% increase in chemical components for a complex biological mixture. A single informatics platform called UNIFI was used for data acquisition, process and analysis (chemometrics and identification of markers). UNIFI has been recently used for the chemical profiling of Tinospora crispa for α-glucosidase and α-amylase inhibitory constituents2323 Hamid, H. A.; Yusoff, M. M.; Liu, M.; Karim, M. R.; J. Funct. Foods 2015, 16, 74. and for the discrimination of two species of Cynananchum.2424 Lee, J.; Ji, S.; Lee, M.; Kim, G.; Ahn, Y.; Metabolomics 2015, 5. The purpose of this work is to expand the chemical profiling approach utilizing modern analytical instrumentation such as ultra-performance liquid chromatography quadrupole time of flight mass spectrometry (UPLC/QTOF-MS) and to evaluate its applicability for natural product authentication such as ginseng.
Experimental
Ginseng samples and reagents
Four authentic ginseng roots (P. quinquefolius, P. ginseng, red P. ginseng and P. notoginseng) were obtained from the American Herbal Pharmacopoeia. Each sample had a certificate of authenticity to confirm their identity: P. quinquefolius (certificate No. 1762), P. ginseng (certificate No. 1764), red P. ginseng (certificate No. 1710) and P. notoginseng (certificate No. 1763). Two commercial ginseng products were purchased from a local nutritional store (Whole Foods, Boston, Massachusetts). The first ginseng product, Pro1, contained ground P. quinquefolius root in a capsule. The North American ginseng root was cultivated in Sandy City, Oregon. Three capsules containing powder Pro1 were randomly selected and combined together to minimize any product variation. The capsule shell was removed before sample extraction. The second ginseng product, Pro2, contained red P. ginseng root extract in a liquid vial. The Asian ginseng root was cultivated from Changbai, China. There were other miscellaneous ingredients that were in Pro2 such as honey, sodium benzoate and potassium sorbate.
For the UPLC-MS analysis, LC-MS-grade acetonitrile, methanol, formic acid and water was purchased from Sigma-Aldrich (St. Louis, MO, USA).
Ginseng sample preparation
The authentic ginseng root raw samples were cut into smaller pieces and grounded using pestle and mortar before extraction. Pro1 was in a capsule form and only the content was used for extraction. 0.5 g of Pro1 was dissolved in 10 mL of 70% methanol. Pro2 was in a liquid form and 0.5 g (by weight) was added in 10 mL of 70% methanol. The samples were vortexed for 1 minute and then sonicated for 30 minutes. The samples were vortexed again for 1 minute and then centrifuged for 20 minutes at 13,000 × g. The supernatant was collected and was centrifuged again for 5 minutes to remove any residual particulate matter. The final supernatant was diluted 20 times with 70% methanol before LC-MS acquisition. Blanks were also prepared in the same way which contained only 70% methanol.
UPLC-MS data acquisition
UPLC was performed on a Waters ACQUITY I-Class UPLC (Waters Corporation, Milford, USA). A reverse phase HSS T3 C18 column (2.1 × 100 mm, 1.8 µm particle size) was used and maintained at 45 ºC. The mobile phases consisted of A (water in 0.1% formic acid) and B (acetonitrile in 0.1% formic acid). A gradient elution was done at a flow rate of 0.6 mL min-1 with an injection volume of 1 µL. The gradient was as follows: 10 to 25% B (0-2 min), 25 to 35% B (2-4 min), 35% B (4-9 min), 35 to 60% B (9-11 min), 60 to 90% B (11-15 min), 90% B (15-18 min) and then 2 minute equilibration to 2% B (18-20 min).
The MS acquisition was performed on Waters Xevo G2-XS QTOF (Waters Corporation, Milford, USA) using electrospray ionization (ESI) in both positive and negative modes. In this study, only the positive mode data will be used for data analysis. Data acquisition was controlled with UNIFI 1.8 informatics platform (Waters Corporation, Milford, USA). The data range was from 100-1500 Da. Leucine enkephalin (200 pg µL-1) was used as the lock mass (m/z 556.2766). The source temperature applied was 120 ºC and the desolvation gas flow was at 1000 L h-1 with a desolvation temperature of 550 ºC. The capillary voltage was at 2.5 kV and the cone voltage was 30 V. Alternative low and high collision energy scans were used to obtain data independent acquisition (known as MSE mode). The low collision energy scan was set at 6 eV and the high collision energy scan was set at a ramp energy scan from 25 to 55 eV. The scan time for each function was 0.10 s.
Three injections were performed for each sample including blanks and were randomized before data acquisition.
Data and statistical analysis
All LC-MS data was processed, peak picked and analyzed using UNIFI informatics platform. A 3 dimensional (3D) peak detection algorithm was used to detect the peak apexes of all the ion responses based on their 3D shapes to obtain cleaner spectra and more accurate peak volumes than 2D extracted ion chromatograms. The total intensity of each ion was normalized to the total ion count to generate a matrix consisting of the m/z value, retention time (RT) and normalized peak area. The data matrix was used for multivariate statistical analysis through the EZinfo software 3.03 (Umetrics, Umea, Sweden). The data was mean-centered and Pareto-scaled for principal component analysis (PCA). The variables of interest were then identified using the discovery tools within UNIFI software. The discovery tool in UNIFI connects directly to Waters traditional medicine library.
Results and Discussion
The LC-MS chromatograms of all the authentic and commercial ginseng samples are shown in Figure 1.
UPLC/QTOF-MS BPI chromatograms of authenticated ginseng and commercial ginseng products in positive mode: (A) red Panax ginseng; (B) Panax ginseng; (C) Panax nontoginseng; (D) Panax quinquefolius; (E) Product 1; (F) Product 2.
Using a single extraction procedure of 70% methanol for all samples combined with an optimal UPLC method, many of the peaks were well separated in a 14 minute run. From the authentic ginseng species (red P. ginseng, P. ginseng, P. notoginseng and P. quinquefolius), each chromatogram (Figures 1A-D) shows a unique chemical profile with similarities and differences across their peak profiles. The commercial samples (Pro1 and Pro2) had characteristic chemical profiles (Figures 1E-F) with more peaks than the authentic samples. With only visual comparison of the samples, it is difficult to fully understand the variation in their chromatograms. Instead, multivariate statistical modeling such as principal component analysis (PCA) was used to understand the similarities between the samples and identify the potential chemical markers of interest that classify them from each other.
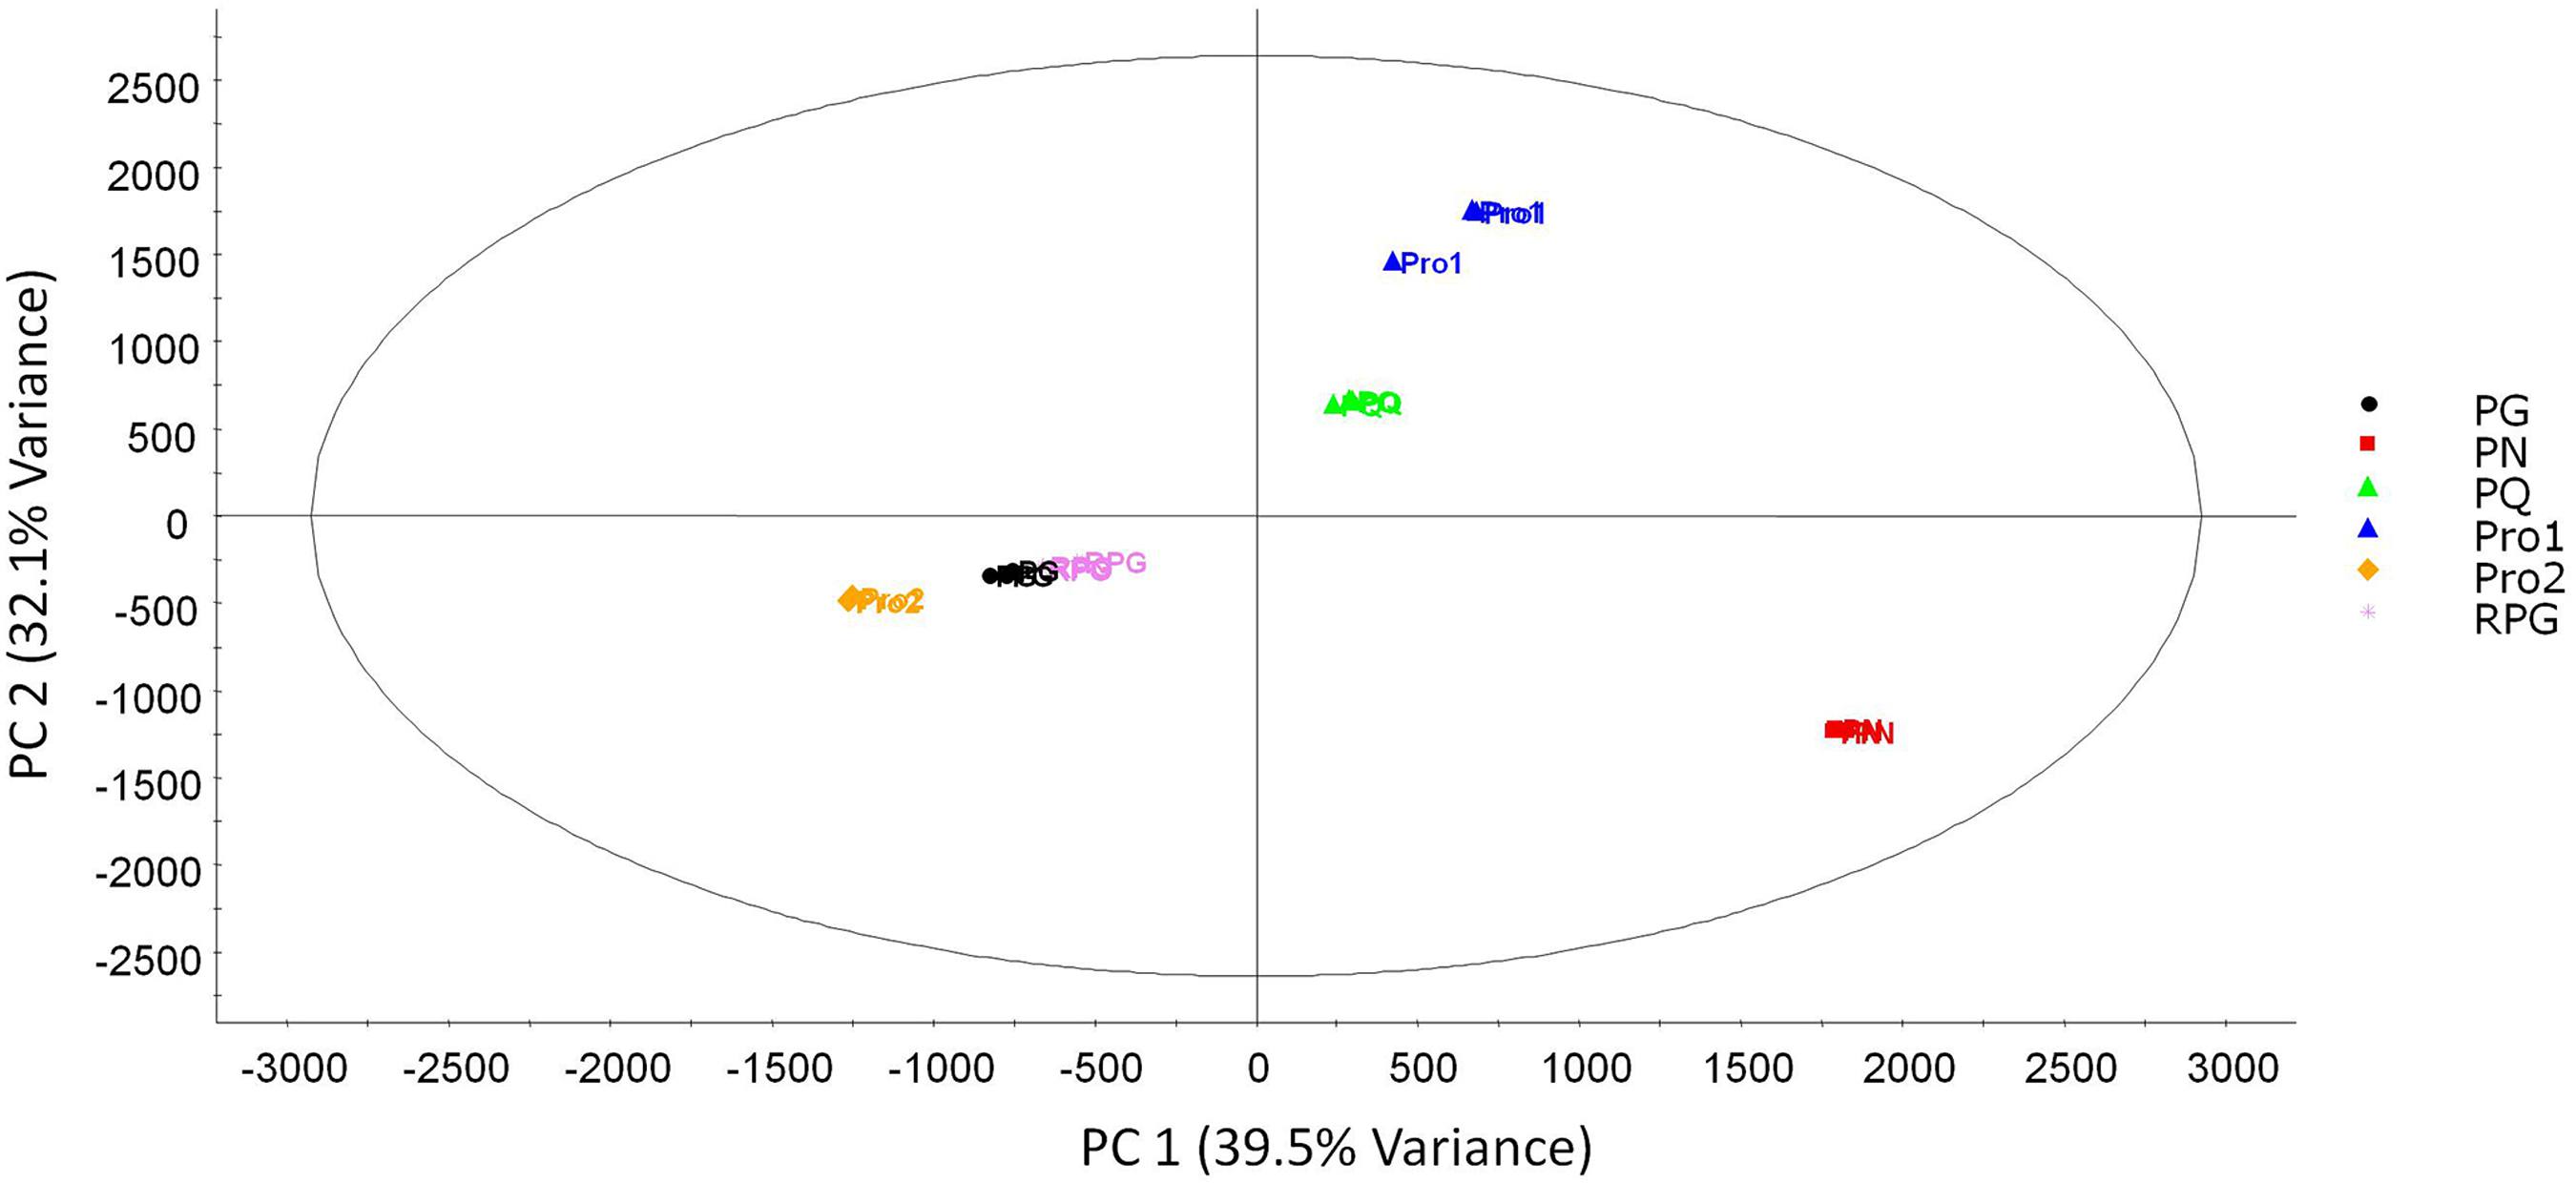
In Figure 2, a PCA scores plot was created to classify all the authentic and commercial ginseng samples.
The principal component analysis (PCA) scores plot for the authenticated ginseng and commercial ginseng products. The first two principal components are shown. The ellipse represents the 95% confidence interval of the PCA model. The abbreviations in the PCA scores are as follows: RPG: red Panax ginseng; PG: Panax ginseng; PN: Panax notoginseng; PQ: Panax quinquefolius; Pro1: Product 1 and Pro2: Product 2.
In a PCA scores plot, each sample is represented by a symbol and their distances from each other reflect how closely related their chemical profiles are. The variables used for comparison are the exact mass to retention time pair (EMRT) and normalized peak areas. PCA is considered an unbiased model, as it does not use any class discrimination during the calculation and results can show unique groupings and interesting outliers of complex datasets.2525 Lindon, J. C.; Nicholson, J. K.; Holmes, E.; The Handbook of Metabonomics and Metabolomics; Elsevier Science: London, 2011. From the scores plot (Figure 2), the first two principal components were used which encompassed 71.6% of the total explained variance. There was excellent reproducibility for all the samples with tight groupings of the authentic and commercial samples. For the authentic ginseng samples, there was clear separation between P. quinquefolius (PQ), P. notoginseng (PN) and the two P. ginseng types, red (RPG) and normal (PG). Each species group was situated in their own quadrant in the scores plot. The RPG and PG samples were closely associated with each other in the PCA scores which show similarities between the two types of samples. RPG and PG have the same plant origins but are different due to sample processing. RPG is prepared by using fresh PG roots and then steamed for a period of time before drying.2626 Lee, S. M.; Bae, B.-S.; Park, H.-W.; Ahn, N.-G.; Cho, B.-G.; Cho, Y.-L.; Kwak, Y.-S.; J. Ginseng Res. 2015, 39, 384. Overall, this process changes the RPG's chemical profile and biological activity.2626 Lee, S. M.; Bae, B.-S.; Park, H.-W.; Ahn, N.-G.; Cho, B.-G.; Cho, Y.-L.; Kwak, Y.-S.; J. Ginseng Res. 2015, 39, 384. The tight association of the two preparations of ginseng is mainly due to the vast profile differences from the other two species, PQ and PN, which forces the two P. ginseng groups to be closer together. When the two PG groups were modeled separately (not shown), there was a clear separation between the two preparations of ginseng. For this study, the further classification of RPG and PG was not considered, as the objective was to understand their distinction with the other species, PQ and PN and also the commercial products. If readers are interested in their classification, a previous study by Zhang et al.2020 Zhang, H.-M.; Li, S.-L.; Zhang, H.; Wang, Y.; Zhao, Z.-L.; Chen, S.-L.; Xu, H.-X.; J. Pharm. Biomed. Anal. 2012, 62, 258. described the differences in chemical profiles of RPG and PG. For Pro1, which contains PQ roots, the samples were closely grouped to the authentic PQ samples. Pro2, which contains red PG root extract, was also closely associated with the authentic PG groups. The correct classification of the commercial ginseng products with the authentic ginseng species show the high potential of using chemical profiling as a powerful verification of complex natural products when compared to authentic samples.
To understand the specific chemical variations causing the profile differences of the ginseng samples in the PCA scores plot, a loadings plot (Figure 3) was generated.
The PCA loadings plot for the authenticated ginseng and commercial ginseng products. Each dot represents a m/z-RT variable.
In the loadings plot, each point represents the EMRT pair and complements the information in the scores plot by showing which variables were important in differentiating the sample groupings. In Figure 3, the three distinct quadrants that classified the three ginseng species, PQ, PN and PG, in the scores plot have many variables (m/z) associated in that area. The other variables which were mainly located in the center of the plot are considered ones that are not significantly different in all the samples and thus were not analyzed further.
The next step to further understand the chemical profile differences, the key differentiating variables (EMRT) in each of the quadrants were tagged and linked into the discovery tools in UNIFI which connects to an in-house traditional medicine library. In Figure 4, all the specific variables in the PCA loadings plot that corresponded to the three different ginseng species were screened. From Waters traditional medicine library which consists of 600 herbs and ca. 6400 compounds, the variables were screened to identify any potential markers. One of the markers, gypenoside XVII, a triterpene glycoside, was identified with a sodium adduct at m/z 969.5372 at 10.05 minutes. This marker was clearly seen as a distinct variable for PQ in the loadings plot (Figure 3). Gypenoside XVII is a protopanaxadiol-type triterpene saponin in which the hydroxyl groups at positions 3 and 20(S) have been converted to the corresponding β-D-glucopyranoside and β-D-glucopyranosyl-(1→6)-β-D-glucopyranoside respectively. Gypenoside XVII has been studied as a characteristic marker for the North American ginseng.2727 Besso, H.; Kasai, R.; Wei, J.; Wang, J.; Saruwatari, Y.; Fuwa, T.; Tanaka, O.; Chem. Pharm. Bull. 1982, 30, 4534.,2828 Awang, D. V. C.; J. Herbs, Spices Med. Plants 2000, 7, 103. To further confirm the identification of gypenoside XVII, the discovery tools also creates theoretical fragments for gypenoside XVII based on the susceptibility of bond breakage from the molecular structure. Using the fragment matching function of the discovery tools, twenty fragments for gypenoside XVII were matched in the high energy MSE spectrum. The major fragments observed for gypenoside XVII are formed from the cleavage of glycosidic linkages resulting in losses of sugar residues thus yielding an aglycone moiety and subsequent series of dehydrated ions. Similar pattern of fragmentation is also observed for other identified marker ginsenosides. For illustration purposes, in the mass spectra of gypenoside XVII (Figure 4), structures and likely bond cleavages are shown for five fragment ions, 767.492 [M + H-Glc−H2O], 605.440 [M + H-Glc66 Wang, C.-Z.; Ni, M.; Sun, S. H. I.; Li, X.-L.; He, H. U. I.; Mehendale, S. R.; Yuan, C.-S.; J. Agric. Food Chem. 2009, 57, 2363.-Glc-H2O], 587.430 [M + H-Glc66 Wang, C.-Z.; Ni, M.; Sun, S. H. I.; Li, X.-L.; He, H. U. I.; Mehendale, S. R.; Yuan, C.-S.; J. Agric. Food Chem. 2009, 57, 2363.-Glc-2H2O], 425.377 [M + H-Glc-Glc66 Wang, C.-Z.; Ni, M.; Sun, S. H. I.; Li, X.-L.; He, H. U. I.; Mehendale, S. R.; Yuan, C.-S.; J. Agric. Food Chem. 2009, 57, 2363.-Glc−2H2O] and 325.113 (dehydrated β-D-glucopyranosyl-(1→6)-β-D-glucopyranoside residue). Two selected m/z variables in the marker matrix list at retention time of 10.05 min, 425.3774 and 587.4301 m/z were detected as confirmed fragments for gypenoside XVII. In the PCA loadings plot, these two fragments were seen for PQ.
The discovery tools in UNIFI showing an identified marker, gypenoside XVII from the list of selected variables from the PCA loadings plot. The chemical information and molecular structure of gypenoside XVII from an in-house traditional medicine library is also shown. A mass spectrum of ginseng is also displayed with all the theoretical fragments for gypenoside XVII identified on the spectrum.
The confirmation of the parent and fragment ions from the loadings plot provides a higher confidence for the identification of the marker. Using the workflow described above, ten main compounds were identified that separate the three ginseng species (Table 1). From the table, protopanaxatriol ginsenoside, Rf,2929 Yoon, S.-R.; Nah, J.-J.; Kim, S.-K.; Kim, S.-C.; Nam, K.-Y.; Jung, D.-W.; Nah, S.-Y.; Chem. Pharm. Bull. 1998, 46, 1144. protopanaxdiol ginsenosides Rb2,3030 Chi, H.; Kim, D.-H.; Ji, G.-E.; Biol. Pharm. Bull. 2005, 28, 2102. Ra1 and Ra23131 Shin, B.-K.; Kwon, S. W.; Park, J. H.; J. Ginseng Res. 2015, 39, 287. were detected as the distinct markers for PG. For PQ, the characteristic markers, psuedoginsenoside F11,3232 Kim, D.-H.; J. Ginseng Res. 2012, 36, 1. ginsenoside Rd3232 Kim, D.-H.; J. Ginseng Res. 2012, 36, 1. and the previously described gypsenoside XVII were identified. Three related saponins, notoginsenoside R1, R4 and Fa were detected for PN. Dong et al.3333 Dong, T. T. X.; Cui, X. M.; Song, Z. H.; Zhao, K. J.; Ji, Z. N.; Lo, C. K.; Tsim, K. W. K.; J. Agric. Food Chem. 2003, 51, 4617. conducted an extensive chemical assessment of PN in various cultivations areas of China and described notoginenoside R1 to be a distinct marker compared to the other two species, PQ and PG.
The list of chemical markers that were identified from the PCA loadings plot using UNIFI. The standard deviation was calculated to show variation in the average
The European Medicines Agency (EMEA) defines chemical markers as appropriate indicators for the presence of the herbal medicines even if therapeutic activity is not present.3434
http:///www.ema.europa.eu/docs/en_GB/document_library/Scientific_guideline/2009/09/WC500003211.pdf, accessed in June 2016.
http:///www.ema.europa.eu/docs/en_GB/doc...
The results of this study showed that chemical profiling can be an effective methodology for classifying herbal materials such as ginseng through a non-targeted approach. With appropriate herbal reference materials for comparison, chemical profiling can provide an accurate solution for quick verification of natural products sold in the market. The ginseng sample preparation, data acquisition (14 minutes) and analysis using UPLC/QTOF-MS with a fast, streamlined informatics workflow enabled high sample throughput for large sample batches. However, one caveat for chemical profiling of natural products is the standard operating procedure (SOP) for every sample. The slight changes in sample preparation to variations in parameters for data acquisition in a study can play a large role in the accuracy of the results. The difference in extraction solvents and techniques can cause a vast difference in the chemical profile of herbal materials and should be carefully assessed before starting any profiling study.3535 Ong, E. S.; J. Chromatogr. B: Anal. Technol. Biomed. Life Sci.
2004, 812, 23. To ensure proper comparison of sample batches, it is recommended to standardize the SOP. This will allow studies to be compared over time and the sharing of results to other laboratories that follow the same SOP.
Conclusions
The application of chemical profiling using UPLC/QTOF-MS on three ginseng species (Panax quinquefolius, Panax ginseng and Panax notoginseng) and two commercial ginseng products containing P. quinquefolius and red P. ginseng was examined. The multivariate statistical analysis was successful in discriminating among three ginsen species and correctly classifying the commercial products to the proper standard reference. Ten main compounds were identified when the chemical signals from the model were screened using an in-house traditional medicine library. All the compounds were considered distinct markers for each of the ginseng species. Overall, this non-targeted approach with an integrated and rapid workflow shows high potential for the assessment of complex natural products such as ginseng and their commercial products.
Acknowledgments
The authors thank Sukhdev Bangar for technical assistance and valuable discussions.
References
-
1Sengupta, S.; Toh, S.-A.; Sellers, L. A.; Skepper, J. N.; Koolwijk, P.; Leung, H. W.; Yeung, H.-W.; Wong, R. N. S.; Sasisekharan, R.; Fan, T.-P. D.; Circulation 2004, 110, 1219.
-
2Kang, J.; Lee, S.; Kang, S.; Kwon, H.; Park, J.; Kwon, S.; Park, S.; Arch. Pharmacal Res. 2008, 31, 330.
-
3Nag, S. A.; Qin, J.-J.; Wang, W.; Wang, M.-H.; Wang, H.; Zhang, R.; Front. Pharmacol. 2012, 3, 25.
-
4Smolinske, S. C.; J. Pharm. Pract. 2005, 18, 188.
-
5Phua, D. H.; Zosel, A.; Heard, K.; Int. J. Emerg. Med. 2009, 2, 69.
-
6Wang, C.-Z.; Ni, M.; Sun, S. H. I.; Li, X.-L.; He, H. U. I.; Mehendale, S. R.; Yuan, C.-S.; J. Agric. Food Chem. 2009, 57, 2363.
-
7Hon, C. C.; Chow, Y. C.; Zeng, F. Y.; Leung, F. C. C.; Acta Pharmacol. Sin. 2003, 24, 841.
-
8Bai, D. P.; Brandle, J.; Reeleder, R.; Genome 1997, 40, 111.
-
9Brown, P. N.; J. AOAC Int. 2011, 94, 1391.
-
10McIntyre, K.; Luu, A.; Sun, C.; Brown, D.; Lui, E. M. K.; Arnason, J. In The Biological Activity of Phytochemicals, vol. 41; Gang, D. R., ed.; Springer: New York, 2011, p. 97.
-
11Kim, I.-W.; Cha, K.-M.; Wee, J. J.; Ye, M. B.; Kim, S.-K.; J. Ginseng Res. 2013, 37, 475.
-
12Kang, J.; Choi, M.-Y.; Kang, S.; Kwon, H. N.; Wen, H.; Lee, C. H.; Park, M.; Wiklund, S.; Kim, H. J.; Kwon, S. W.; Park, S.; J. Agric. Food Chem. 2008, 56, 11589.
-
13Yuk, J.; McIntyre, K.; Fischer, C.; Hicks, J.; Colson, K.; Lui, E.; Brown, D.; Arnason, J.; Anal. Bioanal. Chem. 2013, 405, 4499.
-
14Chan, T. W. D.; But, P. P. H.; Cheng, S. W.; Kwok, I. M. Y.; Lau, F. W.; Xu, H. X.; Anal. Chem. 2000, 72, 1281.
-
15Smillie, T. J.; Khan, I. A.; Clin. Pharmacol. Ther. 2010, 87, 175.
-
16Xian-Ke, Z.; Di-Cai, L.; Jian-Guo, J.; Curr. Med. Chem. 2009, 16, 3064.
-
17Fu, P. P.; Chiang, H.-M.; Xia, Q.; Chen, T. A. O.; Chen, B. H.; Yin, J.-J.; Wen, K.-C.; Lin, G. E.; Yu, H.; J. Environ. Sci. Health, Part C: Environ. Carcinog. Ecotoxicol. Rev. 2009, 27, 91.
-
18Lee, E.-J.; Shaykhutdinov, R.; Weljie, A. M.; Vogel, H. J.; Facchini, P. J.; Park, S.-U.; Kim, Y.-K.; Yang, T.-J.; J. Agric. Food Chem. 2009, 57, 7513.
-
19Yang, S. O.; Shin, Y. S.; Hyun, S. H.; Cho, S.; Bang, K. H.; Lee, D.; Choi, S. P.; Choi, H. K.; J. Pharm. Biomed. Anal. 2012, 58, 19.
-
20Zhang, H.-M.; Li, S.-L.; Zhang, H.; Wang, Y.; Zhao, Z.-L.; Chen, S.-L.; Xu, H.-X.; J. Pharm. Biomed. Anal. 2012, 62, 258.
-
21Lei, Z.; Huhman, D. V.; Sumner, L. W.; J. Biol. Chem. 2011, 286, 25435.
-
22Nordström, A.; O'Maille, G.; Qin, C.; Siuzdak, G.; Anal. Chem. 2006, 78, 3289.
-
23Hamid, H. A.; Yusoff, M. M.; Liu, M.; Karim, M. R.; J. Funct. Foods 2015, 16, 74.
-
24Lee, J.; Ji, S.; Lee, M.; Kim, G.; Ahn, Y.; Metabolomics 2015, 5
-
25Lindon, J. C.; Nicholson, J. K.; Holmes, E.; The Handbook of Metabonomics and Metabolomics; Elsevier Science: London, 2011.
-
26Lee, S. M.; Bae, B.-S.; Park, H.-W.; Ahn, N.-G.; Cho, B.-G.; Cho, Y.-L.; Kwak, Y.-S.; J. Ginseng Res. 2015, 39, 384.
-
27Besso, H.; Kasai, R.; Wei, J.; Wang, J.; Saruwatari, Y.; Fuwa, T.; Tanaka, O.; Chem. Pharm. Bull. 1982, 30, 4534.
-
28Awang, D. V. C.; J. Herbs, Spices Med. Plants 2000, 7, 103.
-
29Yoon, S.-R.; Nah, J.-J.; Kim, S.-K.; Kim, S.-C.; Nam, K.-Y.; Jung, D.-W.; Nah, S.-Y.; Chem. Pharm. Bull. 1998, 46, 1144.
-
30Chi, H.; Kim, D.-H.; Ji, G.-E.; Biol. Pharm. Bull. 2005, 28, 2102.
-
31Shin, B.-K.; Kwon, S. W.; Park, J. H.; J. Ginseng Res. 2015, 39, 287.
-
32Kim, D.-H.; J. Ginseng Res. 2012, 36, 1.
-
33Dong, T. T. X.; Cui, X. M.; Song, Z. H.; Zhao, K. J.; Ji, Z. N.; Lo, C. K.; Tsim, K. W. K.; J. Agric. Food Chem. 2003, 51, 4617.
-
34http:///www.ema.europa.eu/docs/en_GB/document_library/Scientific_guideline/2009/09/WC500003211.pdf, accessed in June 2016.
» http:///www.ema.europa.eu/docs/en_GB/document_library/Scientific_guideline/2009/09/WC500003211.pdf -
35Ong, E. S.; J. Chromatogr. B: Anal. Technol. Biomed. Life Sci. 2004, 812, 23.
Publication Dates
-
Publication in this collection
Aug 2016
History
-
Received
25 Jan 2016 -
Accepted
21 June 2016