Abstract
Immunosensors based on impedance spectroscopy for diagnosing hepatitis C are reported where the sensing units were made with the antigenic peptide PPLLESWKDPDYVPPWHG (NS5A-1) derived from the NS5A protein of the hepatitis C virus (HCV) immobilized in layer-by-layer (LbL) films with silk fibroin (SF) and deposited on gold interdigitated electrodes. The electrical response of the sensing units varied upon immersion into solutions containing the antibody anti-HCV owing to the biomolecular recognition of NS5A-1. This was associated with morphological changes on the LbL films caused by adsorption of NS5A-1 and inferred from atomic force microscopy images. Buffer solutions with different anti-HCV concentrations down to 2 ng mL-1 could be clearly distinguished by analyzing the impedance spectroscopy data with a multidimensional projection technique. The specificity toward anti-HCV antibodies was confirmed in control experiments where no significant changes in the electrical response were measured by exposing the sensing units to solutions containing an anti-human immunodeficiency virus (HIV) antibody. The high sensitivity and selectivity of the units made with LbL films demonstrate the feasibility of measuring electrical impedance as an immunosensing strategy to detect hepatitis C.
Keywords:
immunosensor; layer-by-layer film; antigenic peptide; hepatitis C; impedance spectroscopy
Introduction
Hepatitis C virus (HCV) transmitted by contaminated blood or derivatives through transfusion or intravenous drug injections was identified in 1989.11 Choo, Q. L.; Kuo, G.; Weiner, A. J.; Overby, L. R.; Bradley, D. W.; Houghton, M.; Science
1989, 244, 359. Its infection causes hepatitis C, a chronic infection leading to liver fibrosis, cirrhosis and even hepatocellular carcinoma, which affects ca. 200 million people worldwide.22 Alter, M. J.; World J. Gastroenterol.
2007, 13, 2436.,33 Kazmierski, W. M.; Maynard, A.; Duan, M.; Baskaran, S.; Botyanszki, J.; Crosby, R.; Dickerson, S.; Tallant, M.; Grimes, R.; Hamatake, R.; Leivers, M.; Roberts, C. D.; Walker, J.; J. Med. Chem.
2014, 57, 2058. Because transmission occurs in routine procedures such as blood transfusion, it is crucial to detect HCV with fast, low cost methods.44 Radhakrishnan, R.; Suni, I. I.; Bever, C. S.; Hammock, B. D.; ACS Sustainable Chem. Eng.
2014, 2, 1649.,55 Daniels, J. S.; Pourmand, N.; Electroanalysis
2007, 19, 1239. Unfortunately, the tests for diagnostics most used today for hepatitis C, including enzyme-linked immunosorbent assay (ELISA), recombinant immunoblot assay and ribonucleic acid (RNA) polymerase chain reaction (PCR), involve relatively high-cost, time-consuming procedures.66 Widell, A.; Molnegren, V.; Pieksma, F.; Calmann, M.; Peterson, J.; Lee, S. R.; Transfus. Med.
2002, 12, 107.
7 Ergünay, K.; Şener, B.; Alp, A.; Karakaya, J.; Hasçelik, G.; Diagn. Microbiol. Infect. Dis.
2011, 70, 486.-88 Park, Y.; Lee, J. H.; Kim, B. S.; Kim, D. Y.; Han, K. H.; Kim, H. S.; J. Clin. Microbiol.
2010, 48, 2253.
Recently, nanoarchitectonics has been applied in many research fields such as nano/molecular-scale control, fabrication and synthesis of nanostructured materials, more specifically in sensors and biological/biomedical applications.99 Khan, A. H.; Ghosh, S.; Pradhan, B.; Dalui, A.; Shrestha, L. K.; Acharya, S.; Ariga, K.; Bull. Chem. Soc. Jpn.
2017, 90, 627.,1010 Komiyama, M.; Yoshimoto, K.; Sisido, M.; Ariga, K.; Bull. Chem. Soc. Jpn.
2017, 90, 967. Nanoarchitectonics is a new concept for the fabrication of functional material systems through harmonization of various actions including atomic/molecular-level manipulation, chemical reactions, self-assembly and self-organization and their modulation by external fields/stimuli.1111 Ariga, K.; Minami, K.; Ebara, M.; Nakanishi, J.; Polym. J.
2016, 48, 371.,1212 Ariga, K.; Mater. Chem. Front.
2017, 1, 208. From that concept, major efforts are now devoted to develop novel HCV diagnostic methods,1313 Ma, C.; Liang, M.; Wang, L.; Xiang, H.; Jiang, Y.; Li, Y.; Xie, G.; Biosens. Bioelectron.
2013, 47, 467.
14 Ma, C.; Xie, G.; Zhang, W.; Liang, M.; Liu, B.; Xiang, H.; Microchim. Acta
2012, 178, 331.
15 Moraes, M. L.; Lima, L. R.; Silva, R. R.; Cavicchioli, M.; Ribeiro, S. J. L.; Langmuir
2013, 29, 3829.-1616 Blaising, J.; Pécheur, E. I.; Biochimie
2013, 95, 96. especially employing electrochemical immunosensors. For example, Ma et al.1313 Ma, C.; Liang, M.; Wang, L.; Xiang, H.; Jiang, Y.; Li, Y.; Xie, G.; Biosens. Bioelectron.
2013, 47, 467. produced a sandwich structure deposited on glassy carbon electrodes to detect the HCV core antigen. This structure was made with an anti-HCV antibody immobilized into a nanocomposite matrix comprising gold nanoparticles, zirconia nanoparticles and chitosan, while a secondary antibody was immobilized on SiO2 and gold nanoparticles. The HCV core antigen could be detected in the concentration range between 2 and 512 ng mL-1. Ghanbari and Roushani1717 Ghanbari, K.; Roushani, M.; Sens. Actuators, B
2018, 258, 1066. used multi-walled carbon nanotubes-chitosan nanocomposite as a special immobilization interface to improve the conductivity and performance characteristics of the HCV sensors. The sensor response indicated a linear range from 5.0 fg mL-1 to 1.0 pg mL-1 with a detection limit of 1.67 fg mL-1. Another electrochemical and optical immunosensors for HCV, investigated in our group, exploited biorecognition between an antigenic peptide derived from the HCV PPLLESWKDPDYVPPWHG (NS5A-1) protein and anti-HCV where the peptide was immobilized in layer-by-layer (LbL) films with alternating layers of silk fibroin (SF).1515 Moraes, M. L.; Lima, L. R.; Silva, R. R.; Cavicchioli, M.; Ribeiro, S. J. L.; Langmuir
2013, 29, 3829.,1818 Lima, L. R.; Moraes, M. L.; Nigoghossian, K.; Peres, M. F. S.; Ribeiro, S. J. L.; J. Lumin.
2016, 170, 375. The NS5A protein of the HCV contains various epitopes or antigenic sequences highly relevant to the diagnosis of the virus, which can be modeled as synthetic or recombinant peptides.1919 Dou, X. G.; Talekar, G.; Chang, J.; Dai, X.; Li, L.; Bonafonte, M. T.; Holloway, B.; Fields, H. A.; Khudyakov, Y. E.; J. Clin. Microbiol.
2002, 40, 61. The antigenic peptide NS5A-1 was used due to its high immunoreactivity with anti-HCV positive samples. Immobilization of this peptide on SF was able to structure it so that the specific recognition with the antibody was analyzed by electrical signals1515 Moraes, M. L.; Lima, L. R.; Silva, R. R.; Cavicchioli, M.; Ribeiro, S. J. L.; Langmuir
2013, 29, 3829. and the use of luminescent nanoparticles in the same system allowed the detection of HCV antibodies by optical measurements.1818 Lima, L. R.; Moraes, M. L.; Nigoghossian, K.; Peres, M. F. S.; Ribeiro, S. J. L.; J. Lumin.
2016, 170, 375. SF is a protein extracted from natural silk suitable for immobilization of biomaterials in LbL films,2020 Nogueira, G. M.; Swiston, A. J.; Beppu, M. M.; Rubner, M. F.; Langmuir
2010, 26, 8953.
21 Cai, K.; Hu, Y.; Jandt, K. D.; J. Biomed. Mater. Res., Part A
2007, 82, 927.-2222 Xue, R.; Kang, T. F.; Lu, L. P.; Cheng, S. Y.; Appl. Surf. Sci.
2012, 258, 6040. being also compatible with various types of cells and possessing high mechanical strength.2323 Kundu, B.; Rajkhowa, R.; Kundu, S. C.; Wang, X.; Adv. Drug Delivery Rev.
2013, 65, 457.,2424 Qi, Y.; Wang, H.; Wei, K.; Yang, Y.; Zheng, R. Y.; Kim, I. S.; Zhang, K. Q.; Int. J. Mol. Sci.
2017, 18, 237. SF produced by Bombyx mori consists of 12 repetitive domains Gly-X, where X is 65% L-alanine (Ala), 23% L-serine (Ser), and 9% L-tyrosine (Tyr).2525 Zhou, C. Z.; Confalonieri, F.; Jacquet, M.; Perasso, R.; Li, Z. G.; Janin, J.; Proteins
2001, 44, 119.,2626 Ming, J.; Pan, F.; Zuo, B.; Int. J. Biol. Macromol.
2015, 75, 398. The anti-HCV antibody could be detected using cyclic voltammetry for concentrations between 10 and 200 ng mL-1. LbL method has been reported as suitable for biological molecules immobilization due to its versatility and to the fact that the adsorption process is conducted under mild conditions.2727 Ariga, K.; Yamauchi, Y.; Rydzek, G.; Ji, Q.; Yonamine, Y.; Wu, K. C.-W.; Hill, J. P.; Chem. Lett.
2014, 43, 36.,2828 Costa, R. R.; Mano, J. F.; Chem. Soc. Rev.
2014, 43, 3453. The assembly of the LbL film is based on intermolecular interactions between the materials, so a great interest is dedicated to find suitable materials for alternating with the biomolecule which can retain its specific biological function.2727 Ariga, K.; Yamauchi, Y.; Rydzek, G.; Ji, Q.; Yonamine, Y.; Wu, K. C.-W.; Hill, J. P.; Chem. Lett.
2014, 43, 36.
28 Costa, R. R.; Mano, J. F.; Chem. Soc. Rev.
2014, 43, 3453.
29 Decher, G.; Science
1997, 277, 1232.
30 Ariga, K.; Lvov, Y.; Kunitake, T.; J. Am. Chem. Soc.
1997, 119, 2224.
31 David, M.; Barsan, M. M.; Brett, C. M. A.; Florescu, M.; Sens. Actuators, B
2018, 255, 3227.-3232 Coulibaly, F. S.; Ezoulin, M. J. M.; Purohit, S. S.; Ayon, N. J.; Oyler, N. A.; Youan, B. B. C.; Mol. Pharmacol.
2017, 14, 3512.
An alternative approach to increase sensitivity is the use of electrical impedance measurements, which are normally employed to exploit changes in dielectric properties, charge distribution and/or thickness of the dielectric layer when an antibody-antigen complex is formed on the electrode surface.3333 Taylor, D. M.; Macdonald, A. G.; J. Phys. D: Appl. Phys.
1987, 20, 1277.
34 Berggren, C.; Bjarnason, B.; Johansson, G.; Electroanalysis
2001, 13, 173.-3535 Tsouti, V.; Boutopoulos, C.; Zergioti, I.; Chatzandroulis, S.; Biosens. Bioelectron.
2011, 27, 1. In this paper, we report on electrical impedance measurements for detecting the anti-HCV antibody, again exploiting the biorecognition between the antibody and the antigenic peptide NS5A-1 immobilized in LbL films with SF. The data were analyzed using an information visualization method to improve distinction of different concentrations of the antibody.3636 Paulovich, F. V.; Moraes, M. L.; Maki, R. M.; Ferreira, M.; Oliveira, O. N.; de Oliveira, M. C. F.; Analyst
2011, 136, 1344.
Experimental
The sensing unit was fabricated by depositing an LbL film made of SF alternated with layers of the antigenic peptide NS5A-1 purchased from Bio-Synthesis Inc. SF served as the immobilization matrix, and was extracted from the cocoons of the Bombyx mori silkworm silk supplied by Bratac, using the procedures described by Rockwood et al.3737 Rockwood, D. N.; Preda, R. C.; Yucel, T.; Wang, X.; Lovett, M. L.; Kaplan, D. L.; Nat. Protoc. 2011, 6, 1612. For extraction, 10 g of cocoons were boiled in 2 L of a 0.02 mol L-1 Na2CO3 solution in 30 min and washed with Milli-Q water to remove sericin. SF was dissolved in CaCl2/CH3CH2OH/H2O (1:2:8) solution at 60 °C, and dialyzed with Milli-Q water using a cellulose acetate membrane at room temperature for 48 h. The SF film was made with an aqueous solution at concentration of 0.1% (m/v).
For deposition of the peptide layers, a 0.5 mg mL-1 solution in Milli-Q water was used. Figure 1a shows the procedure for fabricating the LbL films of NS5A-1 peptide and SF on an interdigitated electrode. The electrode was initially immersed in SF solution for 10 min, followed by washing with Milli-Q water to remove loosely adsorbed molecules. Next, it was immersed in NS5A-1 solution for 10 min. This procedure was repeated until the desired number of SF/NS5A-1 bilayers was deposited. SF and the peptide assume secondary structures when immobilized onto LbL films, as shown in a previous study.1515 Moraes, M. L.; Lima, L. R.; Silva, R. R.; Cavicchioli, M.; Ribeiro, S. J. L.; Langmuir 2013, 29, 3829. Film morphology was evaluated by taking atomic force microscopy (AFM) images with an Agilent 5500 microscope in the intermittent contact mode under ambient conditions, and using conventional silicon multipurpose cantilevers. All images were processed using Gwyddion AFM analysis software.
Schematic representation of the SF/NS5A-1 LbL film (a) and specific recognition between anti-HCV and NS5A-1 (b).
The analytes detected were antibodies anti-NS5A-1 and anti-p24, specific for protein NS5A and p24 proteins from HCV and human immunodeficiency virus (HIV)-1, respectively, obtained from Santa Cruz Biotechnology Inc., in which the latter served as a control to test specificity. The antibodies were diluted in a phosphate buffered saline (PBS) solution at concentrations ranging from 2 µg mL-1 to 1 mg mL-1. All reagents were used without further purification.
Impedance measurements were carried out with a Solartron 1260A impedance/gain phase analyzer in a frequency range from 1 to 106 Hz. The measurements were performed using interdigitated electrodes made of 50 pairs of gold electrodes (10 µm in width and 200 nm in thickness) that are 10 µm apart from each other. The electrodes were coated with 1 to 5 bilayers of SF/NS5A-1 LbL films. Experiments were performed by adding anti-HCV antibody or anti-HIV antibody in PBS (pH 7.4) at several concentrations (0, 0.002, 0.01, 0.02, 0.1, 0.2 and 1 µg mL-1) on the interdigitated electrodes, as shown in Figure 1b, starting always from the lowest concentration. This procedure is important because strong, specific interaction between the analyte and the peptide will affect the film properties. All measurements were done in triplicate. The dielectric loss and capacitance values were obtained by modeling the impedance response with an equivalent circuit3333 Taylor, D. M.; Macdonald, A. G.; J. Phys. D: Appl. Phys. 1987, 20, 1277. and data from the imaginary and real parts were treated with a multidimensional projection technique, referred to as interactive document map (IDMAP).3636 Paulovich, F. V.; Moraes, M. L.; Maki, R. M.; Ferreira, M.; Oliveira, O. N.; de Oliveira, M. C. F.; Analyst 2011, 136, 1344.
Results and Discussion
Impedance spectroscopy measurements were performed with 1-bilayer SF/NS5A-1 LbL films deposited onto interdigitated gold electrodes in the presence and absence of anti-HCV and anti-HIV antibodies. Figure 2 shows larger capacitance (F) and dielectric loss (G ω-1) vs. frequency (Hz) at electrodes coated with a 1-bilayer LbL film with higher anti-HCV concentrations (> 2 ng mL-1). In subsequent experiments, we also tested electrodes coated with 2, 3, 4 and 5 SF/NS5A-1 bilayers, and found a non-monotonic behavior with the number of layers for the distinction ability. Figure S1 (Supplementary Information (SI) section) points to smaller changes in the curves for a sensing unit with 5 SF/NS5A-1 bilayers when the anti-HCV concentration was varied. Probably, there is a competition between increasing the amount of NS5A-1, which should enhance the performance, and having thicker films, which may decrease the efficiency in distinction. We shall return to this issue when discussing the AFM images. Optimized results were obtained with the 1-bilayer film.
Capacitance and dielectric loss vs. frequency curves for 1-bilayer LbL films of SF/NS5A-1, in the absence and presence of different concentrations of anti-HCV.
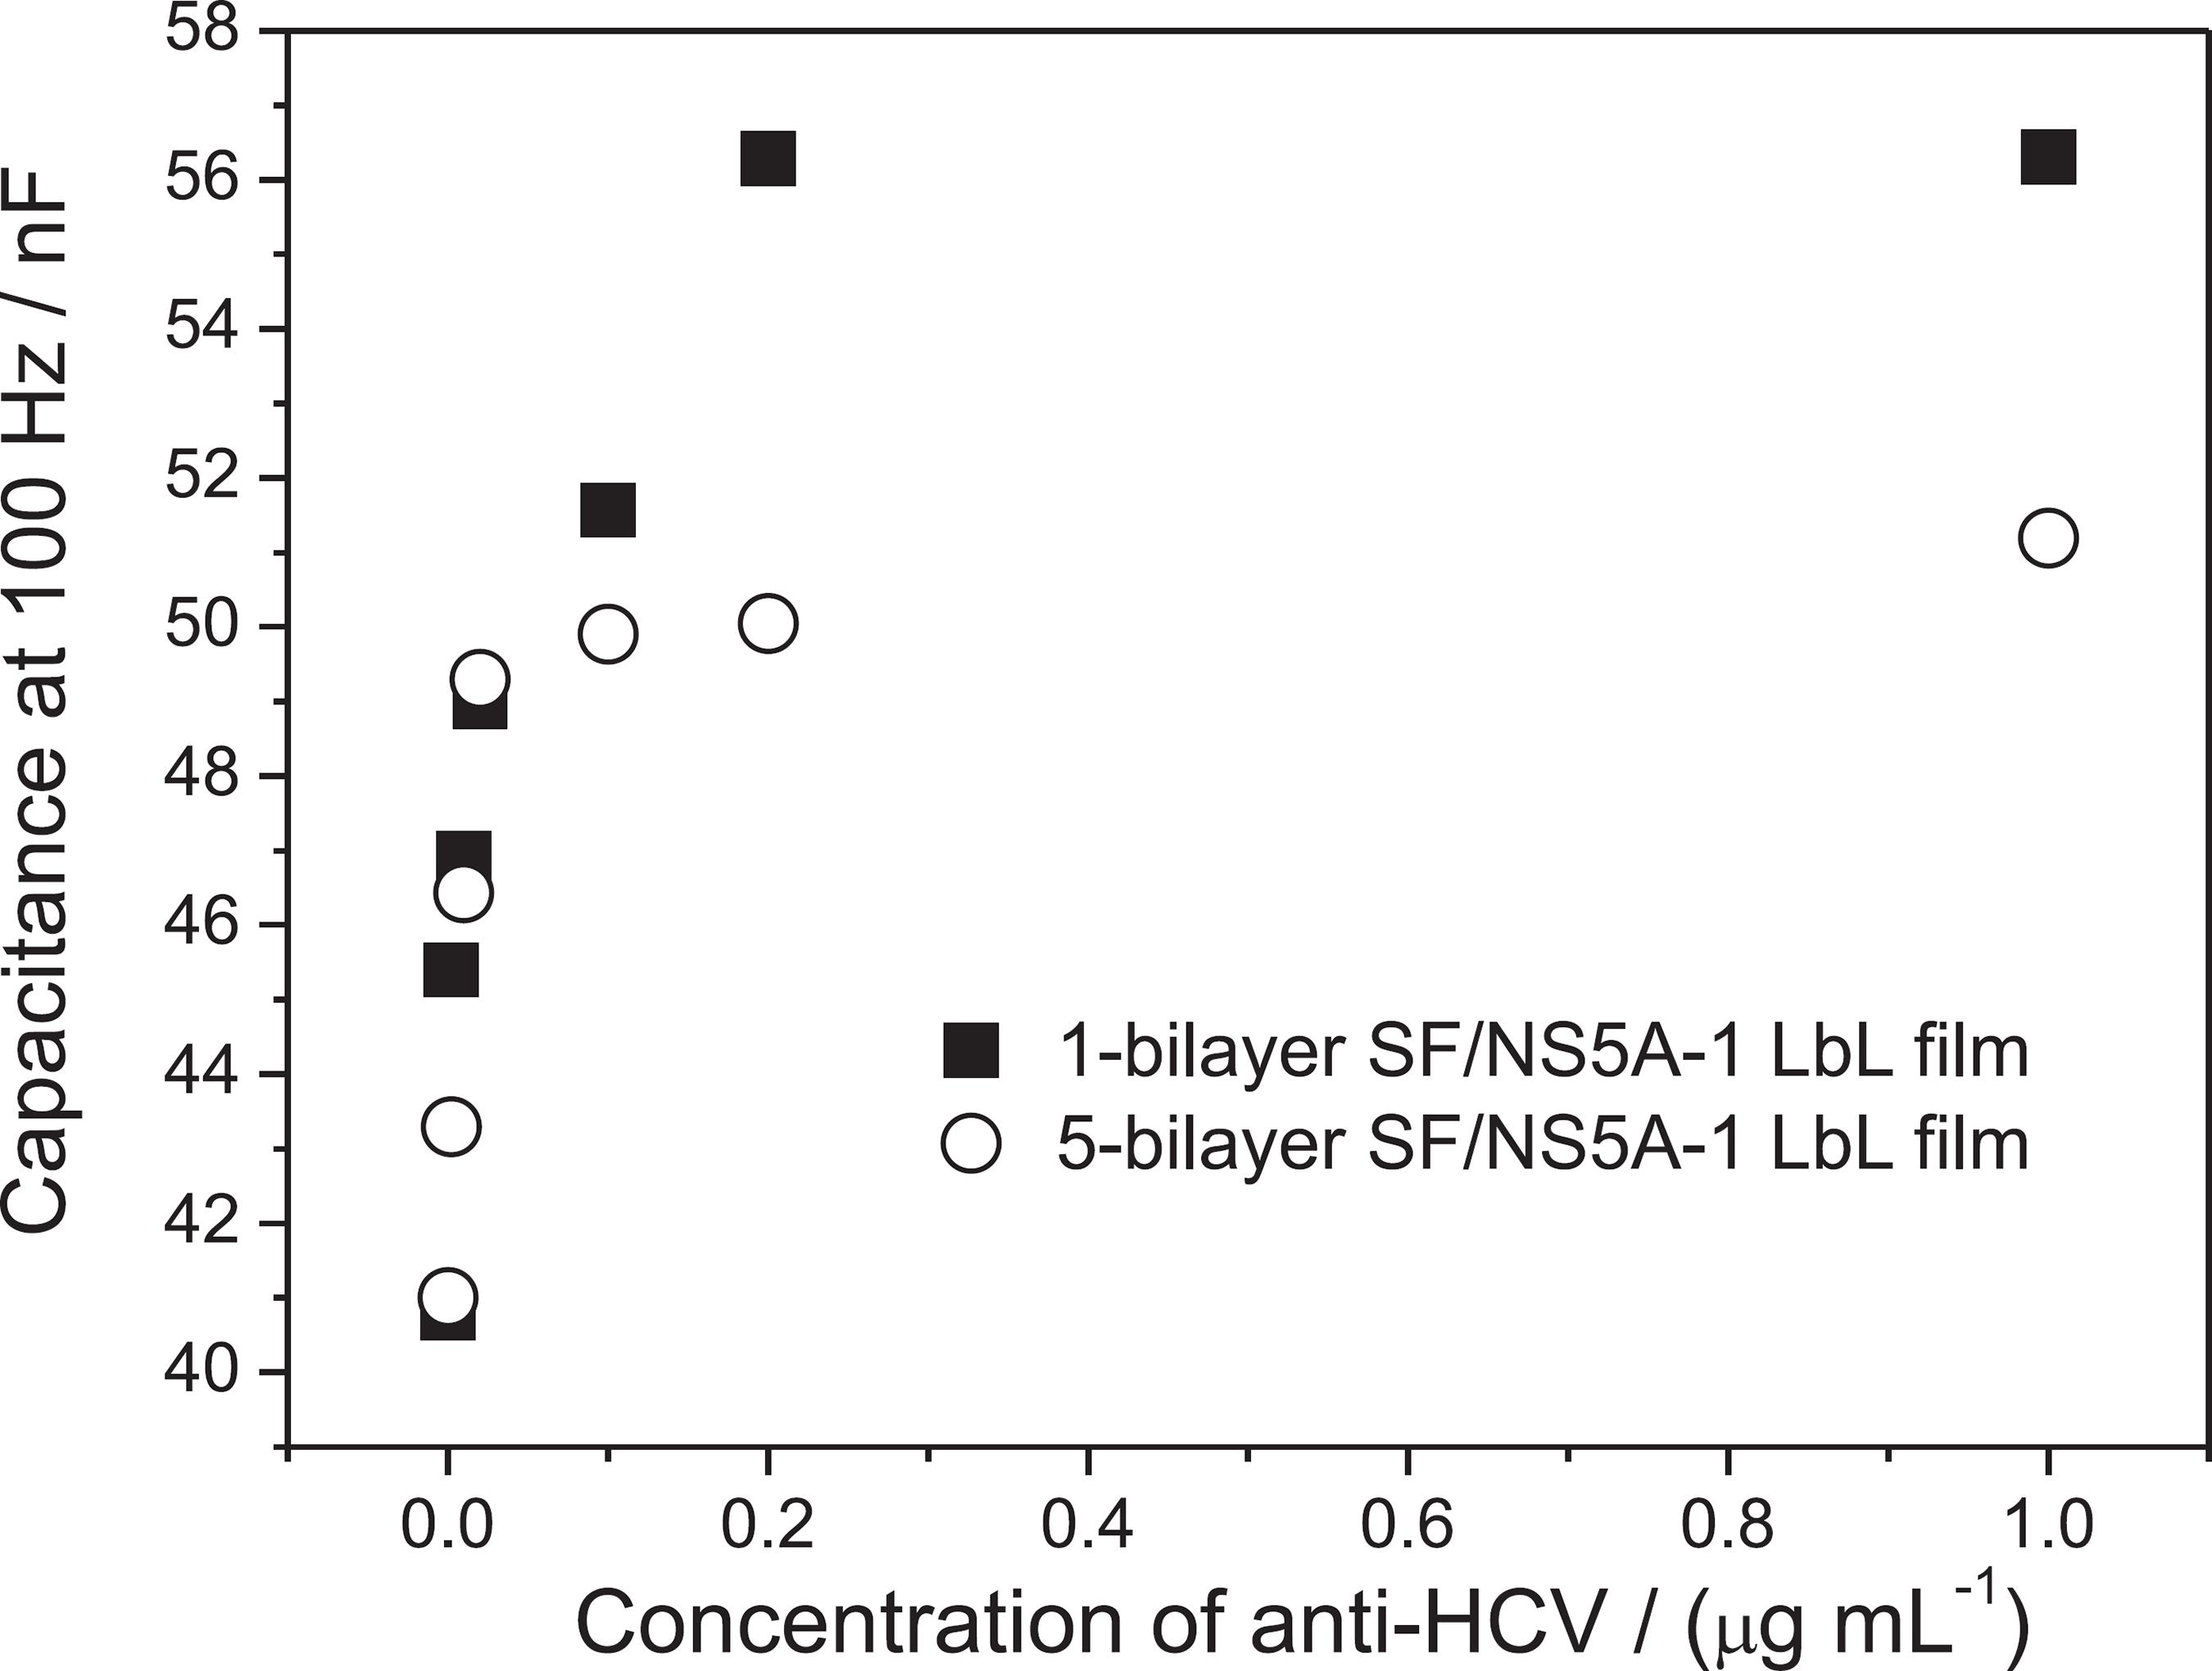
Figure 3 shows capacitance response at 100 Hz for 1 and 5-bilayer SF/NS5A-1 LbL films when the anti-HCV concentration was varied from 0 to 1 µg mL-1. Capacitance increased almost linearly in the range from 0 to 0.2 and from 0 to 0.02 µg mL-1 for 1 and 5-bilayer LbL films, respectively. Sensitivity was practically the same for these immunosensors up to 0.02 µg mL-1, but saturation appeared for 5-bilayer SF/NS5A-1 film at higher concentrations. Such saturation indicates that all sites of biorecognition were occupied while for the 1-bilayer film saturation only occurred at a much higher concentration, namely above 0.2 µg mL-1.
Analytical curves for 1- and 5-bilayer SF/NS5A-1 LbL films in the presence of different concentrations of anti-HCV.
Specificity of the SF/NS5A LbL films toward the anti-HCV antibody was investigated by carrying out measurements where solutions containing anti-HIV antibodies were added. As shown in Figure S2 (SI section), no significant changes were observed in the capacitance or dielectric loss for a solution with 1 µg mL-1 anti-HIV antibody.
A visual inspection of the data in Figure 2 does not allow one to determine whether the lowest concentrations can be distinguished from each other. We have therefore treated the impedance spectroscopy data with a multidimensional projection technique,3636 Paulovich, F. V.; Moraes, M. L.; Maki, R. M.; Ferreira, M.; Oliveira, O. N.; de Oliveira, M. C. F.; Analyst
2011, 136, 1344.,3838 Oliveira, O. N.; Pavinatto, F. J.; Constantino, C. J. L.; Paulovich, F. V.; de Oliveira, M. C. F.; Biointerphases
2012, 7, 1.
39 Minghim, R.; Paulovich, F. V.; Lopes, A. A.; Proc. SPIE
2006, 6060, 60600S.
40 Tejada, E.; Minghim, R.; Nonato, L. G.; Inf. Vis.
2003, 2, 218.-4141 Paulovich, F. V.; Maki, R. M.; de Oliveira, M. C. F.; Colhone, M. C.; Santos, F. R.; Migliaccio, V.; Ciancaglini, P.; Perez, K. R.; Stabeli, R. G.; Perinoto, A. C.; Oliveira, O. N.; Zucolotto, V.; Anal. Bioanal. Chem.
2011, 400, 1153. which maps each data instance in a multidimensional space into a graphical element on a visual (2D or 3D) space. Here the data instances represent impedance curves. With multidimensional projections, the aim is to preserve the distance from data points in the original space (i.e., the dissimilarity of the samples) in the projected space. Let xi, xj ∈ X be two capacitance curves, and δ(xi, xj) be the distance between these curves. Let also yi, yj ∈ Y be the corresponding graphical elements on the visual space, and d(yi, yj) be the distance between them. A projection technique seeks to map X into Y so that |δ(xi, xj) - d(yi, yj)| ca. 0 for all xi, xj ∈ X. Hence, the human visual ability can be used to analyze dissimilarity relationships between different samples in terms of the electrical responses.
In this paper we used the IDMAP3939 Minghim, R.; Paulovich, F. V.; Lopes, A. A.; Proc. SPIE 2006, 6060, 60600S. projection technique in the data analysis, which is precise in terms of preserving dissimilarity relationships and has already been used successfully for biosensing data.3636 Paulovich, F. V.; Moraes, M. L.; Maki, R. M.; Ferreira, M.; Oliveira, O. N.; de Oliveira, M. C. F.; Analyst 2011, 136, 1344.,3838 Oliveira, O. N.; Pavinatto, F. J.; Constantino, C. J. L.; Paulovich, F. V.; de Oliveira, M. C. F.; Biointerphases 2012, 7, 1.,4242 Moraes, M. L.; Maki, R. M.; Paulovich, F. V.; Rodrigues Filho, U. P.; de Oliveira, M. C. F.; Riul, A.; de Souza, N. C.; Ferreira, M.; Gomes, H. L.; Oliveira, O. N.; Anal. Chem. 2010, 82, 3239.,4343 Moraes, M. L.; Petri, L.; Oliveira, V.; Olivati, C. A.; de Oliveira, M. C. F.; Paulovich, F. V.; Oliveira, O. N.; Ferreira, M.; Sens. Actuators, B 2012, 166-167, 231. The IDMAP plot in Figure 4 shows that all anti-HCV concentrations can be distinguished, with a clear trend toward the left part of the plot for increasing antibody concentrations. Notably, the clusters corresponding to the highest concentrations almost coincide, probably owing to saturation in the peptide-antibody binding. One should also mention that the LbL film is affected by interacting with the anti-HCV antibody, as further confirmed with AFM images discussed below, therefore, the measurements should be taken as being of a differential nature.
Plot using the IDMAP technique for the impedance data obtained with an electrode coated with a 1-bilayer SF/NS5A-1 LbL film. Here the capacitance and dielectric loss were combined, and three data points are shown for each concentration since the measurements were taken in triplicate. No labels are assigned to the axes because what matters in this type of visualization is the relative distance among the data points projected.
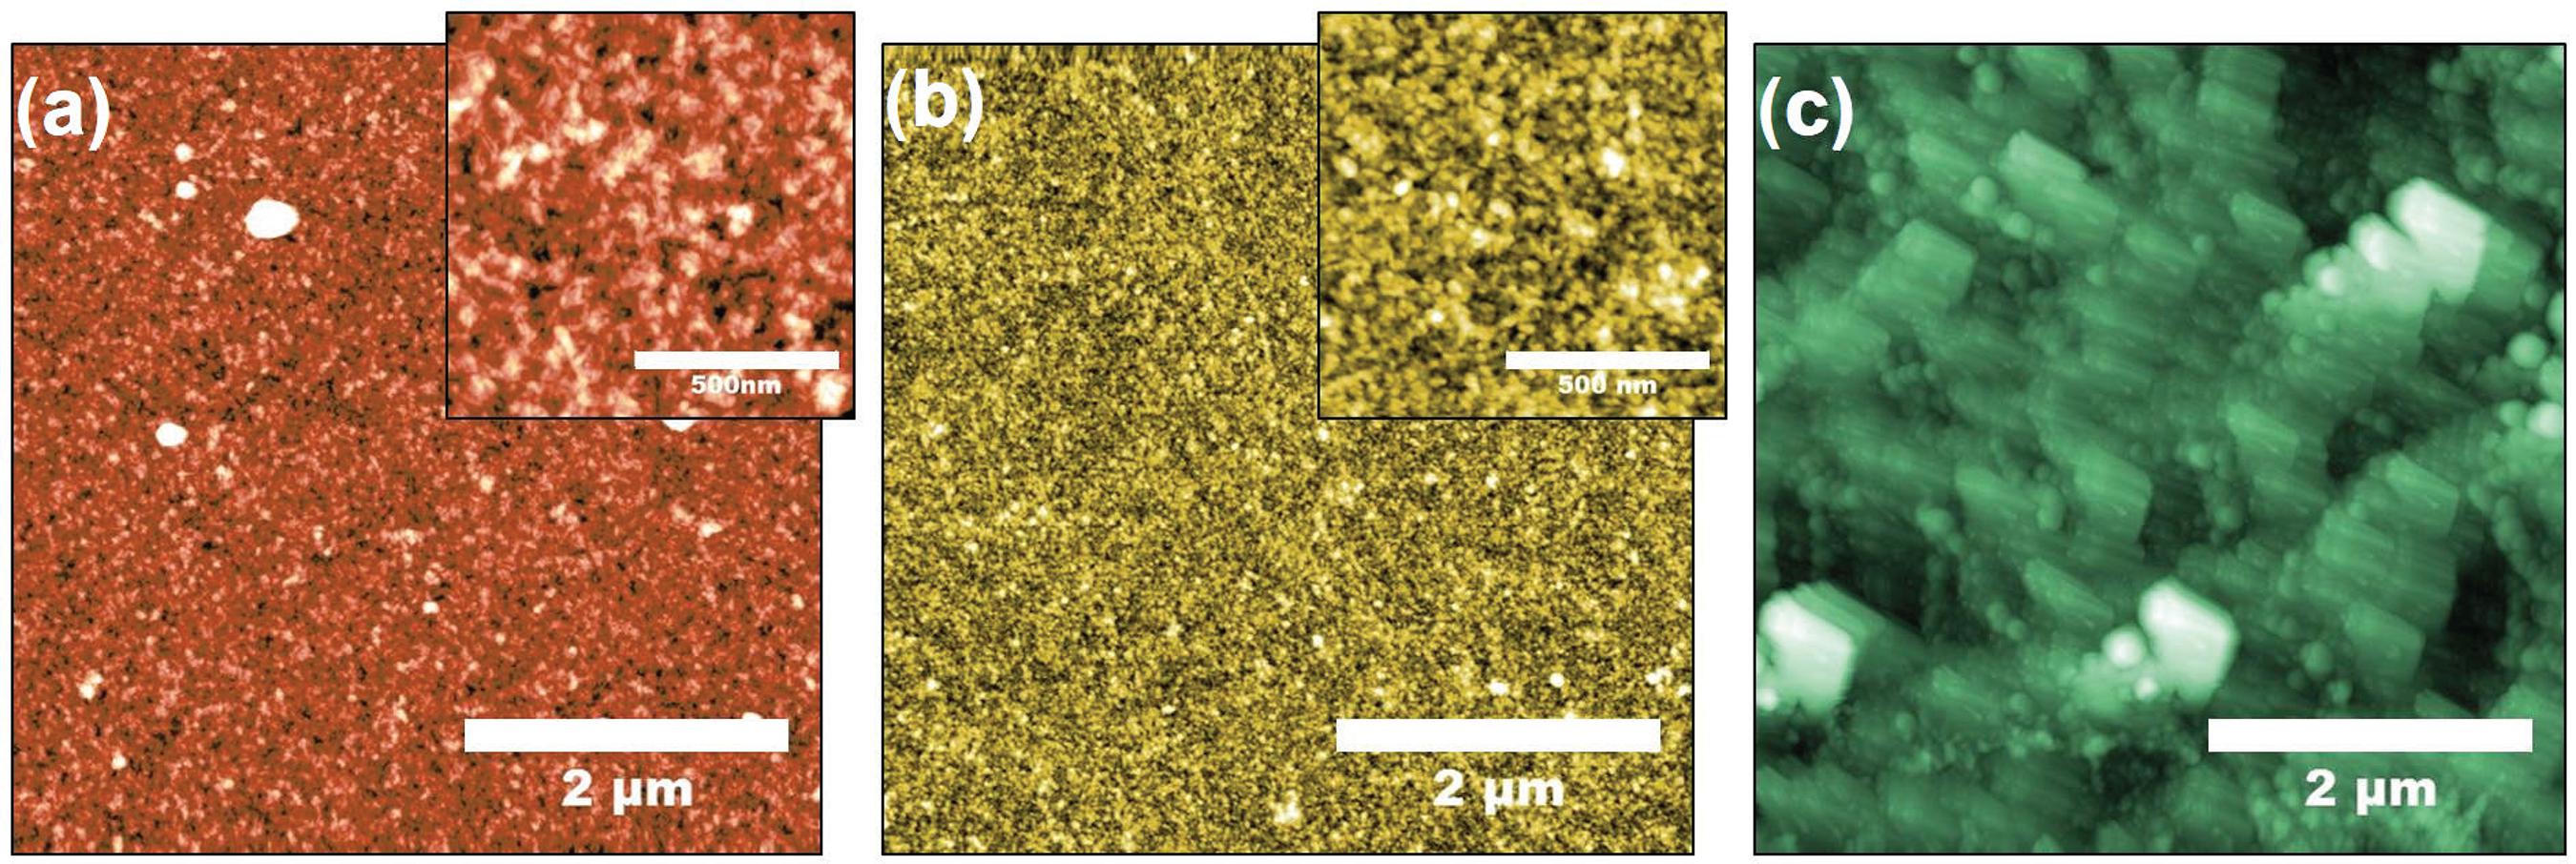
With the strong affinity between the NS5A-1 peptide and the anti-HCV antibody one may expect the high sensitivity of the sensing unit to be associated with adsorption of the antibody on the LbL film. This was indeed the case, as illustrated in a systematic study of AFM images in Figure 5 for the various steps in film fabrication and sensing. The topography of the SF layer in Figure 5a is relatively flat, with root mean square (RMS) roughness (RRMS) = 2.57 nm, and only slight changes occurred upon adsorption of the NS5A-1 layer in Figure 5b. In fact, the NS5A-1 layer covered surface irregularities, thus causing a small decrease in roughness to RRMS = 1.84 nm. In contrast, when the LbL film was exposed to an anti-HCV solution (concentration of 1 µg mL-1) a drastic change in topography was observed, with large terraces in Figure 5c and RMS roughness of 8.62 nm.
AFM topography images of interdigitated electrodes coated with (a) SF layer, (b) SF/NS5A-1 bilayer, and (c) SF/NS5A-1 in the presence of anti-HCV. The insets in (a) and (b) show a high resolution zoom of a 1 × 1 µm2 area in the respective images. The exposure to anti-HCV solutions of the electrodes coated with LbL films with 2 through 5 bilayers also led to considerable changes in film morphology and increased roughness (results not shown).
The drastic change in morphology associated with the antibody-peptide binding may explain why 1-bilayer SF/NS5A-1 yielded optimized performance in sensing anti-HCV antibodies, for such a reaction probably involved the peptides at the upper layer. Therefore, increasing the number of bilayers did not necessarily increase the number of peptides available for binding, and the sensing performance dropped with the increased film thickness. For the HIV antibody, we have not noted drastic changes in morphology for the AFM images before and after exposure, as indicated in Figure S3 (SI section).
Conclusions
Using an information visualization technique, more specifically the multidimensional projection IDMAP method, to treat the electrical impedance data obtained with a sensing unit containing an LbL film made with NS5A-1 peptide, we showed that distinct concentrations of anti-HCV antibodies can be clearly identified. Furthermore, the biosensor displayed good selectivity, as indicated with experiments employing anti-HIV antibodies. This good performance may be ascribed to the molecular recognition capability of the NS5A-1 peptide toward anti-HCV antibodies, also confirming that SF is a suitable matrix for immobilization of the peptide in LbL films. The specific interaction between NS5A-1 and anti-HCV antibodies could be also inferred from morphological changes on the LbL film caused by adsorption of the peptide. With the high sensitivity, where anti-HCV concentrations as low as 2 ng mL-1 could be detected, and specificity of the interaction, this work demonstrates the feasibility of low-cost, fast diagnosis of hepatitis C as the system for electrical measurements can be optimized to provide a response within minutes or even less if microfluidics devices are used.
Acknowledgments
This work was supported by FAPESP, CNPq and the networks nBioNet and Nanobiotec (Project 26) from CAPES (Brazil). The authors are also grateful to the microfabrication laboratory (LMF/LNNano, Brazil) for providing interdigitated electrodes (project LMF 12298).
Supplementary Information
Supplementary data (electrical impedance curves and AFM image) are available free of charge at http://jbcs.sbq.org.br as PDF file.
References
-
1Choo, Q. L.; Kuo, G.; Weiner, A. J.; Overby, L. R.; Bradley, D. W.; Houghton, M.; Science 1989, 244, 359.
-
2Alter, M. J.; World J. Gastroenterol. 2007, 13, 2436.
-
3Kazmierski, W. M.; Maynard, A.; Duan, M.; Baskaran, S.; Botyanszki, J.; Crosby, R.; Dickerson, S.; Tallant, M.; Grimes, R.; Hamatake, R.; Leivers, M.; Roberts, C. D.; Walker, J.; J. Med. Chem. 2014, 57, 2058.
-
4Radhakrishnan, R.; Suni, I. I.; Bever, C. S.; Hammock, B. D.; ACS Sustainable Chem. Eng. 2014, 2, 1649.
-
5Daniels, J. S.; Pourmand, N.; Electroanalysis 2007, 19, 1239.
-
6Widell, A.; Molnegren, V.; Pieksma, F.; Calmann, M.; Peterson, J.; Lee, S. R.; Transfus. Med. 2002, 12, 107.
-
7Ergünay, K.; Şener, B.; Alp, A.; Karakaya, J.; Hasçelik, G.; Diagn. Microbiol. Infect. Dis. 2011, 70, 486.
-
8Park, Y.; Lee, J. H.; Kim, B. S.; Kim, D. Y.; Han, K. H.; Kim, H. S.; J. Clin. Microbiol. 2010, 48, 2253.
-
9Khan, A. H.; Ghosh, S.; Pradhan, B.; Dalui, A.; Shrestha, L. K.; Acharya, S.; Ariga, K.; Bull. Chem. Soc. Jpn. 2017, 90, 627.
-
10Komiyama, M.; Yoshimoto, K.; Sisido, M.; Ariga, K.; Bull. Chem. Soc. Jpn. 2017, 90, 967.
-
11Ariga, K.; Minami, K.; Ebara, M.; Nakanishi, J.; Polym. J. 2016, 48, 371.
-
12Ariga, K.; Mater. Chem. Front. 2017, 1, 208.
-
13Ma, C.; Liang, M.; Wang, L.; Xiang, H.; Jiang, Y.; Li, Y.; Xie, G.; Biosens. Bioelectron. 2013, 47, 467.
-
14Ma, C.; Xie, G.; Zhang, W.; Liang, M.; Liu, B.; Xiang, H.; Microchim. Acta 2012, 178, 331.
-
15Moraes, M. L.; Lima, L. R.; Silva, R. R.; Cavicchioli, M.; Ribeiro, S. J. L.; Langmuir 2013, 29, 3829.
-
16Blaising, J.; Pécheur, E. I.; Biochimie 2013, 95, 96.
-
17Ghanbari, K.; Roushani, M.; Sens. Actuators, B 2018, 258, 1066.
-
18Lima, L. R.; Moraes, M. L.; Nigoghossian, K.; Peres, M. F. S.; Ribeiro, S. J. L.; J. Lumin. 2016, 170, 375.
-
19Dou, X. G.; Talekar, G.; Chang, J.; Dai, X.; Li, L.; Bonafonte, M. T.; Holloway, B.; Fields, H. A.; Khudyakov, Y. E.; J. Clin. Microbiol. 2002, 40, 61.
-
20Nogueira, G. M.; Swiston, A. J.; Beppu, M. M.; Rubner, M. F.; Langmuir 2010, 26, 8953.
-
21Cai, K.; Hu, Y.; Jandt, K. D.; J. Biomed. Mater. Res., Part A 2007, 82, 927.
-
22Xue, R.; Kang, T. F.; Lu, L. P.; Cheng, S. Y.; Appl. Surf. Sci. 2012, 258, 6040.
-
23Kundu, B.; Rajkhowa, R.; Kundu, S. C.; Wang, X.; Adv. Drug Delivery Rev. 2013, 65, 457.
-
24Qi, Y.; Wang, H.; Wei, K.; Yang, Y.; Zheng, R. Y.; Kim, I. S.; Zhang, K. Q.; Int. J. Mol. Sci. 2017, 18, 237.
-
25Zhou, C. Z.; Confalonieri, F.; Jacquet, M.; Perasso, R.; Li, Z. G.; Janin, J.; Proteins 2001, 44, 119.
-
26Ming, J.; Pan, F.; Zuo, B.; Int. J. Biol. Macromol. 2015, 75, 398.
-
27Ariga, K.; Yamauchi, Y.; Rydzek, G.; Ji, Q.; Yonamine, Y.; Wu, K. C.-W.; Hill, J. P.; Chem. Lett. 2014, 43, 36.
-
28Costa, R. R.; Mano, J. F.; Chem. Soc. Rev. 2014, 43, 3453.
-
29Decher, G.; Science 1997, 277, 1232.
-
30Ariga, K.; Lvov, Y.; Kunitake, T.; J. Am. Chem. Soc. 1997, 119, 2224.
-
31David, M.; Barsan, M. M.; Brett, C. M. A.; Florescu, M.; Sens. Actuators, B 2018, 255, 3227.
-
32Coulibaly, F. S.; Ezoulin, M. J. M.; Purohit, S. S.; Ayon, N. J.; Oyler, N. A.; Youan, B. B. C.; Mol. Pharmacol. 2017, 14, 3512.
-
33Taylor, D. M.; Macdonald, A. G.; J. Phys. D: Appl. Phys. 1987, 20, 1277.
-
34Berggren, C.; Bjarnason, B.; Johansson, G.; Electroanalysis 2001, 13, 173.
-
35Tsouti, V.; Boutopoulos, C.; Zergioti, I.; Chatzandroulis, S.; Biosens. Bioelectron. 2011, 27, 1.
-
36Paulovich, F. V.; Moraes, M. L.; Maki, R. M.; Ferreira, M.; Oliveira, O. N.; de Oliveira, M. C. F.; Analyst 2011, 136, 1344.
-
37Rockwood, D. N.; Preda, R. C.; Yucel, T.; Wang, X.; Lovett, M. L.; Kaplan, D. L.; Nat. Protoc. 2011, 6, 1612.
-
38Oliveira, O. N.; Pavinatto, F. J.; Constantino, C. J. L.; Paulovich, F. V.; de Oliveira, M. C. F.; Biointerphases 2012, 7, 1.
-
39Minghim, R.; Paulovich, F. V.; Lopes, A. A.; Proc. SPIE 2006, 6060, 60600S.
-
40Tejada, E.; Minghim, R.; Nonato, L. G.; Inf. Vis. 2003, 2, 218.
-
41Paulovich, F. V.; Maki, R. M.; de Oliveira, M. C. F.; Colhone, M. C.; Santos, F. R.; Migliaccio, V.; Ciancaglini, P.; Perez, K. R.; Stabeli, R. G.; Perinoto, A. C.; Oliveira, O. N.; Zucolotto, V.; Anal. Bioanal. Chem. 2011, 400, 1153.
-
42Moraes, M. L.; Maki, R. M.; Paulovich, F. V.; Rodrigues Filho, U. P.; de Oliveira, M. C. F.; Riul, A.; de Souza, N. C.; Ferreira, M.; Gomes, H. L.; Oliveira, O. N.; Anal. Chem. 2010, 82, 3239.
-
43Moraes, M. L.; Petri, L.; Oliveira, V.; Olivati, C. A.; de Oliveira, M. C. F.; Paulovich, F. V.; Oliveira, O. N.; Ferreira, M.; Sens. Actuators, B 2012, 166-167, 231.
Publication Dates
-
Publication in this collection
Oct 2018
History
-
Received
06 Feb 2018 -
Accepted
16 Apr 2018