ABSTRACT:
Coffee crops play an important role in Brazilian agriculture, with a high level of social and economic participation resulting from the jobs created in the supply chain and from the income obtained by producers and the revenue generated for the country from coffee bean export. In coffee plant growth, leaves have a determinant role in higher production; therefore, the leaf count per plant provides relevant information to producers for adequate crop management, such as foliar fertilizer applications. To describe count data, the Poisson model is the most commonly employed model; when count data show overdispersion, the negative binomial model has been determined to be more adequate. The objective of this study was to compare the fitness of the Poisson and negative binomial models to data on the leaf count per plant in coffee seedlings. Data were collected from an experiment with a randomized block design with 30 treatments and three replicates and four plants per plot. Data from only one treatment, in which the number of leaves was counted over time, were employed. The first count was conducted on 8 April 2016, and the other counts were performed 18, 32, 47, 62, 76, 95, 116, 133, and 153 days after the first evaluation, for a total of ten measurements. The fitness of the models was assessed based on deviance values and simulated envelopes for residuals. Results of fitness assessment indicated that the Poisson model was inadequate for describing the data due to overdispersion. The negative binomial model adequately fitted the observations and was indicated to describe the number of leaves of coffee plants. Based on the negative binomial model, the expected relative increase in the number of leaves was 0.9768% per day.
Key words:
Poisson model; negative binomial model; exponential family; generalized linear model
RESUMO:
A cultura do café desempenha papel relevante na agricultura do Brasil, com expressiva participação social e econômica tanto pelos empregos gerados na cadeia produtiva, bem como pela renda obtida pelos produtores e pelas divisas geradas para o país na exportação do grão. No crescimento das plantas de café, as folhas desempenham papel decisivo para que tenha maior produção, portanto a contagem do número de folhas por planta fornece informações importantes aos produtores para o manejo adequado da cultura como, por exemplo, a aplicação de adubações foliares. Em geral, na descrição de dados obtidos por contagem, o modelo mais utilizado é o Poisson, sendo que quando os dados apresentam superdispersão, o modelo Binomial Negativo tem se mostrado mais adequado. O objetivo deste trabalho foi comparar o ajuste dos modelos de Poisson e Binomial Negativo em dados de contagens do número de folhas por planta em mudas do cafeeiro. Os dados foram obtidos de um experimento usando o delineamento em blocos casualizados com trinta tratamentos e três repetições com quatro plantas por parcela. Foram utilizados os dados de apenas um tratamento no qual foi feita a contagem do número de folhas ao longo do tempo. A primeira avaliação foi feita em 8 de abril de 2016 e as demais aos 18, 32, 47, 62, 76, 95, 116, 133 e 153 dias após a primeira avaliação, totalizando dez medidas. A adequação dos mesmos foi verificada com base nos valores da Deviance e no envelope simulado para os resíduos. Os resultados do ajuste indicaram que o modelo Poisson foi inadequado para descrição dos dados devido a superdispersão. O modelo Binomial Negativo se ajustou adequadamente e foi indicado para descrever o número de folhas das plantas do cafeeiro. Com base no modelo Binomial Negativo o aumento relativo esperado para o número de folhas foi de 0,9768% para cada dia.
Palavras-chave:
modelo Poisson; modelo Binomial Negativo; família exponencial; modelo linear generalizado
INTRODUCTION:
Brazilian coffee production in 2017 was 45 million bags, and a 29% increase in production is estimated for 2018, with a likely record of 58 million bags (CONAB, 2018CONAB, Companhia Nacional de Abastecimento. Acompanhamento da Safra Brasileira de Café: Safra 2018 segundo levantamento, Maio/2018, 66 p. Available from:<Available from:https://www.conab.gov.br/info-agro/safras/cafe/boletim-da-safra-de-cafe/item/8496-boletim-cafe-maio-2018
>. Accessed: May 28, 2018.
https://www.conab.gov.br/info-agro/safra...
). Brazil is the largest coffee producer and exporter worldwide. In 2017, Brazil exported approximately 31 million bags, with 5.2 billion USD in revenue (CECAFÉ, 2018CECAFÉ, Conselho dos Exportadores de Café. Resumo das exportações de café, 2018. Available from : <Available from : http://www.cecafe.com.br/
>. Accessed: Jul. 16, 2018.
http://www.cecafe.com.br/...
), which is a considerable amount for the country’s agribusiness.
Given the importance of the coffee crop, farmers should maximize their knowledge about the causes and factors that contribute to improved productivity. In this context, understanding the factors that affect plant metabolism and alter coffee productivity and quality has been the focus of researchers and producers. BACHIÃO et al. (2018BACHIÃO, P. O. P. et al. Coffee seedlings grown in tubes with slow-release fertilizer. Revista Agrogeoambiental, v. 10, n. 1, 2018. Available from:<Available from:https://agrogeoambiental.ifsuldeminas.edu.br/index.php/Agrogeoambiental/article/view/1100/pdf
>. Accessed: May 18, 2018. doi: <Available from:http://dx.doi.org/10.18406/2316-1817v10n120181100
>.
https://agrogeoambiental.ifsuldeminas.ed...
) assessed the number of leaves, leaf area, shoot and root dry matter, plant height, and stem diameter of four coffee cultivars using linear and polynomial regression models as a function of different fertilizer doses and observed the adequate fitness of these models. COLODETTI et al. (2015COLODETTI, T. V.et al. Nitrogen availability modulating the growth of improved genotypes of Coffea Canephora. African Journal of Agricultural Research, v. 10, p. 3150-3156, 2015. Available from:<Available from:https://www.researchgate.net/publication/302457296_Nitrogen_availability_modulating_the_growth_of_improved_genotypes_of_Coffea_canephora
>. Accessed: May 17, 2018. doi: 10.5897/AJAR2015.9692.
https://www.researchgate.net/publication...
) compared the effects of the control treatment and a dose of fertilizer on coffee plant growth. The authors fitted the simple linear regression model to the number of leaves and plant height data as a function of age. MENEGHELLI et al. (2016MENEGHELLI, C. M. et al. Waste of drying coffee beans as a substrate alternative in coffee conilon seedlings. Coffee Science, v. 11, n. 3, p. 329-334, 2016. Available from:<Available from:http://www.coffeescience.ufla.br/index.php/Coffeescience/article/view/1086
>. Accessed: Jul. 23, 2018.
http://www.coffeescience.ufla.br/index.p...
) assessed the effect of different substrate doses on coffee seedling development and measured seedling height and root and stem and leaf dry matter. MARANA et al. (2008MARANA, J. P. et al. Seedling quality in coffee grown in containers. Ciência Rural, v. 38, n. 1, p. 39-45, 2008. Available from:<Available from:http://www.scielo.br/scielo.php?script=sci_arttext&pid=S0103-84782008000100007
>. Accessed: Jul. 23, 2018. doi: <http://dx.doi.org/10.1590/S0103-84782008000100007>.
http://www.scielo.br/scielo.php?script=s...
) compared the effect of different fertilizer doses on coffee seedling growth and fit polynomial regression models to seedling height and root and stem and leaf dry matter data as a function of the doses and obtained satisfactory fits.
According to BACHIÃO et al. (2018BACHIÃO, P. O. P. et al. Coffee seedlings grown in tubes with slow-release fertilizer. Revista Agrogeoambiental, v. 10, n. 1, 2018. Available from:<Available from:https://agrogeoambiental.ifsuldeminas.edu.br/index.php/Agrogeoambiental/article/view/1100/pdf
>. Accessed: May 18, 2018. doi: <Available from:http://dx.doi.org/10.18406/2316-1817v10n120181100
>.
https://agrogeoambiental.ifsuldeminas.ed...
), the number of leaves and leaf area are relevant factors to plant productivity, as intercepting and transforming solar radiation into chemical energy needed for plant growth. DUBBERSTEIN et al. (2017DUBBERSTEIN, D. et al. Dry matter in fruits, leaves and plagiotropic branches of grown coffee trees in the western amazon. Coffee Science, v. 12, n. 1, p. 74-81, 2017. Available from:<Available from:http://www.coffeescience.ufla.br/index.php/Coffeescience/article/view/1241/pdf_1241
>. Accessed: May 17, 2018. doi: <Available from:http://dx.doi.org/10.25186/cs.v12i1.1241
>.
http://www.coffeescience.ufla.br/index.p...
) highlighted that adequate management enables a coffee plant to attain its full potential. Thus, the success of coffee farming is directly associated with the treatment applied to a crop, and knowledge about the phenological phases of the plant, which is essential because its development is conditional on physiological and environmental factors for its management. The authors also reported that the leaf dry matter content decreases during the reproductive period of coffee plants. Macronutrient mobilization from leaves to fruits in coffee cultivars was assessed by VALARINI et al. (2005VALARINI, V.et al. Macronutrients in leaves and fruits of dwarf arabica coffee cultivars. Bragantia, v. 64, n. 4, p. 661-672, 2005. Available from:<Available from:http://www.scielo.br/pdf/%0D/brag/v64n4/a16v64n4.pdf
>. Accessed: May 15, 2018.
http://www.scielo.br/pdf/%0D/brag/v64n4/...
). In the fruit growth phase, the authors observed that the leaf macronutrient content of productive branches of the cultivars decreased and the most productive coffee plants had slightly higher macronutrient concentrations than plants with intermediate productivity.
Given the influence of leaves on coffee plant development, understanding the variation in the number of leaves in coffee plants as a function of seedling age is necessary. However, most studies employ the observed mean number of leaves as a response variable, which fails to satisfy the normality assumption and prevents the use of classical regression models, which require continuous responses. Considering this issue, an alternative is to use generalized linear models, which are useful in studies that involve count data, represented by discrete random variables (DRVs). Note that count data can be modelled for certain distributions using continuous distributions; for example, count data that follows a Poisson distribution and has a high mean can be modelled using a normal distribution. As the leaf counts of coffee seedlings may contain excess zeros, which yield low means per plot, dispersion modelling was considered, considering DRVs. Initially, a Poisson distribution was assumed, followed by a negative binomial distribution with a parameterization that involves a Poisson distribution as an alternative to overdispersion modelling. In this context, Yi (i = 1, 2, ..., n) is defined as the number of leaves observed in coffee plant seedlings. Assuming a Poisson distribution, E[Yi] = Var[Yi] = µi. However, in practice, the variance (Var[Yi]) may be higher than the mean µ, which evidences a typical situation of overdispersion. Thus, a plausible alternative is to fit the negative binomial model with a log link function, which is also employed in the Poisson model (HINDE & DEMÉTRIO, 1998HINDE, J.; DEMÉTRIO, C. G. B. Overdispersion: model and estimation. Computational Statistics and Data Analysis, v. 27, p. 151-170, 1998. Available from:<Available from:https://www.sciencedirect.com/science/article/pii/S0167947398000073
>. Accessed: Jun. 7, 2018. doi: <https://doi.org/10.1016/S0167-9473(98)00007-3>.
https://www.sciencedirect.com/science/ar...
). HESS et al. (2015HESS, A. F. et al. Application of generalized linear models to estimate height growth. Pesquisa Florestal Brasileira, v. 35, n. 84, p. 427-433, 2015. doi: 10.4336/2015.pfb.35.84.604.
https://doi.org/10.4336/2015.pfb.35.84.6...
) fitted generalized linear models when evaluating tree growth, assessed the fitness of normal, Poisson and gamma models, and observed that the gamma distribution had the best fit. ROCHA et al. (2014ROCHA, E. B. et al. Aplicação dos modelos lineares generalizados na análise do número de estômatos em coentro (Coriandrum sativum L.): estimação bayesiana utilizando INLA. Revista da Estatística UFOP, v. 3, edição especial, p. 212-216, 2014.) fitted the Poisson model to the number of stomata on the abaxial and adaxial surfaces of coriander leaves with satisfactory results. The Poisson and negative binomial models were compared by SILVA et al. (2014SILVA, A. P. C. M. et al. Aplicação dos modelos lineares generalizados na análise do número de ácaros. Revista da Estatística UFOP, v. 3, edição especial, p. 217-221, 2014.) when evaluating the number of mites on rubber tree leaves, and the negative binomial model showed the best fit due to overdispersion of the data.
In the analysis of the experimental results, when considering the coffee seedling as the sampling unit, seedling leaf counts are expected to differ. Therefore, a model that addresses this heterogeneity should be proposed, as, to the best of our knowledge, there are no studies of leaf count overdispersion, specifically in seedlings, exist; that is, researchers, that typically transform the experimental data and then apply the simple linear regression method. This procedure is not invalid; however, the use of transformation changes the original scale of the data and may hinder the interpretation of the results related to the predictions.
For this reason, the objective of this study was to fit models that address sampling data overdispersion. The Poisson and negative binomial models were compared, and the viability of their use in leaf count data of coffee seedlings was analysed.
MATERIALS AND METHODS:
The data analysed were extracted from LUZ (2017LUZ, A. L. F. Fertilizers, coverings and soil conditioners in the control of brown eye spot of coffee. 2017. 55 p. Dissertação (Mestrado em Fitopatologia) - Universidade Federal de Lavras.). The experiment was conducted at the Universidade Federal de Lavras. Seedlings of the “Mundo Novo 379-19” cultivar were planted on January 2016. The inter-row spacing was 3.6 m, and the inter-plant spacing was 0.75 m. The plot consisted of a row with six plants, in which the four central plants were considered useful, and the two plants at the ends were considered border plants. The rows between plots were also considered to be border rows.
The experimental design consisted of randomized blocks to control for possible soil heterogeneity. The analysis of variance was performed by LUZ (2017LUZ, A. L. F. Fertilizers, coverings and soil conditioners in the control of brown eye spot of coffee. 2017. 55 p. Dissertação (Mestrado em Fitopatologia) - Universidade Federal de Lavras.), who observed that the block effect was not significant. Thirty treatments that consisted of combinations of three soil covers, two fertilization levels, and five soil conditioners with three replicates and four plants per plot were employed in this study. One block with the soil covered with plastic film, which was treated with Produquímica® controlled-release fertilizer and the soil conditioner coffee hull, was evaluated in this study.
The double-sided, polyethylene-based plastic film was white on the upperside and black on the underside and was installed on the row shortly after coffee planting. The fertilizer was applied according to the manufacturer’s instructions, four days after planting, on a 5-cm-deep side pit and 10 cm from the plant. A dose of 10 L/plant of coffee hull was applied under the coffee plant crown projection after planting. The number of leaves was counted starting in April, when the seedlings were properly established and showed typical growth. The first evaluation was performed on 8 April 2016, and the other evaluations were performed 18, 32, 47, 62, 76, 95, 116, 133, and 153 days after the first evaluation; a total of ten measurements were obtained over time.
This study employed count data to describe the model, and the counts were represented by the random variable Y1, Y2, ..., Yn. For comparison purposes, the Poisson and negative binomial models with log link function were fitted, their linear predictor was given by ηi = β0 + β1xi, and xi was the covariate described by age.
Incorporating the log link function, the model and were described by
(1)
Thus, the mean number of leaves predicted for each seedling was estimated as follows (2):
(2)
When fitting the negative binomial model, the same specifications regarding the systematic component and the log link function were maintained; although, increased as shown in equation (3):
(3)
where ϕ is the dispersion parameter, which is estimated using the least squares method as a function of Pearson residuals.
Note that the generalized linear model may be fitted using different parameterizations, assuming that the distribution of response variable is represented by a negative binomial distribution. Another important issue is that the parameter ϕ is unknown; and therefore, the distribution of Yi approaches the exponential family class of distributions. Thus, a way to overcome this problem is to fit the negative binomial model considering the following assumptions:
(4)
(5)
Therefore,
and
With these specifications, the resulting joint distribution is described by
(6)
The following marginal distribution was obtained:
(7)
resulting in a negative binomial distribution, which was obtained by mixing the distributions cited in (4) and (5):
(8)
where y i=0,1,2,….. Thus, Yi ~ negative binomial (mi, f), with [Y i ] specified in (3).
After defining the models, the parameters were estimated using the reweighted least squares method, in which the parametric vector β = (β0, β1)T is estimated using an iterative process and expressed as
(9)
in which z = ( z1, z2, ..., zn)T with
is a modified dependent variable, which contemplates the variance function and the weights attributed to each observation, and wi = ui considering the canonical link function. The design matrix X and the weight matrix are given by (10):
and (10)
(HARDIN and HILBE, 2018HARDIN, J. W.; HILBE, J. M. Generalized Linear Models and Extensions. 4th ed. Stata Press, 2018, 598p.).
The fitness of the models was assessed using deviance and the simulated envelopes method for residuals (HINDE & DEMÉTRIO, 1998HINDE, J.; DEMÉTRIO, C. G. B. Overdispersion: model and estimation. Computational Statistics and Data Analysis, v. 27, p. 151-170, 1998. Available from:<Available from:https://www.sciencedirect.com/science/article/pii/S0167947398000073
>. Accessed: Jun. 7, 2018. doi: <https://doi.org/10.1016/S0167-9473(98)00007-3>.
https://www.sciencedirect.com/science/ar...
; LISKA et al., 2015LISKA, G. R. et al. Selecting a binomial regression model on the predation rate of Euseius concordis (Chant, 1959). Coffee Science, v. 10, p. 113-121, 2015. Available from:<Available from:http://www.coffeescience.ufla.br/index.php/Coffeescience/article/view/786
>. Accessed: Jun. 15, 2018. doi: <http://dx.doi.org/10.25186/cs.v10i1.786>.
http://www.coffeescience.ufla.br/index.p...
). Tests were performed using the statistical software R (R DEVELOPMENT CORE TEAM, 2017R DEVELOPMENT CORE TEAM. R: a language and environment for statistical computing.R Foudantion for Statistical Computing, 2017.). The fitness of the negative binomial model was assessed using the MASS package and the simulated envelopes for residuals using the hnp package, which adopts a significance level of α = 1% in all statistical tests.
In the diagnostic analysis, the elements hi of the main diagonal of the matrix were assessed to detect the presence of leverage points. This matrix is expressed as
Influential observations were assessed using Cook’s distance and expressed as
where β (i) are estimates of the parameter without the ith observation. Large values of hi or Di indicate that the ith observation is a leverage or influential, respectively. The adequacy of the link function was assessed using the zi plot, as specified in (9) versus ηi, where a linear trend indicates that the link function is adequate (FARAWAY, 2016FARAWAY, J. J. Extending the linear model with R: Generalized Linear, Mixed Effects and Nonparametric Regression Models. 2nd ed.Chapman and Hall/CRC, 2016, 413p.).
RESULTS AND DISCUSSION:
The estimates of the parameters of the Poisson and negative binomial models are outlined in table 1. Results showed that the parameter associated with seedling age (β1) was significant in both fitted models (Table 1), which suggesteds a strong effect of age on the predictive power of both models.
Estimated model parameters, standard error, z value, and P-value of the fit of the Poisson and negative binomial models to the number of leaves of coffee seedlings as a function of age.
The results outlined in table 2 shows devianceestimates for both models. The fit of the Poisson model (P-value= <0.0001) to leaf counts of coffee seedlings is not acceptable and presents evidence of data overdispersion. Maintaining this characteristic, the fit of the negative binomial model is confirmed by the non-significant deviance (P-value = 0.4940) and corroborated by the simulated envelopes obtained for each model (Figures 1 and 2).
Degrees of freedom (DF), deviance , and P-value of the Poisson and negative binomial models for the number of leaves of coffee seedlings as a function of age.


The results showed that the assumption of a Poisson response (Figure 1) for the number of leaves in coffee seedlings over time is not confirmed, and the model shows an unsatisfactory fit. The simulated envelopes indicated that the residuals show a systematic trend as they are above the mean, and 65% of the points lie outside the confidence limits, which confirms the data overdispersion.
The simulated envelopes of the negative binomial distribution (Figure 2) showed that the residuals are distributed around the mean and inside the confidence limits; and therefore, the results confirm the good fit of the model. As the data showed overdispersion, the negative binomial distribution adequately described the number of leaves in coffee seedlings, whose estimates are presented in table 1. A practical interpretation of the estimates of the parameters of the negative binomial model (Table 1) is provided as follows: the expected mean number of leaves was expressed as µi = exp(2.012354+ 0.009721xi) and exp(β1) = exp(0.009721) = 1.009768; therefore, 0.9768% is the expected relative increase in the number of leaves per day. Similar results were obtained by SILVA et al., (2014SILVA, A. P. C. M. et al. Aplicação dos modelos lineares generalizados na análise do número de ácaros. Revista da Estatística UFOP, v. 3, edição especial, p. 217-221, 2014.), who assessed the number of mites in rubber tree leaves and observed the occurrence of overdispersion, which concludes that the negative binomial model adequately described the data.
Based on the negative binomial model, results illustrated in figure 3 express the relationship between the observed leaf counts and predicted leaf counts in coffee seedlings as a function of age, which show a slow increase in seedlings by the number of leaves until 100 days after the first evaluation, followed by a sharper increase. Figure 3 also shows that the model overestimated the prediction at 153 days after the first evaluation; although, the negative binomial model adequately describes the number of leaves in coffee seedlings.

Fit of the negative binomial model to the number of leaves of coffee seedlings as a function of age.
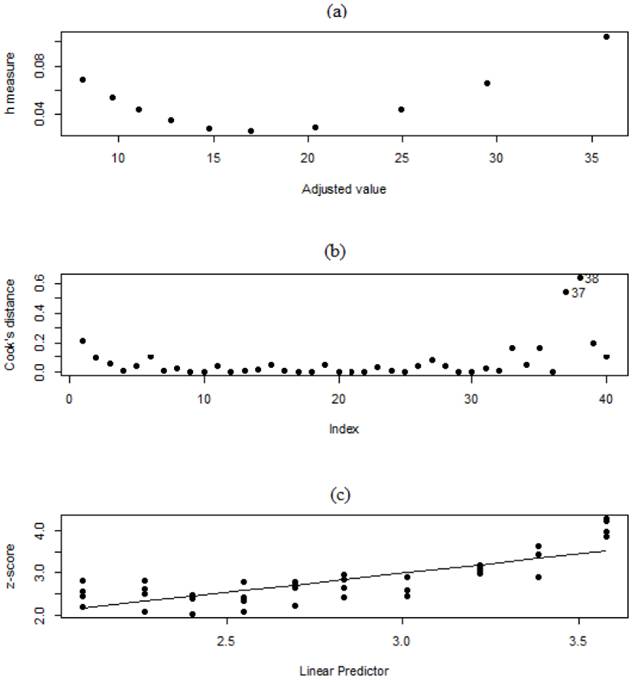
The results illustrated in figure 4(a) showed that only one observation - labelled (37) - is considered to be a leverage point, whose effect increases the uncertainty of . The observation that is identified is considered to be an outlier as it is distinct from other observations. As only one observation was identified as an outlier and the standard errors of the estimates of the parameters are lower than the estimate (Table 1), this observation was retained in the model. However, in a study characterized by the use of tubes to produce coffee seedlings (Coffea arabica L.), POZZA et al., (2007POZZA, A. A. A. et al. Effects of substrate type and supplementary fertilization on vegetative growth, mineral nutrition, production costs, and brown eye spot of coffee seedlings in stiff plastic containers. Ciência e Agrotecnologia, v. 31, n. 3, p. 685-692, 2007. doi: <http://dx.doi.org/10.1590/S1413-70542007000300013>.
http://dx.doi.org/10.1590/S1413-70542007...
) stated that the level of fertilization affected plant growth, specifically plant height, and favoured diseases such as coffee brown eye spot, which is the main defoliation disease.

Diagnostic plot of the negative binomial model, (a) h measure x adjusted value, (b) Cook’s distance, and (c) Z-score x linear predictor.
Results shown in Figure 4(b) identified two influential observations, and it is important to note that the cause of this effect is not explained by this measure. This is because External causes cited by MALAVOLTA et al., (1997MALAVOLTA, E. et al. Avaliação do estado nitricional das plantas: princípios e aplicações. 2 ed. Piracicaba: POTAFOS, 1997, 319p.), and SANTINATO (2014SANTINATO, F. et al. Doses of phosphorus associated with nitrogen on development of coffee seedlings. Coffee Science, v. 9, n. 3, p. 419-426, 2014. Available from: <Available from: https://www.researchgate.net/publication/289944479_Doses_of_phosphorus_associated_with_nitrogen_on_development_of_coffee_seedlings
>. Accessed: Sept. 10, 2018.
https://www.researchgate.net/publication...
), who stated that variations in the supply of a specific nutrient present in the soil or fertilizer affect a plant’s mineral reserves and metabolic activity, may render these observations influential. However, in this context, predictions for these observations should be considered with caution.
The linear relationship between the linear predictor and the modified dependent variable (z) shown in Figure 4(c) indicates that the specification of the systematic component is correct; that is, quadratic or interaction terms do not need to be incorporated. In adverse situations, in which the functional relationship showeds the use of nonlinear functions between the response variable and the independent variables, the model should be implemented using generalized additive models (GAMs) or a generalized additive model for location, scale, and shape (GAMLSS). This result, which was obtained with the negative binomial model, can be adapted to calculate the coffee seedling quality and growth indices proposed by MARANA et al. (2008MARANA, J. P. et al. Seedling quality in coffee grown in containers. Ciência Rural, v. 38, n. 1, p. 39-45, 2008. Available from:<Available from:http://www.scielo.br/scielo.php?script=sci_arttext&pid=S0103-84782008000100007
>. Accessed: Jul. 23, 2018. doi: <http://dx.doi.org/10.1590/S0103-84782008000100007>.
http://www.scielo.br/scielo.php?script=s...
) as an alternative to normal linear models specified with quadratic terms, which renders the model more parsimonious.
CONCLUSION:
The fit of the Poisson model to leaf counts of coffee seedlings was inadequate due to data overdispersion. Due to this characteristic, the negative binomial model adequately described the data.Considering the negative binomial model with the log link function, the expected relative increase in the number of leaves per day is 0.9768%.The residuals test provided by the negative binomial model can be a complementary analysis of the study and assessment of leaf counts in coffee seedlings.
ACKNOWLEDGEMENTS
The authors are grateful to Conselho Nacional de Desenvolvimento Científico e Tecnológico (CNPq), process CNPq 304.305/2015-4, for the support in this research, and was financed in part by the Coordenação de Aperfeiçoamento de Pessoal de Nível Superior (CAPES), Brasil - Finance code 001.
REFERENCES
- BACHIÃO, P. O. P. et al. Coffee seedlings grown in tubes with slow-release fertilizer. Revista Agrogeoambiental, v. 10, n. 1, 2018. Available from:<Available from:https://agrogeoambiental.ifsuldeminas.edu.br/index.php/Agrogeoambiental/article/view/1100/pdf >. Accessed: May 18, 2018. doi: <Available from:http://dx.doi.org/10.18406/2316-1817v10n120181100 >.
» https://agrogeoambiental.ifsuldeminas.edu.br/index.php/Agrogeoambiental/article/view/1100/pdf» http://dx.doi.org/10.18406/2316-1817v10n120181100 - CECAFÉ, Conselho dos Exportadores de Café. Resumo das exportações de café, 2018. Available from : <Available from : http://www.cecafe.com.br/ >. Accessed: Jul. 16, 2018.
» http://www.cecafe.com.br/ - COLODETTI, T. V.et al. Nitrogen availability modulating the growth of improved genotypes of Coffea Canephora. African Journal of Agricultural Research, v. 10, p. 3150-3156, 2015. Available from:<Available from:https://www.researchgate.net/publication/302457296_Nitrogen_availability_modulating_the_growth_of_improved_genotypes_of_Coffea_canephora >. Accessed: May 17, 2018. doi: 10.5897/AJAR2015.9692.
» https://doi.org/10.5897/AJAR2015.9692.» https://www.researchgate.net/publication/302457296_Nitrogen_availability_modulating_the_growth_of_improved_genotypes_of_Coffea_canephora - CONAB, Companhia Nacional de Abastecimento. Acompanhamento da Safra Brasileira de Café: Safra 2018 segundo levantamento, Maio/2018, 66 p. Available from:<Available from:https://www.conab.gov.br/info-agro/safras/cafe/boletim-da-safra-de-cafe/item/8496-boletim-cafe-maio-2018 >. Accessed: May 28, 2018.
» https://www.conab.gov.br/info-agro/safras/cafe/boletim-da-safra-de-cafe/item/8496-boletim-cafe-maio-2018 - DUBBERSTEIN, D. et al. Dry matter in fruits, leaves and plagiotropic branches of grown coffee trees in the western amazon. Coffee Science, v. 12, n. 1, p. 74-81, 2017. Available from:<Available from:http://www.coffeescience.ufla.br/index.php/Coffeescience/article/view/1241/pdf_1241 >. Accessed: May 17, 2018. doi: <Available from:http://dx.doi.org/10.25186/cs.v12i1.1241 >.
» http://www.coffeescience.ufla.br/index.php/Coffeescience/article/view/1241/pdf_1241» http://dx.doi.org/10.25186/cs.v12i1.1241 - FARAWAY, J. J. Extending the linear model with R: Generalized Linear, Mixed Effects and Nonparametric Regression Models. 2nd ed.Chapman and Hall/CRC, 2016, 413p.
- HARDIN, J. W.; HILBE, J. M. Generalized Linear Models and Extensions. 4th ed. Stata Press, 2018, 598p.
- HESS, A. F. et al. Application of generalized linear models to estimate height growth. Pesquisa Florestal Brasileira, v. 35, n. 84, p. 427-433, 2015. doi: 10.4336/2015.pfb.35.84.604.
» https://doi.org/10.4336/2015.pfb.35.84.604 - HINDE, J.; DEMÉTRIO, C. G. B. Overdispersion: model and estimation. Computational Statistics and Data Analysis, v. 27, p. 151-170, 1998. Available from:<Available from:https://www.sciencedirect.com/science/article/pii/S0167947398000073 >. Accessed: Jun. 7, 2018. doi: <https://doi.org/10.1016/S0167-9473(98)00007-3>.
» https://doi.org/https://doi.org/10.1016/S0167-9473(98)00007-3» https://www.sciencedirect.com/science/article/pii/S0167947398000073 - LISKA, G. R. et al. Selecting a binomial regression model on the predation rate of Euseius concordis (Chant, 1959). Coffee Science, v. 10, p. 113-121, 2015. Available from:<Available from:http://www.coffeescience.ufla.br/index.php/Coffeescience/article/view/786 >. Accessed: Jun. 15, 2018. doi: <http://dx.doi.org/10.25186/cs.v10i1.786>.
» https://doi.org/http://dx.doi.org/10.25186/cs.v10i1.786» http://www.coffeescience.ufla.br/index.php/Coffeescience/article/view/786 - LUZ, A. L. F. Fertilizers, coverings and soil conditioners in the control of brown eye spot of coffee. 2017. 55 p. Dissertação (Mestrado em Fitopatologia) - Universidade Federal de Lavras.
- MALAVOLTA, E. et al. Avaliação do estado nitricional das plantas: princípios e aplicações. 2 ed. Piracicaba: POTAFOS, 1997, 319p.
- MARANA, J. P. et al. Seedling quality in coffee grown in containers. Ciência Rural, v. 38, n. 1, p. 39-45, 2008. Available from:<Available from:http://www.scielo.br/scielo.php?script=sci_arttext&pid=S0103-84782008000100007 >. Accessed: Jul. 23, 2018. doi: <http://dx.doi.org/10.1590/S0103-84782008000100007>.
» https://doi.org/http://dx.doi.org/10.1590/S0103-84782008000100007» http://www.scielo.br/scielo.php?script=sci_arttext&pid=S0103-84782008000100007 - MENEGHELLI, C. M. et al. Waste of drying coffee beans as a substrate alternative in coffee conilon seedlings. Coffee Science, v. 11, n. 3, p. 329-334, 2016. Available from:<Available from:http://www.coffeescience.ufla.br/index.php/Coffeescience/article/view/1086 >. Accessed: Jul. 23, 2018.
» http://www.coffeescience.ufla.br/index.php/Coffeescience/article/view/1086 - POZZA, A. A. A. et al. Effects of substrate type and supplementary fertilization on vegetative growth, mineral nutrition, production costs, and brown eye spot of coffee seedlings in stiff plastic containers. Ciência e Agrotecnologia, v. 31, n. 3, p. 685-692, 2007. doi: <http://dx.doi.org/10.1590/S1413-70542007000300013>.
» http://dx.doi.org/10.1590/S1413-70542007000300013 - R DEVELOPMENT CORE TEAM. R: a language and environment for statistical computing.R Foudantion for Statistical Computing, 2017.
- ROCHA, E. B. et al. Aplicação dos modelos lineares generalizados na análise do número de estômatos em coentro (Coriandrum sativum L.): estimação bayesiana utilizando INLA. Revista da Estatística UFOP, v. 3, edição especial, p. 212-216, 2014.
- SANTINATO, F. et al. Doses of phosphorus associated with nitrogen on development of coffee seedlings. Coffee Science, v. 9, n. 3, p. 419-426, 2014. Available from: <Available from: https://www.researchgate.net/publication/289944479_Doses_of_phosphorus_associated_with_nitrogen_on_development_of_coffee_seedlings >. Accessed: Sept. 10, 2018.
» https://www.researchgate.net/publication/289944479_Doses_of_phosphorus_associated_with_nitrogen_on_development_of_coffee_seedlings - SILVA, A. P. C. M. et al. Aplicação dos modelos lineares generalizados na análise do número de ácaros. Revista da Estatística UFOP, v. 3, edição especial, p. 217-221, 2014.
- VALARINI, V.et al. Macronutrients in leaves and fruits of dwarf arabica coffee cultivars. Bragantia, v. 64, n. 4, p. 661-672, 2005. Available from:<Available from:http://www.scielo.br/pdf/%0D/brag/v64n4/a16v64n4.pdf >. Accessed: May 15, 2018.
» http://www.scielo.br/pdf/%0D/brag/v64n4/a16v64n4.pdf
-
CR-2018-0786.R1
Publication Dates
-
Publication in this collection
2019
History
-
Received
26 Sept 2018 -
Accepted
20 Feb 2019 -
Reviewed
14 Mar 2019