Abstracts
Surface roughness can be influenced by type and intensity of soil tillage among other factors. In tilled soils microrelief may decay considerably as rain progresses. Geostatistics provides some tools that may be useful to study the dynamics of soil surface variability. The objective of this study was to show how it is possible to apply geostatistics to analyze soil microrelief variability. Data were taken at an Oxisol over six tillage treatments, namely, disk harrow, disk plow, chisel plow, disk harrow + disk level, disk plow + disk level and chisel plow + disk level. Measurements were made initially just after tillage and subsequently after cumulative natural rainfall events. Duplicated measurements were taken in each one of the treatments and dates of samplings, yielding a total of 48 experimental surfaces. A pin microrelief meter was used for the surface roughness measurements. The plot area was 1.35 × 1.35 m and the sample spacing was 25 mm, yielding a total of 3,025 data points per measurement. Before geostatistical analysis, trend was removed from the experimental data by two methods for comparison. Models were fitted to the semivariograms of each surface and the model parameters were analyzed. The trend removing method affected the geostatistical results. The geostatistical parameter dependence ratio showed that spatial dependence improved for most of the surfaces as the amount of cumulative rainfall increased.
soil surface roughness; detrending procedures; roughness indices; surface configuration
A rugosidade da superfície pode ser influenciada pelo tipo e pela intensidade do preparo do solo, entre outros fatores. Em solos preparados o microrrelevo é aplanado consideravelmente com o acúmulo da chuva. A Geoestatística promove algumas ferramentas que podem ser úteis no estudo da dinâmica da variabilidade da superfície do solo. O objetivo desse estudo foi verificar se é possível aplicar geoestatística na análise da variação do microrrelevo do solo. Os resultados foram obtidos num Latossolo sob seis tratamentos de preparo do solo: grade de discos, arado de discos, escarificador, grade de discos + grade niveladora, arado de discos + grade niveladora e escarificador + grade niveladora. As medidas foram feitas logo após o preparo do solo e subseqüentemente após cumulativos eventos de chuva natural. Medições duplicadas foram feitas em cada tratamento para cada data, produzindo um total de 48 superfícies. Um rugosímetro de agulhas foi utilizado para as medidas da rugosidade da superfície. A área de cada parcela era 1,35 m por 1,35 m e as medidas espaçadas de 25 mm, produzindo um total de 3025 pontos por parcela. Antes da análise geoestatística, a tendência foi removida dos dados experimentais por dois diferentes métodos. Foram ajustados modelos aos semivariogramas de cada superfície, e os parâmetros desses modelos foram analisados. O método usado para remover a tendência influenciou os resultados geoestatísticos. O parâmetro geoestatístico razão de dependência mostrou que a dependência espacial aumentou para a maioria das superfícies com o aumento da precipitação pluvial acumulada.
rugosidade da superfície do solo; método para retirada de tendência; índices de rugosidade; configuração da superfície
SOILS AND PLANT NUTRITION
Geostatistical analysis of microrelief of an oxisol as a function of tillage and cumulative rainfall
Análise geoestatística do microrrelevo de um Latossolo em função do preparo do solo e da precipitação acumulada
Eva Vidal VázquezI; Sidney Rosa VieiraII, * * Corresponding author < sidney@iac.sp.gov.br> ; Isabella Clerici De MariaII; Antonio Paz GonzálezIII
IUniversidade de Santiago de Compostela/Escuela Politécnica Superior, Campus Universitario - 27002 Lugo, Spain
IIIAC, Centro de Solos e Recursos Ambientais, Av. Barão de Itapura, 1481 - 13020-902 - Campinas, SP - Brasil
IIIUniversidade da Coruña/Facultad de Ciências, Campus de A Zapateira - 15071 A Coruña, Spain
ABSTRACT
Surface roughness can be influenced by type and intensity of soil tillage among other factors. In tilled soils microrelief may decay considerably as rain progresses. Geostatistics provides some tools that may be useful to study the dynamics of soil surface variability. The objective of this study was to show how it is possible to apply geostatistics to analyze soil microrelief variability. Data were taken at an Oxisol over six tillage treatments, namely, disk harrow, disk plow, chisel plow, disk harrow + disk level, disk plow + disk level and chisel plow + disk level. Measurements were made initially just after tillage and subsequently after cumulative natural rainfall events. Duplicated measurements were taken in each one of the treatments and dates of samplings, yielding a total of 48 experimental surfaces. A pin microrelief meter was used for the surface roughness measurements. The plot area was 1.35 × 1.35 m and the sample spacing was 25 mm, yielding a total of 3,025 data points per measurement. Before geostatistical analysis, trend was removed from the experimental data by two methods for comparison. Models were fitted to the semivariograms of each surface and the model parameters were analyzed. The trend removing method affected the geostatistical results. The geostatistical parameter dependence ratio showed that spatial dependence improved for most of the surfaces as the amount of cumulative rainfall increased.
Key words: soil surface roughness, detrending procedures, roughness indices, surface configuration
RESUMO
A rugosidade da superfície pode ser influenciada pelo tipo e pela intensidade do preparo do solo, entre outros fatores. Em solos preparados o microrrelevo é aplanado consideravelmente com o acúmulo da chuva. A Geoestatística promove algumas ferramentas que podem ser úteis no estudo da dinâmica da variabilidade da superfície do solo. O objetivo desse estudo foi verificar se é possível aplicar geoestatística na análise da variação do microrrelevo do solo. Os resultados foram obtidos num Latossolo sob seis tratamentos de preparo do solo: grade de discos, arado de discos, escarificador, grade de discos + grade niveladora, arado de discos + grade niveladora e escarificador + grade niveladora. As medidas foram feitas logo após o preparo do solo e subseqüentemente após cumulativos eventos de chuva natural. Medições duplicadas foram feitas em cada tratamento para cada data, produzindo um total de 48 superfícies. Um rugosímetro de agulhas foi utilizado para as medidas da rugosidade da superfície. A área de cada parcela era 1,35 m por 1,35 m e as medidas espaçadas de 25 mm, produzindo um total de 3025 pontos por parcela. Antes da análise geoestatística, a tendência foi removida dos dados experimentais por dois diferentes métodos. Foram ajustados modelos aos semivariogramas de cada superfície, e os parâmetros desses modelos foram analisados. O método usado para remover a tendência influenciou os resultados geoestatísticos. O parâmetro geoestatístico razão de dependência mostrou que a dependência espacial aumentou para a maioria das superfícies com o aumento da precipitação pluvial acumulada.
Palavras-chave: rugosidade da superfície do solo, método para retirada de tendência, índices de rugosidade, configuração da superfície
INTRODUCTION
Because the soil surface is the region that receives many actions such as rainfall, tillage, traffic, management systems etc., the surface conditions may be rapidly modified by any of these actions. The surface microrelief has been often related with water erosion, mainly because the soil depressions constitute a very efficient way to temporarily store water and thus provide more opportunity for infiltration (Miranda, 2000). The type of implement used to till the soil has unique characteristics on the soil surface roughness that may also affect hydrological processes. Soil microrelief has been defined as a set of topographical characteristics of an area of interest (Huang, 1998), at a millimetric or centimetric scale (Huang & Bradford, 1992). Statistical indices for surface roughness only represent the vertical variability of the measured heights.
Random roughness (RR), the standard deviation of point elevation data sets, is the most traditional one (Allmaras et al., 1966). Currence & Lovely (1970) presented five ways of calculating surface roughness indices, according to the used trend removal method, and they concluded that the best ones were those more efficient in correcting both the slope and the periodical variability due to the tillage implement, with minimal disturbance on the surface characteristics. The removal of both the slope and the periodical variability is also a required condition for adequate geostatistical analysis. Therefore, whatever may be the method used for the trend removal, at least the intrinsic hypothesis of geostatistics must be validated before further applications are used.
Geostatistical analysis of spatial variability has been nowadays extensively used and documented at different scales (Vieira et al., 1983; Paz González et al., 2000), including soil surface microrelief plots characterized by point elevation measurements (Miranda, 2000; Vidal Vázquez, 2002). Through the analysis of the parameters of the semivariogram models fitted to different data sets it is possible to assess the similarity between them or to compare their variability (Vieira et al., 1983).
The objective of this study was to investigate the adequateness of geostatistical methods, for the understanding of surface roughness evolution as a function of cumulative rainfall.
MATERIAL AND METHODS
The field measurements were obtained at Campinas, State of São Paulo, Brazil, (22º53' S, 47º04' W, at an average altitude of 600 m asl). The soil was a clayey Rhodic Eutrudox with an ochric epipedon (Soil Survey Staff, 1998) or a Latossolo Vermelho Eutroférrico tipico with a moderate A horizon (Embrapa, 2006), according to the Brazilian Soil Classification System.
The surface roughness measurements were made between October and November 2000, at a 5.1% slope site. A total of 48 measurements were made corresponding to six tillage treatments over four dates, the initial stage just after tillage and after each one of three cumulative rainfalls and with two replications (measurements) per treatment. The three primary tillage treatments studied were disk plow (DP), heavy disk harrow (DH) and chisel plow (CP), with cumulative natural rains of 0, 24.4, 113.3 (for disk plow), 120.9 (for heavy disk harrow and chisel plow) and 232.8 mm. Besides these, disk plow plus leveling disk (DP + L), disk harrow plus leveling disk (DH + L), chisel plow plus leveling disk (CP + L) with cumulative natural rains of 0, 24.4, 232.8 and 294.6 mm were also assessed. Table 1 summarizes the tillage treatments and cumulative rainfall for all surfaces measured. Even though two sets of measurements were taken for each combination of tillage treatment and cumulative rainfall, they are not considered in this analysis as replications, but rather, as two independent measurements for each situation.
The surface roughness measurements were taken with a pin microrelief meter as described in Vidal Vázquez (2002). The plot area was 135 cm by 135 cm and the sample spacing was 25 mm, yielding a total of 3,025 data points per measurement. Figure 1 shows an illustration of the pin microrelief meter used.
Because surface roughness heights showed some trend caused, respectively by the surface slope and the tillage treatment marks, the surface height data were submitted to two different trend removal techniques:
i) The procedure proposed by Currence & Lovely (1970) in which a linear and periodic trend are removed using a very simple procedure that involves subtracting the average value for the ith row and jth column in from the original value through the equation:

where Hij is the corrected height at the ith row and jth column after removal of both the slope and the periodic trends, hij is the original height value for the ith row and the jth column,  i is the average for the ith row, j is the average height for the jth column,
  is the average of all points.
ii) The other one involves the subtraction of a three dimensional surface fitted by minimum least squares from the original data, with a degree 1, 2 or 3, depending on the goodness of fit produced and the resulting semivariogram. This technique is well described in Vieira et al. (1983). The primary objective of the trend removal is to expose the surface roughness without the slope and tillage components and to produce an intrinsic semivariogram with a well defined sill.
Geostatistical data treatment comprised the analysis of semivariograms with their respective parameters of models fitted according to Vieira et al. (1983). Semivariograms are calculated as follows:

where N(h) is the number of pairs of height values, Z(xi) separated by a vector h. In order to be used, to properly describe the spatial variability of any variable, one of the requirements on the model is that the function used must be conditional positive definite (MacBratney & Webster, 1986). This condition will guarantee that the variances calculated will be positive. The main models that satisfy that condition and are adequate for use in geostatistical calculations are the spherical, the exponential and the Gaussian. On the equations bellow, C0, C1, and a represent the nugget effect, the structural variance and the range, respectively.
For the spherical model, usually symbolized as Sph(C0, C1, a), the equation is:

The exponential model, symbolized as Exp(C0, C1, a), the equation is:

The gaussian model, symbolized as Gau(C0, C1, a), the equation is:
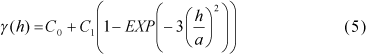
where C0, C1 and a are, respectively, the nugget effect, the structural variance and the range of spatial dependence. An analysis of the semivariogram model parameters as a function of the tillage intensity and cumulative rainfall was also made.
The Dependence Ratio (DR) was calculated according to Cambardella et al. (1994) with the equation:

The dependence ratio can provide an indication of the proportion of the variance which is structured, and consequently, the proportion which is random. Surface spatial behavior can be assessed with the analysis of the DR parameters.
In order to check if the surfaces had similar spatial variability behavior, their semivariograms were scaled according with Vieira et al. (1997) with the equation:

where m indicates the number of measured variables. The scale factor a, is a constant that can take the value of the calculated variance, the sill when it exists, or the highest value of the semivariogram γ(h). The resulting scaled semivariograms will have a sill equal to 1 (one), if it exists. Because the semivariograms represent the way the variability behaves in the sampled space, thus, when the scaled semivariograms plotted to the same graph show similar behavior, it is an indication of similar variability. In other words, surfaces that present similar scaled semivariograms will represent similar roughness behavior.
RESULTS AND DISCUSSION
Comparison of different detrending procedures
Figures 2 to 7 show the scaled semivariograms for all the 48 surfaces separated by tillage treatment and identified by the cumulative precipitation and calculated for three kinds of surfaces: i) the original surfaces without any trend removal operation; ii) the surfaces for which the trend was removed using a parabolic trend surface equation with minimum least squares fit; and iii) the surfaces for which the slope and the periodic trends were removed using Currence & Lovely (1970). Trend removal is required because the surface roughness parameters will be affected by the existence of a slope and/or a periodic component due to tillage, and because the geostatistical analysis requires that at least the intrinsic hypothesis be satisfied, which banishes the presence of a trend (Vieira et al., 1983). For any variable following the intrinsic hypothesis of geostatistics, the sill of the semivariograms must exist and approach the value of the sample variance (Vieira et al., 1983).


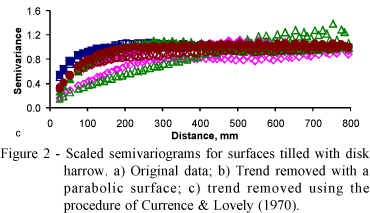
The scaled semivariograms for all the Disk Harrow (DH) surfaces are shown in Figures 2a, 2b and 2c. Regardless of cumulative rainfall, all semivariograms for the original values show some well defined trend (Figure 2a). They are all different, i.e., the spatial distribution of the surface roughness is different among them. The parabolic trend removal produced intrinsic semivariograms (Figure 2b) that they all have well defined sill value of approximately 1. The significance of their nearness to the value of 1 (one), and other questions on their parameters can be assessed using the jack knifing procedure as described elsewhere (Vieira et al., 1983), fact which is beyond the objectives of this paper.
The parabolic trend removing surface seems to have introduced or left some periodicity on the treatments with large values for the cumulative rainfall. The primary reason for this fact may be because the parabolic trend surface is not efficient enough to remove localized trends caused by the smoothing effect of the cumulative rain, and it primarily removes the main plot scale trend. On the other hand, the procedure recommended by Currence & Lovely (1970) seems to have removed completely all the tillage periodicity effect (Figure 2c). However it was not enough to remove the trend of, at least one surface identified as DH 113.3 II. The procedure used by Currence & Lovely (1970) (Figure 2c) decreased the value of the range of the semivariograms by more than half as compared to the parabolic trend removing procedure (Figure 2b). Therefore, the surfaces resulting from the procedure recommended by Currence & Lovely (1970) have smaller diameter homogeneous regions as compared to the ones generated by the parabolic trend removal procedure. The resulting scaled semivariograms for the parabolic trend surface procedure (Figure 2b) seem to have a shape near the origin which would fit spherical models while the ones on Figure 2c (result of the procedure recommended by Currence & Lovely (1970)) seem to fit better an exponential model. This also means that the detrending procedure produced surfaces with different spatial distribution.
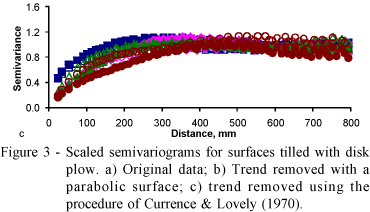
Figure 3 shows the scaled semivariograms for the Disk Plow (DP) tillage treatments. Apparently the eight surfaces in this tillage treatment are a somewhat more similar to each other than the Disk Harrow (DH) treatment, as the scaled semivariograms are more coalesced than the previous ones. Again the scaled semivariograms for the original values (Figure 3a) show a very clear trend (no stabilization to a sill value), the scaled semivariograms for the surfaces resulting from the parabolic trend surface procedure (Figure 3b) clearly have a sill (no trend), have some periodic residual in particular after the larger cumulative rainfalls and show a spherical behavior near the origin, and the ones produced with detrending using the procedure in Currence & Lovely (1970) (Figure 3c) have an exponential behavior near the origin, smaller ranges (although not as much as the previous ones Figure 2) and no periodic component on the residuals.
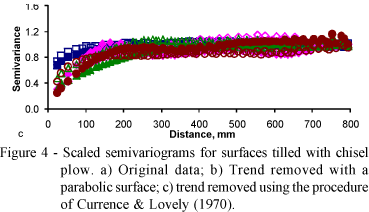
The resulting scaled semivariograms for Chisel Plow tillage (CP) treatment are shown in Figure 4. This is by far the tillage treatment which gave the greatest emphasis to the above discussion because the Currence & Lovely (1970) detrending procedure seemed to have been more appropriately designed for surface that besides having for sure a slope trend also and surely have a periodical component caused by the chisel plow implement. The eight original surfaces have a very distinct variability as their semivariograms are quite distinct from each other (Figure 4a). For instance, in Figure 4a the scaled semivariograms for the treatments identified as CP 0 I (closed squared), CP 0 II (open squares) and CP 120.9 I (closed triangles) did not even need any kind of detrending since the semivariograms for the original values already have a well defined sill. The parabolic detrending procedure produced semivariograms which seem to be adequately described near the origin by the spherical model with a range of approximately 200 mm, although there is visually some periodical component remaining (Figure 4b). The Currence & Lovely (1970) procedure for detrending produced semivariograms (Figure 4c) which appear to be exponential in shape near the origin, with somewhat smaller ranges than the parabolic procedure, no periodic component and clearly intrinsic.
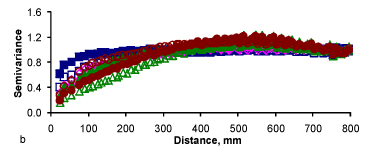
Figures 5, 6 and 7 correspond to the same tillage treatments as do Figures 2, 3 and 4, with the difference that a leveling disk harrow was passed on these surfaces before the roughness measurements were made. Therefore, besides the leveling effect caused by the cumulative rainfall, there was also the effect of the secondary tillage. Figure 5a shows scaled semivariograms, which are very clearly with trend most of which with degree two (parabolic) or more, as they show a positive rate of increase with distance. Only the semivariogram for DH + L 294.6 II (open circles) could have been fitted to a surface with a degree smaller than two. Not all the resulting semivariograms could be adequately fitted by a spherical model as DH + L 0 I (closed squares) and DH + L 0 II (open squares) could be better described with an exponential model (Figure 5b). These two semivariograms are very similar to the corresponding ones for the surfaces resulting from the trend removal with Currence & Lovely (1970) (Figure 5c).
There was some remaining periodicity only on DH + L 232.8I and DH + L 294.6 I. The surfaces remaining from the trend removal using Currence & Lovely (1970) shown in Figure 5c are quite different from the ones obtained with the parabolic trend removal (Figure 5b). The semivariograms for the original data for DP + L 0II and DP + L 232.8 II (Figure 6a) did not need any trend removal, and they were already intrinsic. For the trend removal using the parabolic trend surface (Figure 6b), except for DP + L 232.8 II which seems spherical, all the other ones could be adequately fit to exponential models. There is a big contrast for the procedures illustrated by the semivariogram for DP + L 294.6 II (Figure 6c) as the resulting semivariogram is still not intrinsic, i.e., the Currence & Lovely (1970) method was not enough in this case.
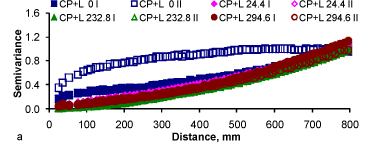
Figure 7 shows the scaled semivariograms for the three methods of detrending for the tillage treatment CP + L with increasing cumulative rainfall. Again in Figure 7a it seems clear that the surface CP + L 0 II did not need any trend removal. The parabolic surfaces removed efficiently the trend from all surfaces (Figure 7b). However, the Currence & Lovely (1970) method did not remove the linear trend from CP + L 294.6 II and left some periodical component on CP + L 232.8 II (Figure 7c).
One of the statistical ways of supporting or not the detrending procedure is through the coefficient of determination between the surface and the original data. Figure 8 shows a three-dimensional map for the coefficients of determination between the parabolic surface and the original surfaces. The R2 were only below 0.6 for the surface corresponding to the Chisel Plow (CP), which produces a strong periodical component that was not adequately removed with the parabolic trend surface equations, in particular for the small values of cumulative rainfall. As the cumulative rainfall increased, the R2 all passed 0.8. This is very positive result for the parabolic trend removal procedure.
Figure 9 shows the relationship between the Dependence Ratio (DR) and the cumulative rainfall for each tillage treatment. It is quite general that the DR values decrease as the cumulative rainfall increase, which means that the amount of randomness decreases with the smoothing effect of the cumulative rainfall. The leveling harrow treatments (CP + L, DP + L, and DH + L) contributed to increase the values of DR, which means that there was an increase in the randomness of the surface roughness due to the leveling harrow. Regardless of the kind of tillage implement, the semivariances decreased by a factor of six when comparing the surfaces obtained with zero precipitation and at the end of the experiment. This is because the surfaces became smoother as the precipitation increases.
CONCLUSIONS
Geostatistical analysis enhances the characterization of soil surface microrelief features as it provides additional insight into the assessment obtained from currently used roughness indices. Spatial dependence increased for most of the surfaces as the amount of cumulative rainfall increased. The trend removing method affected the geostatistical results. Although the parabolic trend removing procedure leaves remaining periodicity caused by tillage, the Currence and Lovely procedure also leaves slope trends in some surfaces.
ACKNOWLEDGMENTS
This work was partly performed in the frame of research projects: PHB 2003-0043-PC, financed by CAPES (Brazil) and MEC (Spain) and CGL2005-08219-C02/HID financed by I + D National Program on Biodiversity Earth Sciences and Global Change (CGL), subprogram HID of MEC (Spain).
Received October 31, 2006
Accepted November 14, 2008
- ALLMARAS, R.R.; BURWELL, R.E.; LARSON, W.E.; HOLT, R.F. Total porosity and random roughness of the interrow zone as influenced by tillage Washington, D.C.: USDA, 1966. p.1-14. (USDA. Conservation Research Report, 7),
- CAMBARDELLA, C.A.; MOOMAN, T.B.; NOVAK, J.M.; PARKIN, T.B., KARLEM, D.L.; TURVO, R.F.; KONOPA, A.E. Field scale variability of soil properties in central Iowa soil. Soil Science Society of America Journal, v.47, p.1501-1511, 1994.
- CURRENCE, H.D.; LOVELY, W.G. The analysis of soil surface roughness. Transactions of the American Society of Agricultural Engineering, v.13, p.710-714, 1970.
- EMPRESA BRASILEIRA DE PESQUISA AGROPECUÁRIA-EMBRAPA. Centro Nacional de Pesquisa de Solos. Sistema Brasileiro de Classificação de Solos. 2şed. Rio de Janeiro, 2006. 306p.
- HUANG, C., Quantification of soil microtopography and surface roughness. In: BAVEYE, P.; PARLANGE, J.Y.; STEWART, B.A., (Ed.) Fractals in soil science Boca Raton: CRC Press, 1998. p.153-168.
- HUANG, C.; BRADFORD, J.M. Applications of a laser scanner to quantity soil microtopography. Soil Science Society of America Journal, v.56, p.14-21, 1992.
- MacBRATNEY, A.B.; WEBSTER, R. Choosing function for semivariograms of soil properties and fitting them to sampling estimates. Journal of Soil Science, v.37, p.617-639, 1986.
- MIRANDA, J.G.V. análisis fractal del microrrelieve del suelo. Coruña: Universidade da Coruña, 2000. 317p. Thesis (Ph.D.
- PAZ GONZÁLEZ, A.; VIEIRA, S.R.; TABOADA CASTRO, M.T. The effect of cultivation on the spatial variability of selected properties of an umbric horizon. Geoderma, v.97, p.273-292, 2000.
- SOIL SURVEY STAFF. Key to soil taxonomy Washington, D.C.: USDA-Natural Resources Conservation Service, 1998. 326p.
- VIDAL VÁZQUEZ, E. Influencia de la precipitación y el laboreo en la rugosidad del suelo y la retención de agua en microdepresiones. Coruña: Universidade da Coruña, 2002. 430p. Thesis (Ph.D.
- VIEIRA, S.R.; HATFIELD, J.L.; NIELSEN, D.R.; BIGGAR, J.W. Geostatistical theory and application to variability of some agronomical properties. Hilgardia, v.51, p.1-75, 1983.
- VIEIRA, S.R.; NIELSEN, D.R.; BIGGAR, J.W.; TILLOTSON, P.M. The Scaling of semivariograms and the kriging estimation. Revista Brasileira de Ciência do Solo, v.21, p.525-533, 1997.
Publication Dates
-
Publication in this collection
03 Apr 2009 -
Date of issue
Apr 2009
History
-
Accepted
14 Nov 2008 -
Received
31 Oct 2006