Abstract
Natural ventilation is the most important method of climate control in Mediterranean greenhouses. In this study, the microclimate and air flow inside a Mediterranean greenhouse were evaluated by means of sonic anemometry. Experiments were carried out in conditions of moderate wind (≈ 4.0 m s-1), and at low wind speed (≈ 1.8 m s-1) the natural ventilation of the greenhouse was supplemented by two horizontal air flow fans. The greenhouse is equipped with a single roof vent opening to the windward side and two side vents, the windward one being blocked by another greenhouse close to it, while the leeward one is free of obstacles. When no fans are used, air enters through the roof vent and exits through both side vents, thus flowing contrary to the thermal effect which causes hot air to rise and impairing the natural ventilation of the greenhouse. Using fans inside the greenhouse helps the air to circulate and mix, giving rise to a more homogeneous inside temperature and increasing the average value of normalized air velocity by 365 %. These fans also increase the average values of kinetic turbulence energy inside the greenhouse by 550 % compared to conditions of natural ventilation. As the fans are placed 4 m away from the side vents, their effect on the entrance of outside air is insufficient and they do not help to reduce the inside temperature on hot days with little wind. It is therefore recommended to place the fans closer to the side vents to allow an additional increase of the air exchange rate of greenhouses.
climate control; microlimate; sonic anemometry
AGRICULTURAL ENGINEERING
Effectiveness of horizontal air flow fans supporting natural ventilation in a Mediterranean multi-span greenhouse
Alejandro López; Diego Luis Valera* * Corresponding author < dvalera@ual.es> Edited by: José Euclides Stipp Paterniani/Luís Reynaldo Ferracciú Alleoni ; Francisco Domingo Molina-Aiz; Araceli Peña
Universidad de Almería/Centro de Investigación en Biotecnología Agroalimentaria BITAL, Ctra. de Sacramento s/n 04120 Almería Spain
ABSTRACT
Natural ventilation is the most important method of climate control in Mediterranean greenhouses. In this study, the microclimate and air flow inside a Mediterranean greenhouse were evaluated by means of sonic anemometry. Experiments were carried out in conditions of moderate wind (≈ 4.0 m s1), and at low wind speed (≈ 1.8 m s1) the natural ventilation of the greenhouse was supplemented by two horizontal air flow fans. The greenhouse is equipped with a single roof vent opening to the windward side and two side vents, the windward one being blocked by another greenhouse close to it, while the leeward one is free of obstacles. When no fans are used, air enters through the roof vent and exits through both side vents, thus flowing contrary to the thermal effect which causes hot air to rise and impairing the natural ventilation of the greenhouse. Using fans inside the greenhouse helps the air to circulate and mix, giving rise to a more homogeneous inside temperature and increasing the average value of normalized air velocity by 365 %. These fans also increase the average values of kinetic turbulence energy inside the greenhouse by 550 % compared to conditions of natural ventilation. As the fans are placed 4 m away from the side vents, their effect on the entrance of outside air is insufficient and they do not help to reduce the inside temperature on hot days with little wind. It is therefore recommended to place the fans closer to the side vents to allow an additional increase of the air exchange rate of greenhouses.
Keywords: climate control, microlimate, sonic anemometry
Abreviations
EG error in the calculation of volumetric flow rate [%]; G ventilation volumetric flow rate [m3 s1]; HR relative humidity [%]; ΔHRh horizontal relative humidity gradient [% m1]; i turbulence intensity; k turbulence kinetic energy [m2 s2]; l two-dimensional horizontal resultant of air velocity in XY plane [m s1]; q specific humidity [kg kg1]; R ventilation rate for greenhouse [h1]; Rgsolar radiation [W m2]; SAgreenhouse base surface area [m2]; SV vent surface area [m2]; t time [s]; T temperature [ºC]; ΔTh horizontal temperature gradient [ºC m1]; u air velocity [m s1]; u* air velocities corrected with wind speed [m s1]; v two-dimensional vertical resultant of air velocity in XZ plane [m s1]; Δ difference; θ wind direction [º]; σ standard deviation; ηT ventilation efficiency for the temperature; i inside or interior surface of the vent; j measurement point; L leeward; M average value; o outside; ov air going out through the vents; R roof vent; s sonic; sc sonic corrected; S side vent; W windward; x longitudinal component; y transversal component; z vertical component; c corrected; n normalized; ' fluctuating component.
Introduction
Natural ventilation is probably the most important method of climate control in Mediterranean greenhouses. To optimize the design and operation of natural ventilation systems, the natural ventilation mechanism must be understood both quantitatively (Kittas et al., 1997) and qualitatively. The main driving forces of natural ventilation for a greenhouse (with roof and side openings) are caused by the following effects (Boulard and Baille, 1995): (i) the static wind effect which induces pressure differences between the side and the roof openings (Bruce, 1978) and between the windward and the leeward parts of the greenhouse (Boulard et al., 1996); (ii) the buoyancy forces generating a vertical distribution of pressures between the side and roof openings (Bruce, 1982); (iii) the turbulent effect of the wind, linked to the pressure fluctuations of the wind velocity along all the openings (Boulard and Baille, 1995).
The earliest studies on the circulation of air in greenhouses date back to the mid-20th century (Morris and Neale, 1954). Since then, several researchers have studied natural ventilation in greenhouses by means of scale models (Sase et al., 1984), the tracer gas method (Boulard et al., 1997; Kittas et al., 1997), CFD (Computational Fluid Dynamics) simulations (Boulard et al., 1997; Molina-Aiz et al., 2010) and direct measurements using different sensors (Boulard and Baille, 1995; Boulard et al., 1996; Shilo et al., 2004; Teitel et al., 2005). Sonic anemometry techniques have proved successful in establishing natural ventilation flow patterns (López et al., 2011).
Over recent years, horizontal air flow fans have been used in some Mediterranean greenhouses as a back-up system for natural ventilation on hot days with little wind. Different supplementary air distribution systems tend to be used in conjunction with cooling or heating systems to reduce microclimate heterogeneity (temperature, humidity and CO2) inside the greenhouse (Fernández and Bailey, 1994), one of the key factors for uniform crop growth (Teitel et al., 2010). Thus, this study aimed to determine the air velocity and turbulence characteristics in a multi-span type greenhouse with continuous screened side and roof vents under conditions natural ventilation, and to assess the feasibility of horizontal air circulation fans as a supplementary system for natural ventilation.
Materials and Methods
The experimental work took place in the western half (24 × 20 m2) of a 1,080 m2 three-span greenhouse located at an agricultural research farm in Almería, Spain (36º51' N, 2º16' W). The experimental greenhouse was physically divided into two similar sectors by a polyethylene sheet fixed to a stainless steel structure, as this allows us to study the natural ventilation of each half separately for other research studies (Figure 1).
Natural ventilation in western sector of the greenhouse is produced by the opening of two continuous side vents (1.05 × 17.50 m2) and one continuous roof vent (1.00 × 17.50 m2). These vents were opened 100 % (Figure 1), so the ventilation surface SV/SA (vent surface opened / ground surface) was 11.3 % for the western sector of the experimental greenhouse. In order to prevent insects entering the greenhouse vents were covered with insect-proof screens of 13 × 30 threads cm2 (0.39 porosity; 164.6 mm pore width; 593.3 mm pore height; 165.5 mm thread diameter). The western sector of the experimental greenhouse was also equipped with two air circulation fans (0.37 kW) located at a height of 2.5 m, i.e. the axis of the propeller was at a height of 2.81 m (Figures 1 and 2).
The greenhouse contained a tomato crop (Solanum lycopersicum L. cv. Salomee) with an average height of approximately 2.18 m for the 1st measurement test (05/14/2009) and 2.16 m for the last measurement test (05/22/2009). The leaf area index was about 2.03 and 2.09 m2 leaf per m2 ground for the first and last measurement tests, respectively. The crops were in rows oriented north-south, perpendicular to the side vents, thus facilitating the natural ventilation of the greenhouse (Boulard et al., 1997; FAO, 2002).
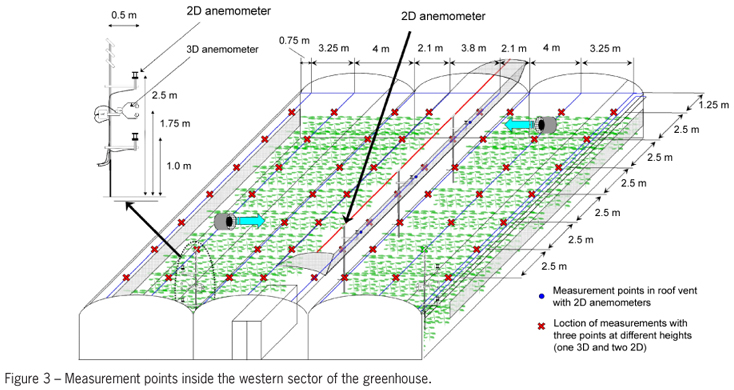
The three components of air velocity and temperature were measured with two 3D sonic anemometers (resolution: 0.001 m s1 and 0.002 ºC; accuracy ± 0.04 m s1 and ± 0.026 ºC). Air velocity was also measured with seven 2D sonic anemometers (resolution: 0.01 m s1; accuracy 2 %). Data of all sonic anemometers were recorded by two CR3000 Microloggers, with a data registration frequency of 10 Hz (Shilo et al., 2004) for the 3D and 1 Hz for the 2D sonic anemometers. The wire frame intended to support the crop was used to position the sonic anemometers inside the greenhouse (Figure 3A). A steel cable was extended under the greenhouse roof, parallel to the roof vent, to place the anemometers at the roof vent (Figure 3B).
To measure the air velocity inside the experimental greenhouse two devices were used, each with three anemometers at different heights (Figure 2A). These were placed at 55 points in the greenhouse (Figure 3), making a total of 165 measurement points. The air velocity was measured over 3 min at each of the 55 points. This time period is a compromise between a shorter one that may reduce accuracy and a longer one that may increase the overall difference with regard to outside microclimate parameters (Molina-Aiz et al., 2009). The air velocity at the roof vent was measured continuously by three 2D sonic anemometers (Figure 3) fixed to the greenhouse structure (Figure 2B). The roof vent was divided into three equal surfaces, measuring the air velocity at the centre of each one.
Outside climatic conditions were recorded by a meteorological station at a height of 10 m (Figure 1). The meteorological station included a BUTRON II measurement box equipped with a Pt1000 IEC 751 class B temperature sensor with a measurement range of 10 to 60 ºC and an accuracy of ± 0.6 ºC. This measurement box was also equipped with a HUMICAP 180R capacitive humidity sensor with a measurement range of 0 % to 100 % and an accuracy of ± 3 %. Outside wind speed was measured with a Meteostation II, incorporating a cup anemometer with a measurement range of 0 to 40 m s1, accuracy of ± 5 %, and resolution of 0.01 m s1. Wind direction was measured with a vane (accuracy ± 5 º and resolution 1 º). Incoming shortwave radiation was measured using a Kipp Solari sensor, with a measurement range of 0 to 2000 W m2, accuracy of ± 20 W m2, and resolution of 1 W m2. Air temperature and relative humidity in the middle of the eastern sector of the experimental greenhouse were measured with an EKTRON II-c measurement box (at heights of 2 m), equipped with the same sensors as the BUTRON II.
Temperature and relative humidity inside the western sector of the experimental greenhouse were measured using six autonomous dataloggers. The dataloggers were placed in a vertical profile under the ridge of the three greenhouse spans at heights of 1 and 2 m (Figure 1). These fixed devices measure a temperature range of -40 ºC to 70 ºC with an accuracy of ± 0.18 ºC and relative humidity of 0 % to 100 % with an accuracy of ± 2.5 %. They were all programmed to register data at 0.5 Hz and were protected against direct solar radiation with a passive solar radiation open shield.
The speed of sound measured by the sonic anemometers depends on both air temperature and air humidity. Therefore, in humid air it is necessary to correct the sonic temperature of air TS [ºC] obtained by the 3D sonic anemometer with the speed of sound. The specific humidity q [kg kg1] was used to calculate the corrected sonic temperature TSC [ºC] using the following expression (Tanny et al., 2008):

Three measurement tests were carried out under prevailing Poniente winds (southwest), which are the most frequent conditions in the province of Almería (Spain). In the first measurement test, the airflow inside the greenhouse was generated only by natural ventilation, whereas in the last two measurement tests two horizontal air flow fans were activated. The three tests were carried out at around noon, when the wind tends to be stronger and to maintain a more constant direction (Figure 4); spent two hours per test. So the outside climatic conditions remained relatively stable over the three measurement tests (Table 1 and Figure 4).
To analyze the airflow characteristics we calculated the following parameters from the anemometer measurements over 3 min: air velocity u and its components (longitudinal ux, transversal uy and vertical uz); the average value of two-dimensional horizontal resultant of air velocity (l) in the XY plane and two-dimensional vertical resultant of air velocity (v) in the XZ plane; turbulence intensity i and total turbulence kinetic energy k. An exhaustive description of all these parameters was given in López et al. (2011).
Fluctuating component of air velocity u' [m s1] is the instantaneous deviation of air velocity u with respect the time-mean value  . The variance of an air velocity over a period of time Δt is defined as (Pope, 2000):

Applying Equation 2 is determined standard deviation σ of the time series values recorded during the tests. The normalized velocity at each measurement point j can be calculated as (Boulard et al., 2000):

The same method of normalization applied to un (equation 3) was applied to the horizontal (l) and vertical (v) two-dimensional resultants of air velocity.
The parameters that characterize airflow turbulence (i and k) were only obtained from the measurements taken by the 3D sonic anemometers. Thinner structure (Figure 2A) and the highest sampling frequency (10 Hz) of the 3D respect to 2D sonic anemometers makes these anemometers are more suitable for studying the turbulence of the airflow.
Results and Discussion
Airflow inside of greenhouse
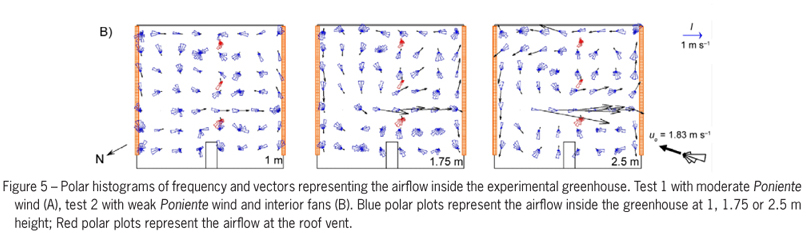
For conditions of Poniente wind, the roof vent opens to the windward side, the windward side vent is blocked due to the presence of another greenhouse close by and the leeward side vent (in the western sector) is completely free of obstacles (Figure 1). Therefore, in conditions of natural ventilation (test 1) due to the eolic effect, air enters the greenhouse through the roof vent and exits through both side vents (Figure 5A). The eolic effect is counteracted by the thermal effect, which causes warm air to rise due to buoyancy. The position of the vents in the experimental greenhouse is, therefore, not conducive to natural ventilation, as the two effects oppose each other. This does not occur when the roof vent opens to the leeward side (López et al., 2012a).
The above-mentioned contrary effects are not usually taken into consideration in studies of natural ventilation in greenhouses. If the greenhouse is equipped with ventilation openings both near the ground and at the roof, then the internal hot air is replaced with cooler external air on hot sunny days with little wind (Sethi and Sharma, (2007). The cool external air enters the greenhouse through the lower side openings while the hot internal air exits through the roof openings due to the density difference between air masses of different temperature, thus reducing the greenhouse temperature. This may be so for greenhouses with roof vents that roll up, but it does not always true for flap-type roof vents that open to the windward side, as is the case for our experimental greenhouse. For hot sunny days with little wind in greenhouses such as this one, we recommend opening all the side vents and, if possible, those roof vents that will give rise to a positive combination of the eolic and thermal effects.
Analysis of the airflow in the experimental greenhouse has revealed that the average air velocity (calculated as the average of measured values at different points) is more uniform in the southern sector (Table 2), while the direction of the air is less uniform in this sector. We can observe more fluctuation in the direction of the air in each measurement point in the southern sector (Figure 5). When air enters through the roof vent it maintains its direction to the northeast, coming up against the polyethylene sheet which divides the greenhouse, and changing direction to flow in the opposite direction to the wind. The airflows to the south, where it exits through the side vent, and to the west where there is no outlet for it. Such airflows against the prevailing wind direction have been observed by other authors (Molina-Aiz et al., 2009; Wang and Deltour, 1999).
The use of horizontal airflow fans on hot days with little wind considerably increases the movement and mixture of air inside the greenhouse (Figure 5B). At 1.75 m, the normalized horizontal two-dimensional resultant of air velocity (ln), for the tests with fans, was approximately 3.5 times higher in the northern sector and 4 times higher in the southern sector compared to the values recorded during the test 1 without fans (Table 2). These fans can contribute to making the greenhouse microclimate more heterogeneous by avoiding zones of air stagnation (Fernández and Bailey, 1994), i.e. zones of the greenhouse in which warm air accumulates.
In these experiments the air velocity was measured in one of the aisle that contained the fan in the northern sector, while in the southern sector measurements were taken in the two aisles on either side of the one with the fan (Figure 5B). The crop rows ran perpendicular to the side vents, and consequently the main effect of the horizontal air flow fans centers on the aisles where the fans are located, decreasing in the adjacent aisles (Figure 5B). Fernandez and Bailey (1992) showed that the horizontal flow of air in a greenhouse was influenced by the number and position of air recirculation fans and by the presence of a tomato crop growing in rows.
The use of these fans increases the horizontal airflow and generates currents of air that penetrate the crop rows (Bailey, 2006). Indeed, figure 5B illustrates that at many points air moves perpendicular to the crop rows. When placed at a height of 2.5 m, the fans had a greater influence at the top of the crop and above it. At this height the fans help to move and mix the air horizontally above the crop, but their effect on the air between the plants is greatly reduced (Figure 5B, 1 m height).
One negative aspect of the experimental setup was that it did not foment the entrance or exit of air (Figure 5B). The airflow generated by the fan in the northern sector of the greenhouse headed straight to the southern side and vent of the greenhouse, where it forked and ran in both directions parallel to the vent. It may be preferable to place the fans as close as possible to the side vents in order that they not only increase the mixture of inside air, but also increase the air exchange rate of greenhouses.
Anemometric Measurement of Volumetric Flow Rate
The mean volumetric flow rates through the greenhouse were calculated by the following expression (Molina-Aiz et al., 2009; López et al., 2011):

where: G is the mean volumetric flow rates [m3 s1], ux is the horizontal component of air velocity [m s1], perpendicular to the plane of the vents, and SV is the elementary surface [m2] for each measurement point j. The airflows in the roof vents are determined from measurements made with the three fixed 2D anemometers (three measurements points, SV equal to 5.83 m2 per point) (Figure 3). In side vents are determined from measurements made with the 3D anemometers, remaining right in the center of the vertical axis of the vent (seven measurement points, SV equal to 2.63 m2 per point). Changing external weather conditions affect the measurements made at each point. This problem can be overcome by selecting measurements for a fixed external wind direction and correcting the air velocities measured by sonic anemometry at each position j at the greenhouse openings uj(t) through a process of scaling with the wind speed. Multiplying measured values of air velocity uj(t) at minute t at each point j in the greenhouse openings by the ratio between the average wind speed uo for the overall test period (several hours) and the instantaneous values uo(t) (average for each minute t) (Molina-Aiz et al., 2009; López et al., 2011):

where, uj* is the scaled air velocity in the opening.
To verify to what extent the Law of Mass Conservation is met in the greenhouse the error in the calculation of the ventilation flows has been estimated as follows (Molina-Aiz et al., 2009; López et al., 2011):

In Test 1, we can see a value of EG = 3.5 % (Table 3), much lower than those observed in a previous work in the same greenhouse, with EG values between 7.5 and 33.6 % (López et al., 2011). In Tests 2 and 3, possibly due to the indoor fan, were obtained very high values of EG. In any case, the flows observed in the three vents of the greenhouse (Table 3) confirms that the use of horizontal air flow fans (away for the side vents) does not contribute to increase the ventilation volumetric flow rates.
Normalized velocity of air inside of greenhouse
Inside the greenhouse during test 1 the values of un were close to those observed by Kittas et al. (2008). These authors measured the air velocity inside a small mono-span greenhouse with two side vents, both with insect-proof screens, 50 % porosity (un = 0.023 ± 0.014), and without them (un = 0.055 ± 0.030). The values recorded in the first experiment are considerably lower than those of Boulard et al. (2000) inside a tunnel greenhouse with side vents and without insect-proof screens (un = 0.130 - 0.180), with a maximum value of 1.170 at the windward side opening. Inside our experimental greenhouse in conditions of natural ventilation the mean value of un (1.75 m height) was 0.043 ± 0.020 (Test 1). The horizontal air flow fans gave rise to a considerable increase in inside air velocity, as the mean values of un (1.75 m height) in tests 2 and 3 were 0.194 ± 0.192 and 0.206 ± 0.204, respectively. The fans increased the normalized air velocity inside the greenhouse by 365 %, i.e. to levels similar to those recorded by Boulard et al. (2000) in a greenhouse without screens.
To analyze the airflow uniformity, the heterogeneity of ln and vn has been calculated, at the measurement points inside the greenhouse, dividing their standard deviation by the mean value (Kittas et al., 2008). Operating the horizontal air flow fans increases the heterogeneity of ln and vn in the greenhouse (Table 4), i.e. it foments the mixture of air on both the horizontal and vertical planes. As this effect is greater with height; the heterogeneity of ln increases by 116 %, 130 % and 164 % at heights of 1, 1.75 and 2.5 m, respectively. On the other hand, the increase in heterogeneity of vn is somewhat lower (74 %) due to the horizontal placing of the fans. This greater mixing of air has a direct bearing on temperature distribution inside the greenhouse (Figure 6).

When the horizontal air flow fans are operating, the mean levels of turbulence intensity i rise by 22 %, while those of turbulence kinetic energy k rise by 550 %, reaching maximum values at the measurement points closest to the exit of air from the ventilators (Table 5). These horizontal air flow fans contribute to the homogenization of inside air by increasing turbulence kinetic energy, thus increasing the air's capacity to mix and transport heat and water vapour (Tan-atichat et al., 1982).
Interior Microclimate
To study the heterogeneity of temperature distribution (Figure 6), we used the air temperatures measured at 1.75 m with the 3D anemometers at different times in the 55 positions. To compare these values of inside temperature, the effect of changes in outside temperature during the tests must be taken into account. This problem can be overcome using the difference in air temperature between the centre of the greenhouse and the external air stream as a scaling parameter (Boulard et al., 2000). However, this method can be problematic when there is little difference between inside and outside temperatures (Lopez, 2011). We have used the average of inside and outside temperatures as the parameter to scale the inside temperature measured with the anemometers. Thus corrected temperature values recorded at the different interior measuring points, respecting outside temperature. This will compensate the effect caused by the variation of the external climatic conditions during the tests, in the greenhouse microclimate. The inside-outside temperature difference used in Figure 6 has been calculated as (López et al., 2012b):

where: Tsc,j is the corrected sonic temperature [Eq. (1)] for position j inside the greenhouse, To and Ti are the mean outside and inside air temperatures during the test and To,j and Ti,j are the mean outside and inside air temperatures recorded by the fixed sensors during the 3 min used for measurement at position j.
The maps of inside temperature distribution (Figure 6) allow us to indentify zones where heat accumulates inside the greenhouse at a glance. In conditions of moderate Poniente wind and without operating the fans, heat can be seen to accumulate in the centre of the greenhouse (Figure 6A). This warm air rises due to buoyancy towards the roof vent, but it cannot leave the greenhouse as it encounters the opposing eolic effect (it should be remembered that during this experiment outside air entered through the roof vent). In this experiment the hottest point inside the greenhouse was 4.1 ºC warmer than the outside temperature.
When the horizontal air flow fans were operating, the temperature distribution in the greenhouse is more uniform (Figures 6B and 6C) than in test 1 (Figure 6A). The heterogeneity of ΔTioc inside the greenhouse, obtained as proposed by Kittas et al. (2008), proved greater for the experiment without fans (0.23) than for the two subsequent ones (0.15 and 0.20 for tests 2 and 3, respectively).
The location of the horizontal air flow fans did not foment the entrance of cool outside air, and so did not contribute efficiently to reducing the inside-outside temperature gradient. During both experiments with the fans (Tests 2 and 3) the wind velocity was lower than during the first experiment without fans. This implies that it was more difficult for heat to leave the greenhouse than in test 1. Indeed, in tests 2 and 3 the maximum temperatures recorded inside the experimental greenhouse were 6.6 ºC and 5.9 ºC higher than the outside temperature, respectively, while in test 1 this value was 4.1 ºC. The only slight drop in temperature can be observed upstream from the fans, close to the vents (Figures 6B and 6C). This suggests that placing the fans closer to the vents would increase the entrance of cool outside air, thus improving the inside microclimate.
Although the increase in inside temperature homogeneity constitutes a positive aspect of the use of the fans, in conditions of natural ventilation this does not always imply a lower thermal gradient between inside and outside. In their study of the microclimate of a mono-span greenhouse with different vent configurations, Kittas et al. (2008) found that the combination that achieved the smallest differences between inside and outside temperature was the one which showed greatest heterogeneity of temperature.
Table 6 shows the microclimate conditions measured inside the greenhouse during the three measurement tests. Operating the horizontal air flow fans can be seen to reduce slightly the vertical temperature gradient, as the temperature difference between the sensors placed at 1 and 2 m was 1.2 ºC for test 1 without fans, and 0.5 and 0.7 ºC, respectively, for tests 2 and 3 with fans.
The effect of the ventilation on the temperature of the inside air can be evaluated by using the term ventilation efficiency for the temperature ηT. This term can be calculated with the inside temperature of the greenhouse and with the temperature of the air leaving through the vents as follows (Qingyan et al., 1988; Tanny et al., 2008):

where: Tov is the average temperature of the air going out through the vents and ΔTio is the difference between inside and outside temperature during the measurement test. The term ηT represents the effectiveness in eliminating the heat from the area of the greenhouse occupied by the crop. When the air inside the greenhouse mixes perfectly then ηT = 1 (Tanny et al., 2008). For the first test, without fans but with moderate wind velocity, ηT was 0.95. In tests 2 and 3, ηT was 0.83, indicating that the use of the fans did not increase the ventilation efficiency. The lower value of ηT in these experiments is due exclusively to the lower wind velocity.
Although there is a much higher level of energy inside the greenhouse when the fans are operating than in conditions of natural ventilation (Table 5), they prove unable to eliminate heat to the outside because the increase in energy is concentrated in the vicinity of the fans. Indeed, the difference between inside and outside temperature (ΔTio) measured by the fixed sensors in tests 2 and 3 was the same in the western sector of the experimental greenhouse with fans as in the eastern sector without them (Table 6).
Conclusions
Natural ventilation could be improved by placing a vent in the western side of the experimental greenhouse in order to take better advantage of Poniente winds. The use of horizontal air flow fans helps to mix and homogenize the air inside the greenhouse, increasing the uniformity of temperature. Placing these fans at a certain distance from the vents does not induce the entrance of outside air. In addition, their use on warm days with little wind does not help to reduce the temperature difference in the greenhouse. Placing the fans closer to the side vents would enhance the entrance of outside air to the greenhouse.
Acknowledgements
This work has been financed by the Junta de Andalucía and the Ministerio de Ciencia e Innovación by means of the research grants P09-AGR-4593 and AGL2010-22284-C03-01, respectively.
Received May 23, 2012
Accepted May 09, 2013
- Bailey, B.J. 2006. Natural and mechanical greenhouse climate control. Acta Horticulturae 710: 4354.
- Boulard, T.; Baille, A. 1995. Modelling of air exchange rate in a greenhouse equipped with continuous roof vents. Journal of Agricultural Engineering Research 61: 3748.
- Boulard, T.; Meneses, J.F.; Mermier, M.; Papadakis, G. 1996. The mechanisms involved in the natural ventilation of greenhouses. Agricultural and Forest Meteorology 79: 6177.
- Boulard, T.; Feuilloley, P.; Kittas, C. 1997. Natural ventilation performance of six greenhouse and tunnel types. Journal of Agricultural Engineering Research 67: 249266.
- Boulard, T.; Wang, S.; Haxaire, R. 2000. Mean and turbulent air flows and microclimatic patterns in an empty greenhouse tunnel. Agricultural and Forest Meteorology 100: 169181.
- Bruce, J.M. 1978. Natural convection through openings and its applications to cattle building ventilation. Journal of Agricultural Engineering Research 23: 151167.
- Bruce, J.M. 1982. Ventilation of a model livestock building by thermal buoyancy. Transactions of the ASAE 25: 17241726.
- Food and Agriculture Organization [FAO]. 2002. El Cultivo Protegido en Clima Mediterráneo = Protected Cultivation in the Mediterranean Climate. FAO, Rome, Italy. (FAO Plant Production and Protection, 90) (in Spanish).
- Fernández, J.E.; Bailey, B.J. 1992. Measurement and prediction of greenhouse ventilation rates. Agriculture and Forest Meteorology 58: 229245.
- Fernández, J.E.; Bailey, B.J. 1994. The influence of fans on environmental conditions in greenhouses. Journal of Agricultural Engineering Research 58: 201210.
- Kittas, C.; Boulard, T.; Papadakis, G. 1997. Natural ventilation of a greenhouse with ridge and side openings: sensitivity to temperature and wind effects. Transactions of the ASAE 40: 415425.
- Kittas, C.; Katsoulas, N.; Bartzanas, T.; Mermier, M.; Boulard, T. 2008. The impact of insect screens and ventilation openings on the greenhouse microclimate. Transactions of the ASABE 51: 21512165.
- López, A.; Valera, D.L.; Molina-Aiz, F.D. 2011. Sonic anemometry to measure natural ventilation in greenhouses. Sensors 11: 98209834.
- López, A.; Valera, D.L.; Molina-Aiz, F.D.; Peña, A. 2012a. Sonic anemometry measurements to determine airflow patterns in multi-tunnel greenhouse. Spanish Journal of Agricultural Research 10: 631642.
- López, A.; Valera, D.L.; Molina-Aiz, F.D.; Peña, A. 2012b. Pad-fan systems in mediterranean greenhouses: determining optimal set up by sonic anemometry. Transactios of the ASABE 55: 10771089.
- Molina-Aiz, F.D.; Valera, D.L.; Peña, A.A.; Gil, J.A.; López, A. 2009. A study of natural ventilation in an almería-type greenhouse with insect screens by means of tri-sonic anemometry. Biosystems Engineering 104: 224242.
- Molina-Aiz, F.D.; Fatnassi, H.; Boulard, T.; Roy, J.C.; Valera, D.L. 2010. Comparison of finite element and finite volume methods for simulation of natural ventilation in greenhouses. Computers and Electronics in Agriculture 72: 6986.
- Morris, L.G.; Neale, F.E. 1954. The Infra-Red Carbon Dioxide Gas Analyser and its Use in Glasshouse Research. National Institute of Agricultural Engineering, Silsoe, Bedfordshire, England (Tech. Memo, 99).
- Pope, S.B. 2000. Turbulent Flows. Cambridge University Press, Cambridge, UK.
- Qingyan, C.; Van der Kooi, J.; Meyers, A.T. 1988. Measurements and computations of ventilation efficiency and temperature efficiency in a ventilated room. Energy and Buildings 12: 8599.
- Sase, S.; Takakura, T.; Nara, M. 1984. Wind tunnel testing on airflow and temperature distribution of a naturally ventilated greenhouse. Acta Horticulturae 148: 329336.
- Sethi, V.P.; Sharma, S.K. 2007. Survey of cooling technologies for worldwide agricultural greenhouse applications. Solar Energy 81: 14471459.
- Shilo, E.; Teitel, M.; Mahrer, Y.; Boulard, T. 2004. Air-flow patterns and heat fluxes in roof-ventilated multi-span greenhouse with insect-proof screens. Agricultural and Forest Meteorology 122: 320.
- Tan-Atichat, J.; Nagib, H.M.; Loehrke, R.I. 1982. Interaction of freestream turbulence with screens and grids: a balance between turbulence scales. Journal of Fluid Mechanics 114: 501528.
- Tanny, J.; Haslavsky, V.; Teitel, M. 2008. Airflow and heat flux through the vertical opening of buoyancy-induced naturally ventilated enclosures. Energy and Buildings 40: 637646.
- Teitel, T.; Tanny, J.; Ben-Yakir, D.; Barak, M. 2005. Airflow patterns through roof openings of a naturally ventilated greenhouse and their effect on insect penetration. Biosystems Engineering 92: 341353.
- Teitel, M.; Atias, M.; Barak, M. 2010. Gradients of temperature, humidity and CO2 along a fan-ventilated greenhouse. Biosystems Engineering 106: 166174.
- Wang, S.; Deltour, J. 1999. Lee-side ventilation-induced air movement in a large-scale multi-span greenhouse. Journal of Agricultural Engineering Research 74: 103110.
Publication Dates
-
Publication in this collection
29 July 2013 -
Date of issue
Aug 2013
History
-
Received
23 May 2012 -
Accepted
09 May 2013