ABSTRACT:
Multi-environment trials are commonly used to assess cultivar adaptation patterns under different environmental conditions and to help make effective cultivar recommendations for growers. An example of a multi-environment trial system used for cultivar recommendations is the Polish Post-registration Variety Testing System. A common approach in cultivar recommendations is to evaluate the adaptability of cultivars across, or for, specific trial locations. However, the locations of the trials and the fields where a farmer will grow a crop are hardly ever in the same place. Therefore, it would be better to group the trial locations into regions and give recommendations for the whole region. The aim of this study is to evaluate the grain yield adaptation patterns of 62 modern winter wheat cultivars in six agro-ecological regions of Poland for two crop management intensities over five growing seasons. The analysis of the grain yield data was performed separately for each intensity using single-stage approaches in linear mixed models. We ascertained that winter wheat yield variability was in the main determined by agro-ecological region and their interactions, and to a small extent by the cultivar effect. Cultivars Sailor and Linus were widely adapted to all agro-ecological regions studied for both crop management intensities. It is highly probable that these two cultivars will obtain high yield in all agro-ecological regions as well as with both crop management intensities studied. We observed high compatibility rankings between locations for both crop management intensities. High compatibility of the cultivar rankings in the trial locations also provides high precision when determining regions.
Keywords:
crop management intensity; covariance structure; cultivar recommendation; superior genotypes; yield ranking
Introduction
Studying crop management and understanding genotype × environment (G × E) interactions demonstrates the success and failure of cultivar breeding as well as highlights and prime factors associated with future progress (Liu et al., 2013Liu, S.M.; Constable, G.A.; Reid, PE.; Stiller, W.N.; Cullis, B.R. 2013. The interaction between breeding and crop management in improved cotton yield. Field Crop Research 148: 49-60.). In many countries, there are well-established practices for plant breeding companies to check new promising cultivars in multi-environment trials - METs (Smith et al., 2015Smith, A.; Ganesalingam, A.; Kuchel, H.; Cullis, B.R. 2015. Factor analytic mixed models for the provision of grower information from national crop variety testing programs. Theoretical and Applied Genetics 128: 55-72.).
A common approach in cultivar recommendation is to evaluate the adaptability of cultivars across or for specific trial locations (Eckl and Piepho, 2015Eckl, T.; Piepho, H.P. 2015. Analysis of series of cultivar trials with perennial grasses for subdivided target regions. Crop Science 55: 597-609.; Piepho et al., 2016Piepho, H.P.; Nazir, M.F.; Qamar, M.; Rattu, A.R.; Riaz-ud-Din; Hussain, M.; Ahmad, G.; Subhan, F.; Ahmad, J.; Laghari, A.K.B.L.; Vistro, I.A.; Kakar, M.S.; Sial, M.A.; Imtiaz, M. 2016. Stability analysis for a countrywide series of wheat trials in Pakistan. Crop Science 56: 2465-2475.). Unfortunately, from the growers' point of view, recommendations for a particular trial location are not particularly useful. The main reason is that, in most cases, trial locations do not overlap with farmlands. Thus, it would be more advantageous to give credible recommendations for an entire agricultural region so that farmers can benefit from them. In the literature, these kinds of regions are called agro-ecological regions or multi-environments.
Trial locations can be grouped into regions according to two main approaches: an a priori and an a posteriori. In the a priori approach, regions are determined based on similarities in environmental conditions of the trial locations (Annicchiarico et al., 2010Annicchiarico, P.; Chiapparino, E.; Perenzin, M. 2010. Response of common wheat varieties to organic and conventional production systems across Italian locations, and implications for selection. Field Crops Research 116: 230-238.; Barrero Farfan et al., 2013Barrero Farfan, I.D.; Murray, S.C.; Labar, S.; Pietsch, D. 2013. A multi-environment trial analysis shows slight grain yield improvement in Texas commercial maize. Field Crop Research 149: 167-176.; Tapley et al., 2013Tapley, M.; Ortiz, B.V.; van Santen, E.; Balkcom, K.S.; Mask, P.; Weaver, D.B. 2013. Location, seeding date, and variety interactions on winter wheat yield in southeastern United States. Agronomy Journal 105: 509-518.). An example of this is the wheat mega environment for the entire world developed by CIMMYT (Hodson and White, 2007Hodson, D.P.; White, J.W. 2007. Use of spatial analyses for global characterization of wheat-based production systems. The Journal of Agricultural Science 145: 115-125.). The a posteriori division is completed based on the performance evaluations of cultivars that are investigated (Ebdon and Gauch, 2002Ebdon, J.S.; Gauch, H.G. 2002. Additive main effect and multiplicative interactions analysis of national turfgrass performance trials: interpretation of genotype × environment interactions. Crop Science 42: 489-496.; Mandal et al., 2010Mandal, N.P; Sinha, PK.; Variar, M.; Shukla, V.D.; Perraju, P; Mehta, A.; Pathak, A.R.; Dwivedi, J.L.; Rathi, S.P.S.; Bhandarkar, S.; Singh, B.N.; Singh, D.N.; Panda, S.; Mishra, N.C.; Singh, Y.V.; Pandya, R. 2010. Implications of genotype x input interactions in breeding superior genotypes for favorable and unfavorable rainfed upland environments. Field Crop Research 118: 35-144.; Munaro et al., 2014Munaro, L.B.; Benin, G.; Marchioro, V.S.; Assis Franco, F.; Silva, R.R.; Silva, C.L.; Beche, E. 2014. Brazilian spring wheat homogeneous adaptation regions can be dissected in major megaenvironments. Crop Science 54: 1374-1383.). Environments with similar relative performances of cultivars are grouped together into the same region (Mandal et al., 2010Mandal, N.P; Sinha, PK.; Variar, M.; Shukla, V.D.; Perraju, P; Mehta, A.; Pathak, A.R.; Dwivedi, J.L.; Rathi, S.P.S.; Bhandarkar, S.; Singh, B.N.; Singh, D.N.; Panda, S.; Mishra, N.C.; Singh, Y.V.; Pandya, R. 2010. Implications of genotype x input interactions in breeding superior genotypes for favorable and unfavorable rainfed upland environments. Field Crop Research 118: 35-144.; Tapley et al., 2013Tapley, M.; Ortiz, B.V.; van Santen, E.; Balkcom, K.S.; Mask, P.; Weaver, D.B. 2013. Location, seeding date, and variety interactions on winter wheat yield in southeastern United States. Agronomy Journal 105: 509-518.). Trial locations grouped this way are very often not geographically clustered.
Effective cultivar recommendation requires an assessment of the influence of crop management intensity on cultivar rankings in specific regions. Usually, crop management recommendations include sowing time, fertilizer rate and weed control strategy (Cooper et al., 2001Cooper, M.; Woodruft, D.R.; Philips, I.G.; Basford, K.E.; Golmour, A.R. 2001. Genotype by management interactions for grain yield and grain protein concentration of wheat. Field Crop Research 69: 47-67.). Thus, management and genotype × management interactions have been extensively studied as they are the most influential factors for crop yield. In commercial wheat production, diversified crop management intensities are used to maximize yield. The aim of this study was to evaluate the grain yield adaptation pattern of 62 modern winter wheat cultivars in different agro-ecological regions of Poland for two crop management intensities. In addition, we included a repeatability assessment of the results for these agro-ecological regions over all tested growing seasons and across all trial locations.
Materials and Methods
Field trials
The grain yield data used in this study were obtained from 49 locations (Figure 1) of the Polish Post-Registration Variety Testing System (PVTS) for 62 winter wheat cultivars (G) over five growing seasons (Y) from 2009/2010 to 2013/2014. Each of 49 trial locations (L) was assigned to one of six agro-ecological regions (R) (Table 1). In each trial, the winter wheat cultivars were evaluated at two levels of crop management (M) intensity, a moderate-input management (MIM) system and a high-input management (HIM) system. The MIM level included standard fertilization adapted to conditions in each location, interventional use of herbicides and insecticides, and seed treatment. At the HIM level, an additional nitrogen dose of 40 kg ha−1, foliar fertilizers, fungicides and growth regulators were applied. Each field experiment was conducted according to a two-factor (crop management and cultivar) strip-plot design with two replications using a resolvable incomplete block design for cultivar plots. The area of each plot was 15 m2. The G × L(R) × M × Y data set (62 cultivars, 49 locations nested into 6 agro-ecological regions, 2 crop managements and 5 seasons) was highly unbalanced; 9,766 combinations were filled, representing 32 % of all the combinations possible in the correspondent balanced classification. The number of cultivars tested in each location over the growing seasons analysed is described in Table 2.
Description of 49 trial locations with the number of tested cultivars in the Polish Post-Registration Variety Testing System over five growing seasons (from 2009/2010 to 2013/2014).
Statistical methods
The analysis of the grain yield data was performed using a single-stage approach in a linear mixed model (LMM). In more complex METs the varietal recommendation is usually given for each of the crop management intensities separately. LMMs used for statistical analysis of complex METs do not commonly contain crop management factors (Laidig et al., 2014Laidig, F.; Piepho, H.P.; Drobek, T.; Meyer, U. 2014. Genetic and non-genetic long-term trends of 12 different crops in German official variety performance trials and on-farm yield trends. Theoretical and Applied Genetics 127: 2599-2617.) as they increase model complexity. Therefore, in this study, we analysed these two crop management intensities separately. The linear mixed model used for resolvable incomplete block design is given by the equation:
where: μ is the overall mean; zq the fixed effect of the q-th agro-ecological region; gk the random effect of the k-th cultivar; a the random effect of the i-th year; zl the fixed effect of the j-th location nested in q-th agroecological region; zaqi the random interaction effect of the i-th year and the q-th agro-ecological region; gzkq the random interaction effect of the k-th cultivar and q-th agro-ecological region; glzkq(j) the random interaction effect of the k-th cultivar and j-th location nested in q-th agro-ecological region; zla.iq(j) the random interaction effect of the i-th year and j-th location nested in q-th agroecological region; gzakq(j) the random interaction effect of the k-th cultivar and j-th location nested in q-th agroecological region; gzlakq(j)i the random interaction effect of the k-th cultivar, i-th year and j-th location nested in q-th agro-ecological region; rjih the random effect of the h-th replication nested in j-th location at i-th year; bjihm the random effect of the m-th block nested in h-th replication at the j-th location and i-th year, and eijhklmq the random effect of error associated with the yield observation yijklma.
For the random influence of the cultivar effects in each agro-ecological region, we assumed a variance-covariance matrix where the diagonal elements are cultivar variances for the individual agro-ecological regions and the off-diagonal elements are cultivar covariances between pairs of agro-ecological regions. The structure was modelled by a factor analytic structure with four components, FA(4). The FA structure uses multiplicative terms for approximating the unstructured variance-covariance matrix. In many previous studies, FA structures were recommended to model cultivar × environment (location, region) relationships for unbalanced data. In LMM, the adjusted means of yield for combinations cultivar × agro-ecological region, cultivar × agro-ecological region × year and cultivar × location were calculated using the algorithm described by Welham et al. (2004)Welham, S.; Cullis, B.; Gogel, B.; Gilmour, A.; Thompson, R. 2004. Prediction in linear mixed models. Australian & New Zealand Journal of Statistics 46: 325-347.. Additionally, to test significance of the cultivar, agroecological region, location nested in agrological region and year effects, we used Type III tests for fixed effects and variance components with its standard errors for random effects. In LMM, the adjusted means of yield for the combinations cultivar × agro-ecological region, cultivar × agro-ecological region × year and cultivar × location were calculated using the algorithm described by Welham et al. (2004)Welham, S.; Cullis, B.; Gogel, B.; Gilmour, A.; Thompson, R. 2004. Prediction in linear mixed models. Australian & New Zealand Journal of Statistics 46: 325-347., obtained from the BLUP (best linear unbiased prediction) for random effects and BLUE (best linear unbiased estimator) for fixed effects. The variance parameters and BLUP were estimated using the restricted maximum likelihood (REML) method.
The adjusted means for appropriate combinations obtained were used to assess the compatibility of cultivar rankings across studied agro-ecological regions, trial locations and over the growing seasons. We used the compatibility test to separately evaluate yield repeatability over the years or across trial locations in each agro-ecological region. The compatibility of the cultivar yield rankings across regions, trial locations and over the years was evaluated using Spearman's rank correlation coefficient. Rweyongeza (2011)Rweyongeza, D. 2011. Pattern of genotype-environment interaction in Picea glauca (Moench) Voss in Alberta, Canada. Annals of Forest Science 68: 245-253. and Yang (2002)Yang, R.C. 2002. Likelihood-based analysis of genotype-environment interaction. Crop Science 42: 1434-1440. suggested that a coefficient value higher than 0.7 indicates compatibility of the yield rankings across regions or trial locations. The varietal wide adaptation was evaluated using nonparametric TOP5 parameter separately for each agro-ecological region (Fox et al., 1990Fox, P.N.; Skovmand, B.; Thompson, B.K.; Braun, H.J.; Cormier, R. 1990. Yield and adaptation of hexaploid spring triticale. Euphytica 47: 57-64.). This parameter was obtained as a proportion of the number of trial locations included in a specific agro-ecological region where a specific cultivar occurred in the top five of the yield rank. Additionally, based on the adjusted means for cultivar × agro-ecological region, we used GGE biplot analysis (Yan et al., 2000Yan, W.; Hunt, L.A.; Sheng, Q.; Szlavnics, Z. 2000. Cultivar evaluation and mega-environment investigation based on the GGE biplot. Crop Science 40: 597-605.).
For statistical analysis we used the R 3.2.5 software package. The applied LMM was fitted using ASReml 3.0, implemented in the R software package ASReml-R (Gilmour et al., 2009Gilmour, A.R.; Gogel, B.J.; Cullis, B.R.; Thompson, R. 2009. ASReml User Guide Release 3.0. VSN International, Hemel Hempstead, UK.).
Results
The fixed effects considered were significant at both crop management intensities (Table 3). The total yield variation among random effects was similar in both studied intensities studied. Most of the total yield variation was explained by the interaction between year and location nested in the agro-ecological region (in MIM - 56 %; in HIM - 54 %). The yield was also highly influenced by the random effect of year (in MIM - 13 %; in HIM - 16 %). The cultivar effect explained only approximately 1 % of the total yield variation.
Wald F ratio for fixed effects and variance components with the percent of total variation for random effects in both crop management intensities.
In the case of MIM, the highest value of TOP5 parameters in region 1 was observed in cultivars Julius and Sailor (Table 4). In all locations from region 2, cultivars KWS Dacanto and Linus were in the first five highest yielding cultivars (TOP5 - 100 %). Moreover, a value of TOP5 equal to 100 % in MIM was also observed in KWS Dacanto in region 4 and in Linus in region 5 and region 6. In region 3, the highest value of TOP5 was observed in Linus (82 %). In general, cultivars KWS Dacanto, Linus and Sailor were characterized by wide adaptation to trial locations across studied regions for the MIM crop management intensity. Linus was one of the five cultivars with the highest yields in all trial locations for 3 agro-ecological regions and, in region 1, in 60 % of the trial locations. Similar performance was observed in KWS Dacanto, but TOP5 was only 100 % in 2 agro-ecological regions. In the case of Sailor, TOP5 was over 60 % in all agro-ecological regions except region 5 (45 %).
The values of TOP5 parameters for cultivars in studied agro-ecological regions for two crop management intensities. The table shows only cultivars with a TOP5 other than zero.
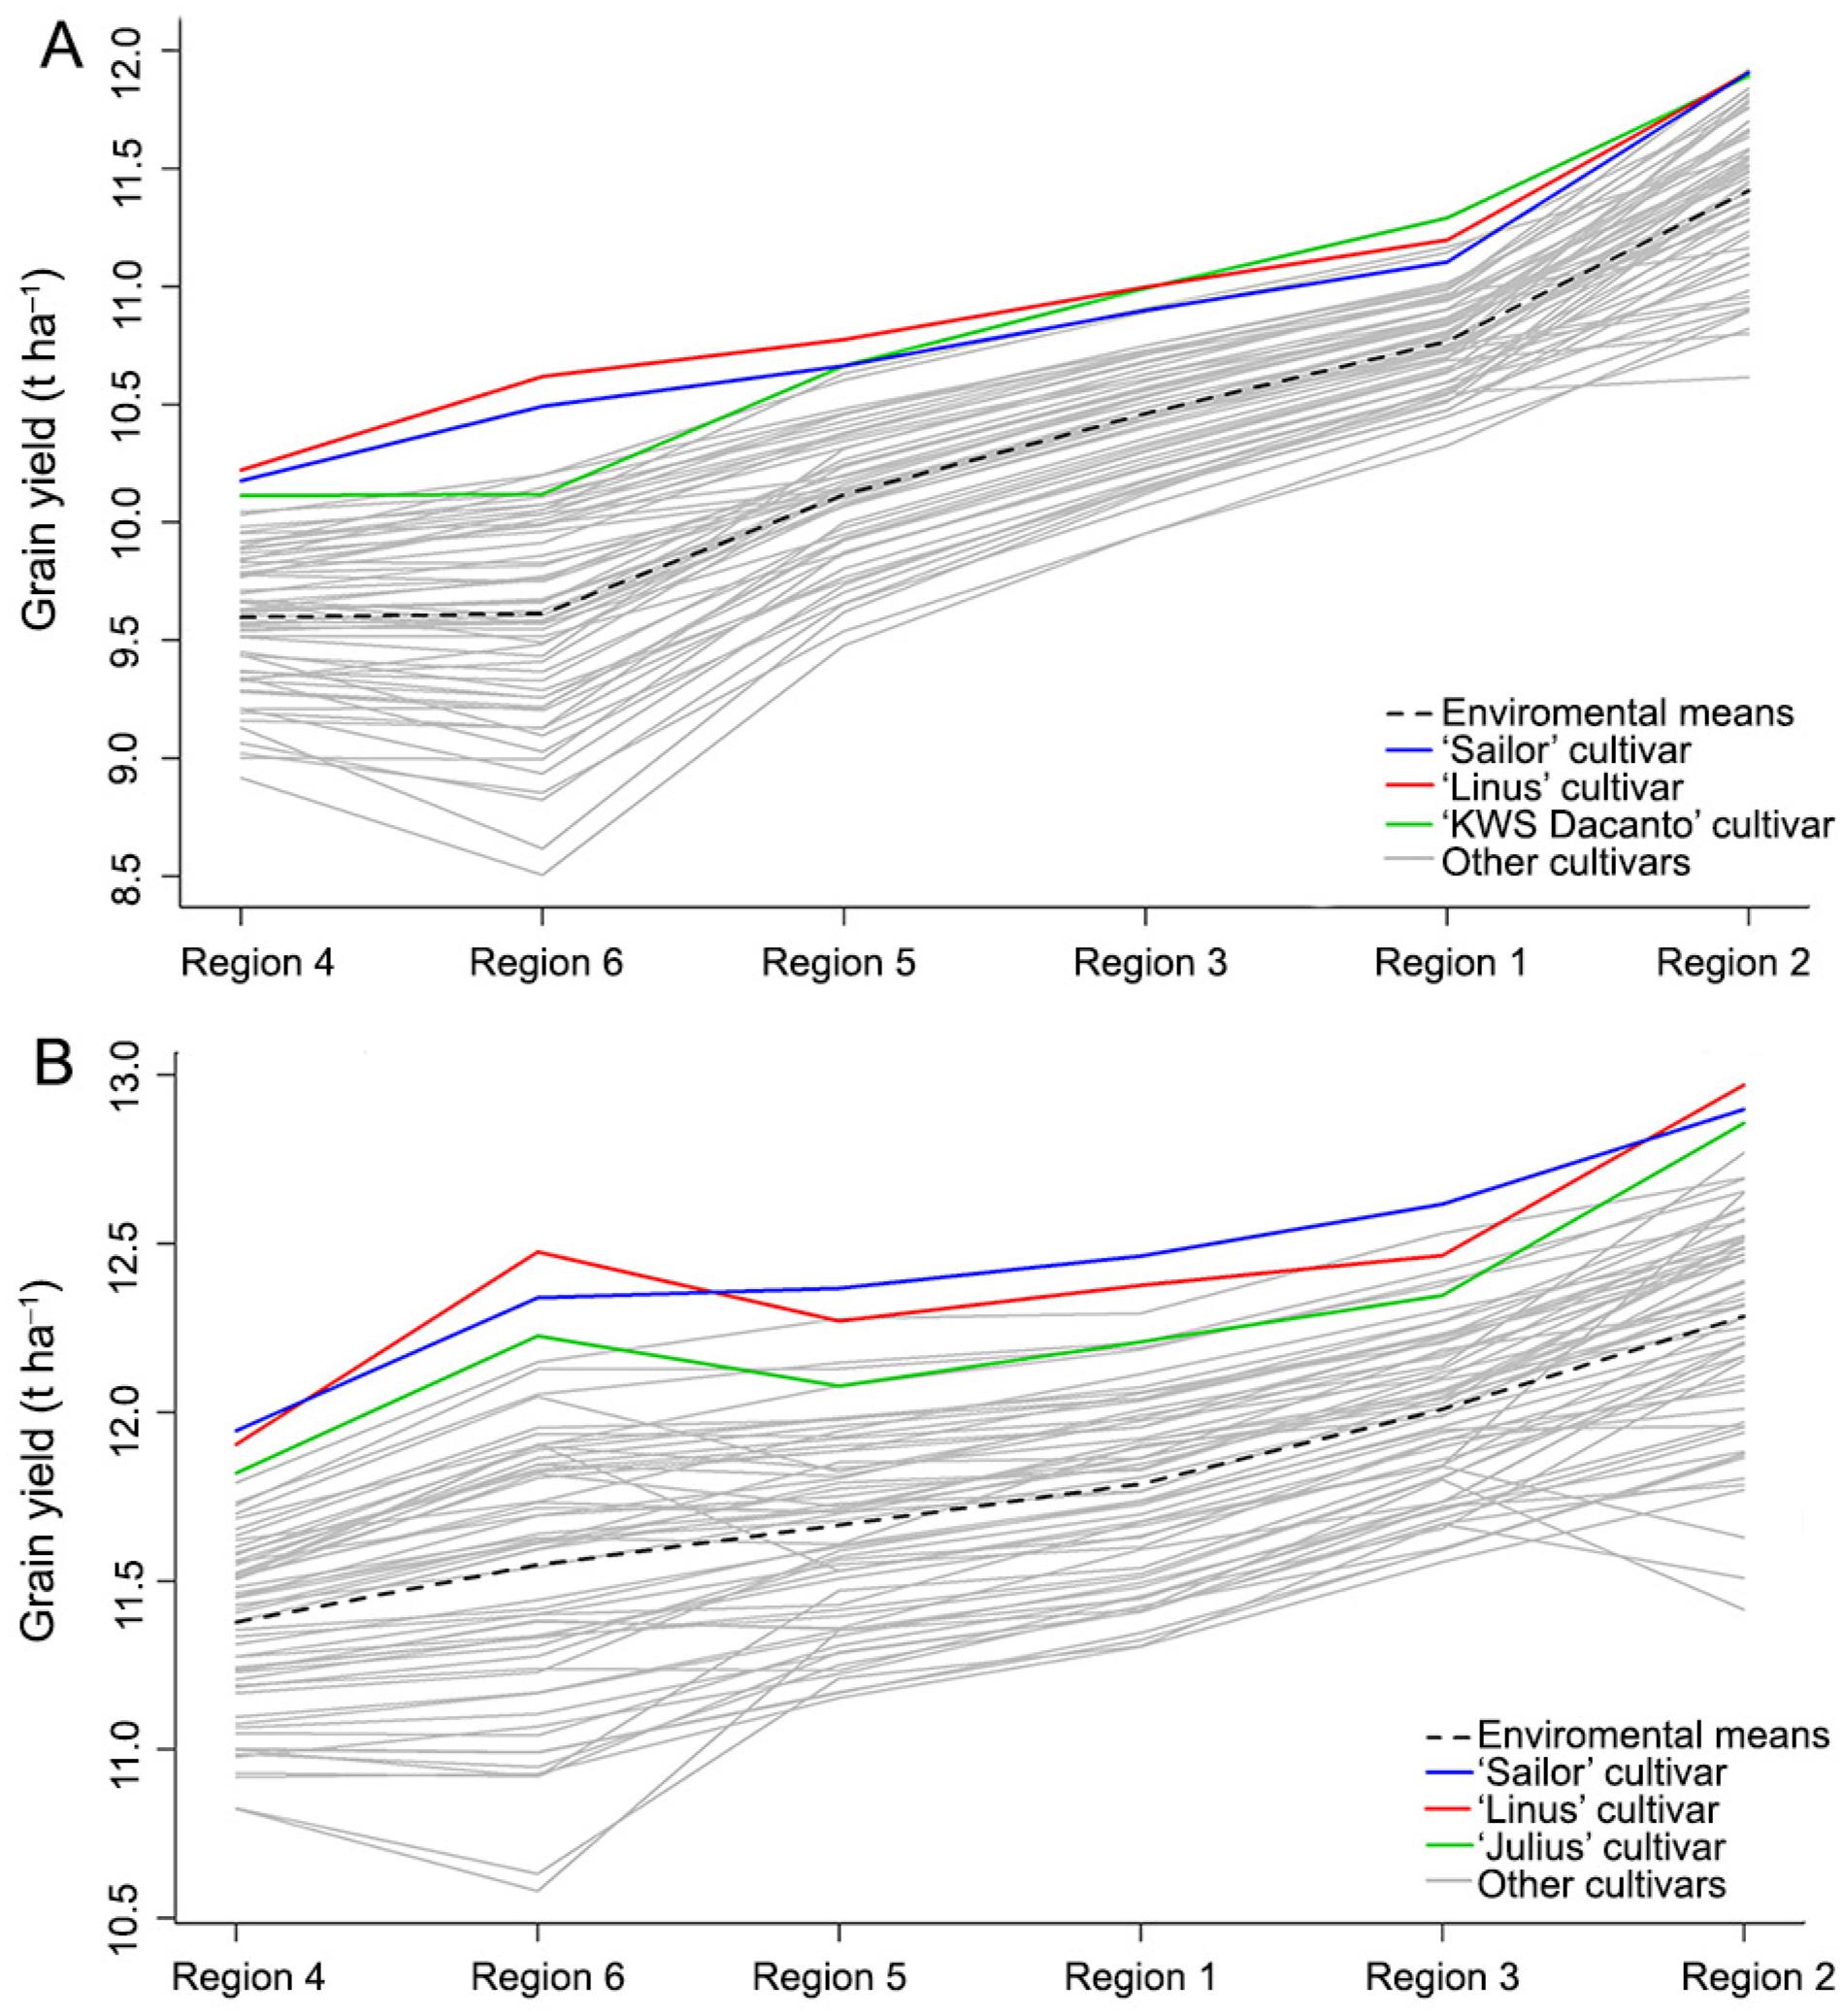
Based on the adjusted means for cultivar × agroecological region calculated for MIM, we noted three superior cultivars, KWS Dacanto, Linus and Sailor, across all agro-ecological regions in Poland (Figure 2A). The GGE plot (Figure 3A) also suggests that these three cultivars were widely adapted to all agro-ecological regions at the MIM level. Additionally, the GGE plot suggests a similarity in adaptations of cultivars (similar rankings of cultivars) between regions 1, 3 and 5 and between regions 4 and 6.
The cultivars yield adaptive response patterns across six agro-ecological regions for moderate-input (A) and high-input (B) crop management intensities. The agro-ecological regions are ranked according to their general means.
The GGE biplot based on adjusted means of the cultivar × agro-ecological region combinations for moderate-input (A) and high-input (B) crop management intensities; PC = principal component; TSS = total sum of square.
In HIM crop management intensity, TOP5 equal to 100 % was registered in region 2 for cultivars Julius, Linus and Sailor, in region 4 for Julius and in region 5 for Linus. The highest values of the TOP5 parameter in regions 1, 3 and 6 were observed for Julius and Linus. In the case of HIM crop management intensity, Julius, Linus and Sailor were characterized by wide adaptation to trial locations across the regions studied. Cultivar Julius had a TOP5 above 60 % in all agro-ecological regions (the lowest value of this parameter was observed in region 5 - 64 %). For Linus, the TOP5 parameter was lowest in regions 1 and 4 (TOP5 - 80 % for both regions). For the Sailor cultivar, the lowest value of the TOP5 parameter was observed in region 3 (TOP5 - 45 %).
As regards HIM crop management intensity, we identified cultivars Julius, Linus and Sailor as superior (Figure 2B) across all agro-ecological regions in Poland based on adjusted means for cultivar × agro-ecological region. The GGE plot (Figure 3B) also suggests that these three cultivars were widely adapted to all agro-ecological regions at HIM. This plot suggests a similarity in adaptations of cultivars between regions 1, 3 and 5 as well as between regions 2, 4 and 6.
We observed incompatibility of the cultivar yield rankings between years in each agro-ecological region (Figure 4). Spearman's rank correlation coefficients were far below 0.70 and often negative. Spearman's rank correlation coefficients were also different for the two crop management intensities. The best compatibility of the cultivar yield ranking between years was observed for agroecological region number 6 for MIM crop management.
Spearman's rank correlation coefficients across tested years in each agro-ecological region for each intensity (moderate-input management (MIM) - upper triangle, high-input management (HIM) - lower triangle).
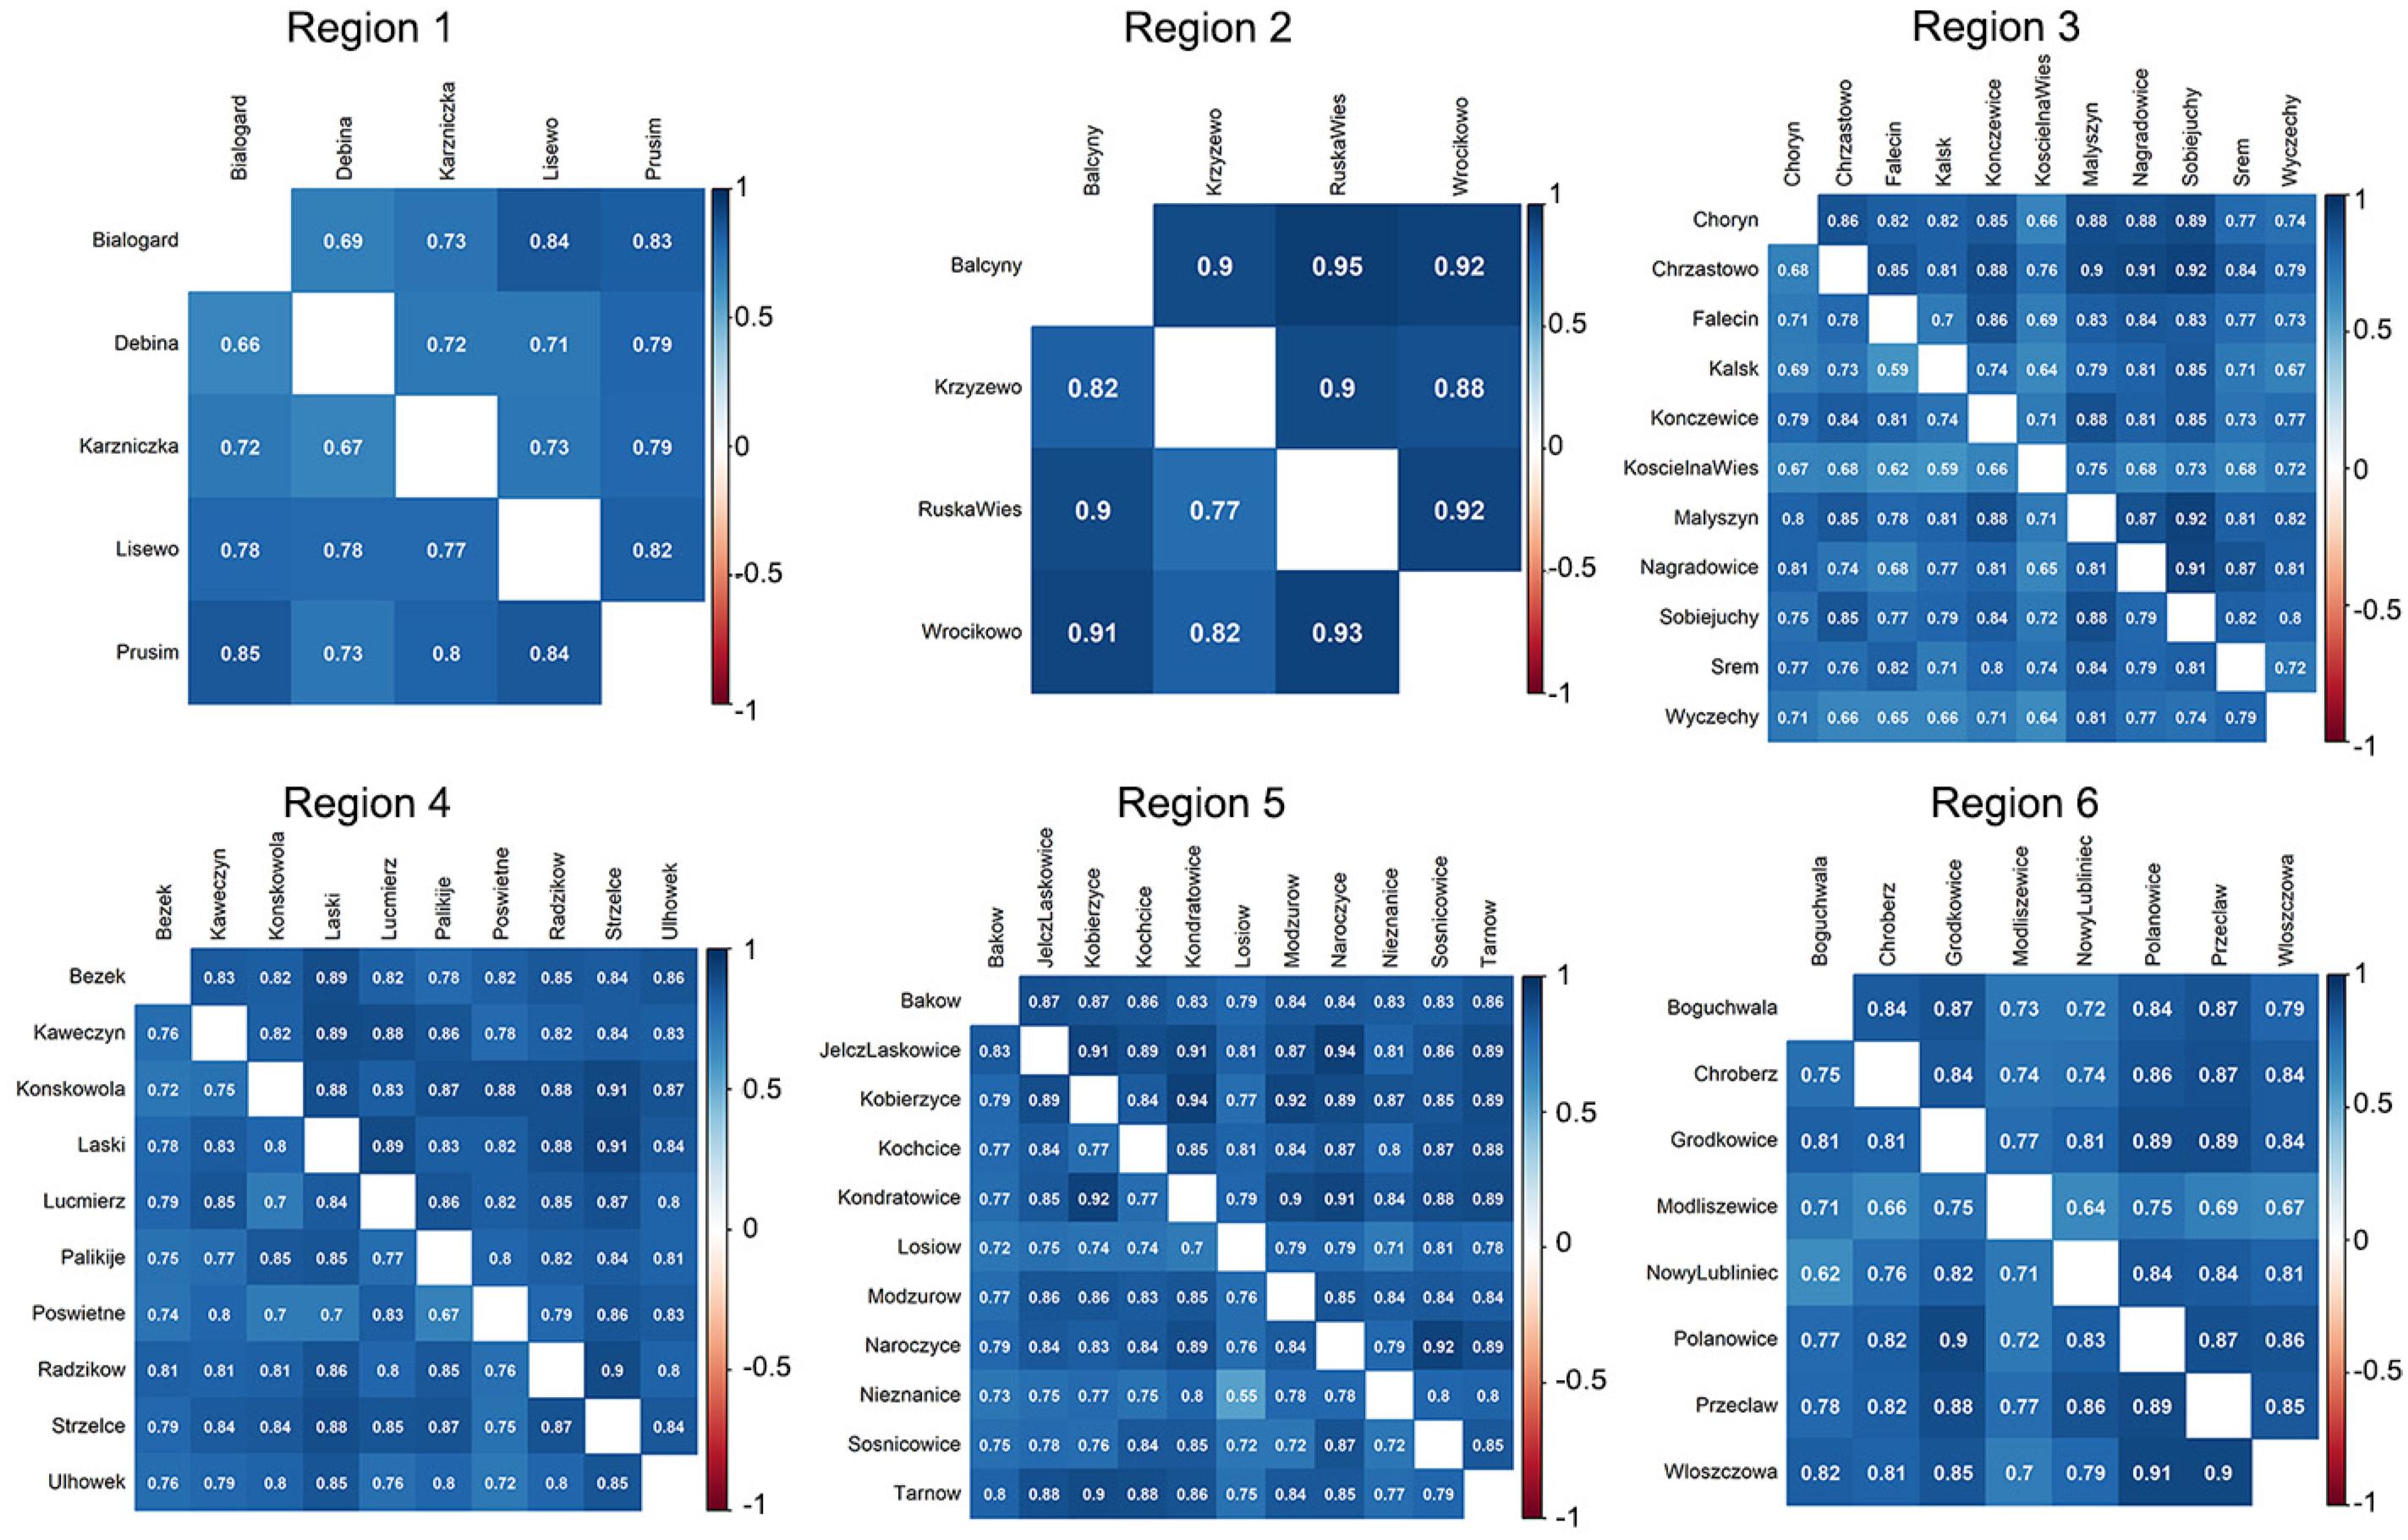
Spearman's rank correlation coefficients between locations in each agro-ecological region (Figure 5) were high and very often above 0.7. Only in two cases did this statistic have lower values - between 0.55 and 0.6 (in agro-ecological region 5 - 0.55 and in agro-ecological region 3 - 0.59). This result shows high compatibility of rankings between locations in the regions, in contrast to the rankings between years in these regions. Ranking compatibility between locations in agro-ecological regions was similar for both crop management intensities.
Spearman's rank correlation coefficients across trial locations in each agro-ecological region for each intensity (moderate-input management (MIM) - upper triangle, high-input management (HIM) - lower triangle).
Discussion
The variability of the winter wheat yield in the METs data studied was in the main determined by environmental effects (agro-ecological regions, years and their interactions) and slightly by cultivar effect. The interaction between years and locations nested in agroecological regions accounted for over 50 % of winter wheat yield variability. The second most important effect influencing yield variability is year (the main effect). We observed significant differences in soil and climatic conditions between the agro-ecological regions, especially the weather in respective cropping seasons (sometimes dry, hot summers or/and very harsh winters). The strong effect of interaction between years and agro-ecological regions and interaction between years and locations nested in agro-ecological regions indicates different yield reaction in regions and locations under similar weather conditions for different years.
The strong influence of agro-ecological region and year effects on the yield was observed for both crop management intensities and was similar for all effects studied. This finding may indirectly indicate a lack of or weak interactions between crop management and the rest of the effects (year, cultivars, region and location nested in region). It does not mean that the yield remains the same for both crop management intensities. It would be more useful to consider the crop management intensity as an additional effect in the linear mixed model. However, that would complicate our model even more and increase the errors for BLUP, BLUE and variance parameters. As a result, we decided not to include this effect and perform the model twice for both crop management intensities. However, many previous studies showed significant influence of crop management intensities on yield (Cornish, 1987Cornish, PS. 1987. Crop and pasture plant selection for new cultural systems. p. 335-378. In: Cornish, P.S.; Pratley, J.E., eds. Tillage: new directions in Australian agriculture. INKATA Press, Melbourne, Australia.; Cooper et al., 1996Cooper, M.; Brennan, P.S.; Sheppard, J.A. 1996. A strategy for yield improvement of wheat which accommodates large genotype by environment interactions. CAB International, Walingford, UK.; Cooper et al., 2001Cooper, M.; Woodruft, D.R.; Philips, I.G.; Basford, K.E.; Golmour, A.R. 2001. Genotype by management interactions for grain yield and grain protein concentration of wheat. Field Crop Research 69: 47-67.; Vlachostergios and Roupakias, 2008Vlachostergios, D.N.; Roupakias, D. G. 2008. Response to conventional and organic environment of thirty-six lentil (Lens culinaris Medik.) varieties. Euphytica 163: 449-457.). The results from similar METs data analysis from this part of Europe also indicated a significant impact of crop management intensity (Laidig et al., 2014Laidig, F.; Piepho, H.P.; Drobek, T.; Meyer, U. 2014. Genetic and non-genetic long-term trends of 12 different crops in German official variety performance trials and on-farm yield trends. Theoretical and Applied Genetics 127: 2599-2617.; Rozbicki et al., 2015Rozbicki, J.; Ceglińska, A.; Gozdowski, D.; Jakubczak, M.; Cacak-Pietrzak, G.; Mądry, W.; Golba, J.; Piechociński, M.; Sobczyński, G.; Studnicki, M.; Drzazga, T. 2015. Influence of the cultivar, environment and management on the grain yield and bread-making quality in winter wheat. Journal of Cereal Science 61: 126-132.; Studnicki et al., 2015Studnicki, M.; Mądry, W.; Derejko, A.; Noras, K.; Wójcik-Gront, E. 2015. Four-way data analysis within the linear mixed modelling framework. Scientia Agricola 72: 411-419.).
In the European Union, all cultivars included in the Common Catalogues of Varieties of Agriculture Plant Species (CCA) can be grown without limitation in each member state. Thus, the number of cultivars available to a farmer is very high. In many countries around the world, cultivar recommendation systems exist to help farmers select suitable cultivars. Depending on the state, these systems are held by governmental or non-governmental organizations. These cultivar recommendations should be tailored to a specific agro-ecological region and given based on cultivar performance in this region. It is desirable for plant breeders that cultivars are well adapted to the largest number of agro-ecological regions possible. These kinds of cultivars are widely adapted to different agro-ecological regions. Yan and Kang (2003)Yan, W.; Kang, M.S. 2003. GGE biplot analysis: a graphical tool for breeders, geneticists, and agronomists. CRC Press, Boca Raton, FL, USA. called the widely adapted cultivars “ideal cultivars”. Based on our study, out of 62 variants, we singled out a few widely adapted cultivars; two are particularly noteworthy, Sailor and Linus. These were widely adapted to all agro-ecological regions for both crop management intensities. These two cultivars have a high probability of obtaining high yields in all agroecological regions as well as with both crop management intensities studied.
To identify the cultivars widely adapted to all agroecological regions and for the two crop management intensities, we used two different approaches - simple (TOP5 parameters and adjusted means) and advanced (GGE). Both of the methods we used led to the same conclusions about adaptation patterns of the winter wheat cultivars for different agro-ecological regions and crop management intensities. The proposed statistical methods (LMM, rank correlation, GGE biplot) could be used frequently and reliably by plant breeders (Ahmadi et al., 2012Ahmadi, J.; Mohammadi, A.; Najafi Mirak, T. 2012. Targeting promising bread wheat (Triticum aestivum L.) lines for cold climate growing environments using AMMI and SREG GGE biplot analysis. Journal of Agricultural Science and Technology 14: 645-657.). The GGE aided in the comparison of the adaptability response of cultivars in different regions and identification of winter wheat cultivars suitable for all agro-ecological regions. We think that these methods can be successfully used to determine cultivars suitable for specific agro-ecological regions and, based on this, to make recommendations for farmers. The proposed statistical approaches can be successfully used as a comprehensive approach for the recommendation of cultivars from different species and different types of METs.
In this work, we found that the compatibility of cultivar yield rankings between the growing seasons in agro-ecological regions studied was weak. This is the result of a relatively strong year effect and especially of the interaction effect between cultivar and location nested in regions with year. Many former studies on this topic were carried out separately in each year (Redden et al., 2000Redden, R.J.; DeLacy, I.H.; Butler, D.G.; Usher, T. 2000. Analysis of line x environment interactions for yield in navy beans. 2. Pattern analysis of lines and environment within years. Australian Journal of Agricultural Research 51: 607-617.; Thapa et al., 2009Thapa, D.B.; Sharma, R.C.; Mudwari, A.; Ortiz-Ferrara, G.; Sharma, S.; Basnet, R.K.; Witcombe, J.R.; Virk, D.S.; Joshi, K.D. 2009. Identifying superior wheat cultivars in participatory research on resource poor farms. Field Crop Research 112: 124-130.). These cultivar evaluations and recommendations are hardly ever credible and thus might not be very useful for farmers. In each growing season, the weather is different and largely does not repeat in the following season. It is better to make cultivar recommendations based on trials carried out over a few consecutive years using the yield adjusted means. These approaches help to evaluate cultivar adaptation and to select cultivars with broad adaptation to environmental conditions (Windhausen et al., 2012Windhausen, V.S.; Wagener, S.; Magorokosho, C.; Makumbi, D.; Vivek, B.; Piepho, H.P.; Melchinger, A.E.; Atlin, G.N. 2012. Strategies to subdivide a target population of environments: results from the CIMMYT-led maize hybrid testing programs in Africa. Crop Science 52: 2143-2152.). This method contributes to more accurate cultivar recommendation for farmers. When cultivars are evaluated over several years, the assessment is more reliable and cultivar means are characterized by a smaller error of estimation. In this study, we evaluated the cultivars under different weather conditions over five growing seasons. However, due to the heavy rotation of cultivars available on the market, cultivar evaluations over a large number of years are often impossible. Studies showed that reliable recommendations of cultivars could be accomplished based on data from three to four growing seasons (years) (Ryan et al., 2004Ryan, M.H.; Derrick, J.W.; Dann, P.R. 2004. Grain mineral concentrations and yield of wheat grown under organic and conventional management. Journal of the Science of Food and Agriculture 84: 207-216.; Vlachostergios and Roupakias, 2008Vlachostergios, D.N.; Roupakias, D. G. 2008. Response to conventional and organic environment of thirty-six lentil (Lens culinaris Medik.) varieties. Euphytica 163: 449-457.).
Compatibility of the cultivar yield rankings between the growing seasons in agro-ecological regions studied was dissimilar for the two crop management intensities considered. Generally, in the case of HIM, Spearman's rank correlation coefficients were slightly higher than for MIM, which means that HIM was characterized by slightly better compatibility. The exceptions were in two agro-ecological regions, 4 and 6, where for the MIM crop management intensity the compatibility of the cultivar rankings between years was slightly greater than for HIM.
Opposite results were obtained for the compatibility of the cultivar yield rankings between locations in agro-ecological regions. For most pairs of locations in regions, Spearman's rank correlation coefficients were positive and above 0.70. This result means that within an agro-ecological region, the trial locations differentiated the winter wheat yield in the same way. Additionally, compatibility ranking between locations was independent of the crop management intensity. This is the result of the much stronger impact of the environmental effects (season, location, region) on the winter wheat yield than of crop management intensity. In each region used in our study, not a single trial location was characterized by a yield ranking different from others in the region. Therefore, each location from a region can adequately reflect (and represent) the adaptation patterns of the cultivars studied. We could consider any trial location in the agro-ecological region as a key location. On this basis, the set of trial locations in each region was representative as regards climatic and soil conditions common to this region. High compatibility of the cultivar rankings in trial locations also provides high precision when determining regions. Well-defined agro-ecological regions increase the chance of proper cultivar recommendations and can thus guarantee optimal winter wheat yield for farmers in this region.
References
- Ahmadi, J.; Mohammadi, A.; Najafi Mirak, T. 2012. Targeting promising bread wheat (Triticum aestivum L.) lines for cold climate growing environments using AMMI and SREG GGE biplot analysis. Journal of Agricultural Science and Technology 14: 645-657.
- Annicchiarico, P.; Chiapparino, E.; Perenzin, M. 2010. Response of common wheat varieties to organic and conventional production systems across Italian locations, and implications for selection. Field Crops Research 116: 230-238.
- Barrero Farfan, I.D.; Murray, S.C.; Labar, S.; Pietsch, D. 2013. A multi-environment trial analysis shows slight grain yield improvement in Texas commercial maize. Field Crop Research 149: 167-176.
- Cooper, M.; Brennan, P.S.; Sheppard, J.A. 1996. A strategy for yield improvement of wheat which accommodates large genotype by environment interactions. CAB International, Walingford, UK.
- Cooper, M.; Woodruft, D.R.; Philips, I.G.; Basford, K.E.; Golmour, A.R. 2001. Genotype by management interactions for grain yield and grain protein concentration of wheat. Field Crop Research 69: 47-67.
- Cornish, PS. 1987. Crop and pasture plant selection for new cultural systems. p. 335-378. In: Cornish, P.S.; Pratley, J.E., eds. Tillage: new directions in Australian agriculture. INKATA Press, Melbourne, Australia.
- Ebdon, J.S.; Gauch, H.G. 2002. Additive main effect and multiplicative interactions analysis of national turfgrass performance trials: interpretation of genotype × environment interactions. Crop Science 42: 489-496.
- Eckl, T.; Piepho, H.P. 2015. Analysis of series of cultivar trials with perennial grasses for subdivided target regions. Crop Science 55: 597-609.
- Fox, P.N.; Skovmand, B.; Thompson, B.K.; Braun, H.J.; Cormier, R. 1990. Yield and adaptation of hexaploid spring triticale. Euphytica 47: 57-64.
- Gilmour, A.R.; Gogel, B.J.; Cullis, B.R.; Thompson, R. 2009. ASReml User Guide Release 3.0. VSN International, Hemel Hempstead, UK.
- Hodson, D.P.; White, J.W. 2007. Use of spatial analyses for global characterization of wheat-based production systems. The Journal of Agricultural Science 145: 115-125.
- Laidig, F.; Piepho, H.P.; Drobek, T.; Meyer, U. 2014. Genetic and non-genetic long-term trends of 12 different crops in German official variety performance trials and on-farm yield trends. Theoretical and Applied Genetics 127: 2599-2617.
- Liu, S.M.; Constable, G.A.; Reid, PE.; Stiller, W.N.; Cullis, B.R. 2013. The interaction between breeding and crop management in improved cotton yield. Field Crop Research 148: 49-60.
- Mandal, N.P; Sinha, PK.; Variar, M.; Shukla, V.D.; Perraju, P; Mehta, A.; Pathak, A.R.; Dwivedi, J.L.; Rathi, S.P.S.; Bhandarkar, S.; Singh, B.N.; Singh, D.N.; Panda, S.; Mishra, N.C.; Singh, Y.V.; Pandya, R. 2010. Implications of genotype x input interactions in breeding superior genotypes for favorable and unfavorable rainfed upland environments. Field Crop Research 118: 35-144.
- Munaro, L.B.; Benin, G.; Marchioro, V.S.; Assis Franco, F.; Silva, R.R.; Silva, C.L.; Beche, E. 2014. Brazilian spring wheat homogeneous adaptation regions can be dissected in major megaenvironments. Crop Science 54: 1374-1383.
- Piepho, H.P.; Nazir, M.F.; Qamar, M.; Rattu, A.R.; Riaz-ud-Din; Hussain, M.; Ahmad, G.; Subhan, F.; Ahmad, J.; Laghari, A.K.B.L.; Vistro, I.A.; Kakar, M.S.; Sial, M.A.; Imtiaz, M. 2016. Stability analysis for a countrywide series of wheat trials in Pakistan. Crop Science 56: 2465-2475.
- Redden, R.J.; DeLacy, I.H.; Butler, D.G.; Usher, T. 2000. Analysis of line x environment interactions for yield in navy beans. 2. Pattern analysis of lines and environment within years. Australian Journal of Agricultural Research 51: 607-617.
- Rozbicki, J.; Ceglińska, A.; Gozdowski, D.; Jakubczak, M.; Cacak-Pietrzak, G.; Mądry, W.; Golba, J.; Piechociński, M.; Sobczyński, G.; Studnicki, M.; Drzazga, T. 2015. Influence of the cultivar, environment and management on the grain yield and bread-making quality in winter wheat. Journal of Cereal Science 61: 126-132.
- Rweyongeza, D. 2011. Pattern of genotype-environment interaction in Picea glauca (Moench) Voss in Alberta, Canada. Annals of Forest Science 68: 245-253.
- Ryan, M.H.; Derrick, J.W.; Dann, P.R. 2004. Grain mineral concentrations and yield of wheat grown under organic and conventional management. Journal of the Science of Food and Agriculture 84: 207-216.
- Smith, A.; Ganesalingam, A.; Kuchel, H.; Cullis, B.R. 2015. Factor analytic mixed models for the provision of grower information from national crop variety testing programs. Theoretical and Applied Genetics 128: 55-72.
- Studnicki, M.; Mądry, W.; Derejko, A.; Noras, K.; Wójcik-Gront, E. 2015. Four-way data analysis within the linear mixed modelling framework. Scientia Agricola 72: 411-419.
- Tapley, M.; Ortiz, B.V.; van Santen, E.; Balkcom, K.S.; Mask, P.; Weaver, D.B. 2013. Location, seeding date, and variety interactions on winter wheat yield in southeastern United States. Agronomy Journal 105: 509-518.
- Thapa, D.B.; Sharma, R.C.; Mudwari, A.; Ortiz-Ferrara, G.; Sharma, S.; Basnet, R.K.; Witcombe, J.R.; Virk, D.S.; Joshi, K.D. 2009. Identifying superior wheat cultivars in participatory research on resource poor farms. Field Crop Research 112: 124-130.
- Vlachostergios, D.N.; Roupakias, D. G. 2008. Response to conventional and organic environment of thirty-six lentil (Lens culinaris Medik.) varieties. Euphytica 163: 449-457.
- Welham, S.; Cullis, B.; Gogel, B.; Gilmour, A.; Thompson, R. 2004. Prediction in linear mixed models. Australian & New Zealand Journal of Statistics 46: 325-347.
- Windhausen, V.S.; Wagener, S.; Magorokosho, C.; Makumbi, D.; Vivek, B.; Piepho, H.P.; Melchinger, A.E.; Atlin, G.N. 2012. Strategies to subdivide a target population of environments: results from the CIMMYT-led maize hybrid testing programs in Africa. Crop Science 52: 2143-2152.
- Yan, W.; Hunt, L.A.; Sheng, Q.; Szlavnics, Z. 2000. Cultivar evaluation and mega-environment investigation based on the GGE biplot. Crop Science 40: 597-605.
- Yan, W.; Kang, M.S. 2003. GGE biplot analysis: a graphical tool for breeders, geneticists, and agronomists. CRC Press, Boca Raton, FL, USA.
- Yang, R.C. 2002. Likelihood-based analysis of genotype-environment interaction. Crop Science 42: 1434-1440.
Edited by
Publication Dates
-
Publication in this collection
Mar-Apr 2019
History
-
Received
23 May 2017 -
Accepted
30 Oct 2017