ABSTRACT
Characterization of the spatial variability of vegetative vigor in vineyards can help improve the performance of site-specific management practices, or the management of vineyards with different rates. Characterization using canopy proximal sensing has been a widely disseminated technique; however, vineyards in southeastern Brazil, where the utilization of annual double pruning results in a winter harvest, knowledge of the role of variability in improving vineyard management has not yet been applied. This study aimed to determine if post-veraison mapping of a normalized difference vegetation index could be used to assess the variability in grapevine vigor, water status, physiology, yield and berry quality attributes at harvest in an irrigated vineyard in southeastern Brazil. This normalized difference vegetation index was measured with an active canopy sensor, and spatial distribution maps over two growing seasons of a vineyard, managed on an annual double pruning basis, were generated. Attributes of physiological and technological berry maturation, leaf water potential, gas exchange, production, and fresh pruning weight were calculated. These normalized difference vegetation index maps allowed for the determination of variability in vegetative vigor and the productive potential of the vineyard; however, high levels of rainfall during the maturation period may reduce the potential of using these maps for determining berry parameters.
Vitis vinifera L.; precision viticulture; proximal sensing; vegetative vigor; grape quality
Introduction
Despite the increased yield and quality of wine grapes already achieved by winemakers through classical and traditional vineyard management practices, improvements through precision viticulture (PV) are still possible, and they require the use of new technologies in vineyards (Ozdemir et al., 2017Ozdemir, G.; Sessiz, A.; Pekitkan, F.G. 2017. Precision viticulture tools to production of high quality grapes. Horticulture 61: 209-218.). One of the new technologies with considerable potential is the remote ascertaining of vegetative indices of vines (Bonilla et al., 2015Bonilla, I.; Martínez De Toda, F.; Martínez-Casasnovas, J.A. 2015. Vine vigor, yield and grape quality assessment by airborne remote sensing over three years: analysis of unexpected relationships in cv. Tempranillo. Spanish Journal of Agricultural Research 13: 1-8.; Hall et al., 2011Hall, A.; Lamb, D.W.; Holzapfel, B.P.; Louis, J.P. 2011. Within-season temporal variation in correlations between vineyard canopy and winegrape composition and yield. Precision Agriculture 12: 103-117.; Romero et al., 2018Romero, M.; Luo, Y.; Su, B.; Fuentes, S. 2018. Vineyard water status estimation using multispectral imagery from an UAV platform and machine learning algorithms for irrigation scheduling management. Computers and Electronics in Agriculture 147: 109-117.). It facilitates the determination of the variability of several plant parameters, allowing for the definition of homogeneous zones for site-specific management (variable rate application of fertilizer and water, selective harvesting, etc.), which promotes the reduction of input consumption and increases vineyard quality and yield.
The normalized difference vegetation index (NDVI) is a dependable indicator of the development and vegetative vigor of vines (Bonilla et al., 2015Bonilla, I.; Martínez De Toda, F.; Martínez-Casasnovas, J.A. 2015. Vine vigor, yield and grape quality assessment by airborne remote sensing over three years: analysis of unexpected relationships in cv. Tempranillo. Spanish Journal of Agricultural Research 13: 1-8.; Junges et al., 2017Junges, A.H.; Fontana, D.C.; Anzanello, R.; Bremm, C. 2017. Normalized difference vegetation index obtained by ground-based remote sensing to characterize vine cycle in Rio Grande do Sul, Brazil. Ciência e Agrotecnologia 41: 543-553.). It is also often used to indicate the plant water status (Cancela et al., 2017Cancela, J.J.; Fandiño, M.; Rey, B.J.; Dafonte, J.; González, X.P. 2017. Discrimination of irrigation water management effects in pergola trellis system vineyards using a vegetation and soil index. Agricultural Water Management 183: 70-77.; González-Flor et al., 2014González-Flor, C.; Serrano, L.; Gorchs, G.; Pons, J.M. 2014. Assessment of grape yield and composition using reflectance-based indices in rainfed vineyards. Agronomy Journal 106: 1309-1316.), since vigor may be correlated with water status (González-Flor et al., 2014González-Flor, C.; Serrano, L.; Gorchs, G.; Pons, J.M. 2014. Assessment of grape yield and composition using reflectance-based indices in rainfed vineyards. Agronomy Journal 106: 1309-1316.). These factors, in turn, influence grape quality and production (Cancela et al., 2017Cancela, J.J.; Fandiño, M.; Rey, B.J.; Dafonte, J.; González, X.P. 2017. Discrimination of irrigation water management effects in pergola trellis system vineyards using a vegetation and soil index. Agricultural Water Management 183: 70-77.; Hall et al., 2011Hall, A.; Lamb, D.W.; Holzapfel, B.P.; Louis, J.P. 2011. Within-season temporal variation in correlations between vineyard canopy and winegrape composition and yield. Precision Agriculture 12: 103-117.), making the NDVI an indirect indicator of berry composition and vine production parameters. However, studies analyzing NDVI in vineyards and characterizing the quality of berries show contradictory results (Bonilla et al., 2015Bonilla, I.; Martínez De Toda, F.; Martínez-Casasnovas, J.A. 2015. Vine vigor, yield and grape quality assessment by airborne remote sensing over three years: analysis of unexpected relationships in cv. Tempranillo. Spanish Journal of Agricultural Research 13: 1-8.; Hall et al., 2011Hall, A.; Lamb, D.W.; Holzapfel, B.P.; Louis, J.P. 2011. Within-season temporal variation in correlations between vineyard canopy and winegrape composition and yield. Precision Agriculture 12: 103-117.; King et al., 2014King, P.D.; Smart, R.E.; McClellan, D.J. 2014. Within-vineyard variability in vine vegetative growth, yield, and fruit and wine composition of Cabernet Sauvignon in Hawke’s Bay, New Zealand. Australian Journal of Grape and Wine Research 20: 234-246.; Marciniak et al., 2015Marciniak, M.; Brown, R.; Reynolds, A.; Jollineau, M. 2015. Use of remote sensing to understand the terroir of the Niagara Peninsula: applications in a riesling vineyard. Journal International des Sciences de la Vigne et du Vin 49: 1-26.), especially with regard to water deficit (González-Flor et al., 2014González-Flor, C.; Serrano, L.; Gorchs, G.; Pons, J.M. 2014. Assessment of grape yield and composition using reflectance-based indices in rainfed vineyards. Agronomy Journal 106: 1309-1316.) and climatic conditions (Marciniak et al., 2015Marciniak, M.; Brown, R.; Reynolds, A.; Jollineau, M. 2015. Use of remote sensing to understand the terroir of the Niagara Peninsula: applications in a riesling vineyard. Journal International des Sciences de la Vigne et du Vin 49: 1-26.).
Over the last 15 years, southeastern Brazil has risen to prominence in the national scenario of fine wine production, due to the increase in grape quality brought about by the annual double pruning carried out in the vineyards (Lima, 2016Lima, I.M. 2016. The new frontier of Brazilian wine production = A nova fronteira da produção de vinhos brasileiros. Available at: https://paladar.estadao.com.br/noticias/bebida,a-nova-fronteira-da-producao-de-vinhos-brasileiros,10000066798 [Accessed July 7, 2019] (in Portuguese).
https://paladar.estadao.com.br/noticias/...
). Double pruning enables harvesting in the winter, which is characterized in this region by strong sunshine, low rainfall, and a wide temperature range. These conditions favor the synthesis and accumulation of sugars and phenolic compounds in the berries (Mota et al., 2010a).
This study is the first attempt to determine if post-veraison mapping of the NDVI could be used to assess variability in grapevine vigor, water status, physiology, yield and berry quality attributes at harvest in an irrigated vineyard in southeastern Brazil.
Materials and Methods
Site and characteristics of the study area
The trial was carried out in the municipality of Espírito Santo do Pinhal, in the state of São Paulo, Brazil, in a commercial vineyard located at 22°10’49.1” S and 46°44’28.4” W, with an average altitude of 875 m, for two growing seasons (2017 and 2018). The vineyard of the Vitis vinifera L. cv. Chardonnay grafted onto a Paulsen 1103 rootstock was planted in 2008, with a spacing of 2.5 m between rows and 1.0 m between plants. Vines were grown in a vertical trellis system (east-west oriented) and trained on a unilateral Royat cordon. The vineyard was divided into two areas, labeled as area 1 and area 2, and were 0.6 and 0.5 ha, respectively. Annual double pruning (Dias et al., 2017Dias, F.A.N.; Mota, R.V.; Souza, C.R.; Pimentel, R.M.A.; Souza, L.C.; Souza, A.L.; Regina, M.A. 2017. Rootstock on vine performance and wine quality of ‘Syrah’ under double pruning management. Scientia Agricola 74: 134-141.; Souza et al., 2015Souza, C.R.; Mota, R.V.; Dias, F.A.N.; Melo, E.T.; Souza, L.C.; Souza, A.L.; Pimentel, R.M.A.; Regina, M.A. 2015. Starch accumulation and agronomical performance of ‘Syrah’ under winter cycle: responses to pruning and ethephon management. Vitis 54: 195-201.) was used in this vineyard, with plant formation pruning carried out in July and Aug and production pruning performed in Jan.
The vines were irrigated during the plant formation and growing seasons using a drip system, with one lateral line for each row of vines and one emitter every 0.5 m (two emitters per vine) with a mean flow rate of 1.8 and 2.0 L h1 in areas 1 and 2, respectively. The vineyard soil in area 1 was classified as a complex of Inceptisols and Entisols (Orthents), according to the U.S. Soil Taxonomy compilation (Soil Survey Staff, 2014Soil Survey Staff. 2014. Keys to Soil Taxonomy. 12ed. USDA-Natural Resources Conservation Service, Washington, DC, USA.); the vineyard soil in area 2 was classified as an association of the same soil types. According to Köppen’s classification, the climate is Cwa, which refers to humid subtropical climates with dry winters and hot summers (Alvares et al., 2013Alvares, C.A.; Stape, J.L.; Sentelhas, P.C.; Gonçalves, J.L.M.; Sparovek, G. 2013. Köppen’s climate classification map for Brazil. Meteorologische Zeitschrift 22: 711-728.). Figure 1 shows the summary of the climatic conditions of the period corresponding to the two growing seasons assessed.
– Mean monthly rainfall (R), daily air temperature (T mean) and reference evapotranspiration (ETo) observed during the 2017 and 2018 growing seasons, and between growing seasons.
Production pruning was concomitantly carried out in both areas of the vineyard on Jan 4 in both 2017 and 2018 (Table 1). In 2017, two buds per spur were maintained for area 1, whereas three buds per spur were maintained for area 2. In 2018, three buds per spur were maintained in both areas. Mechanical shoot trimming and cluster zone leaf removal were carried out 76 days after pruning (dap) in 2017 (ten days after the start of berries at the pea-sized stage), and on 64 dap in 2018 (four days before berries at the pea-sized stage). Side netting panels were installed in the lower third of the vine canopy on 91 dap in 2017 and 105 dap in 2018 in order to protect the clusters from bird attacks.
Vegetation index measures
Vine NDVI data were collected at four time points, two shortly post-veraison (beginning of maturation) and two on late maturation of each growing season, specifically on 99 and 120 dap in 2017 (13 Apr and 04 May, respectively), and on 103 and 124 dap in 2018 (17 Apr and 08 May, respectively). Data were collected to observe within-maturation changes following the studies conducted by Hall et al. (2011)Hall, A.; Lamb, D.W.; Holzapfel, B.P.; Louis, J.P. 2011. Within-season temporal variation in correlations between vineyard canopy and winegrape composition and yield. Precision Agriculture 12: 103-117., which identified greater correlation between the NDVI measured near the veraison and the berry attributes, production, and pruning weight. A Crop Circle ACS-430 active canopy sensor was used to collect reflectance data on wavelengths of 670 (red) and 780 nm (near infrared) for the determination of NDVI. The assessments were made by walking through all the vines in the vineyard with a view from the lowest point at a height of ~ 0.30 m from the top of the canopy with ten acquisitions per second. This height provided a bean width of ~ 0.25 m (calculated based on ~ 0.82 times the distance between the sensor and the target for a field-of-view ~ 40-45 degrees, according to the ACS-430 manufacturer’s manual) projected parallel to the plant row. Rover and base GNSS (Global Navigation Satellite System) receivers were used for georeferencing reflectance data, which enabled increased real-time positioning accuracy using the RTK (Real Time Kinematic) method.
Mapping of the vegetation index
Descriptive statistical analysis was performed, and outliers (mean ± three times the standard deviation) were removed from the NDVI data set of each measurement. Subsequently, geostatistical tools were used to interpolate the NDVI data, generated by automated semivariogram modeling and kriging within a moving window procedure in 5 × 5 m blocks and a moving window of, at most, 200 neighboring points for calculating experimental semivariograms, which were automatically adjusted using the exponential model. Geostatistical procedures were performed using the Vesper software (Variogram Estimation and Spatial Prediction Plus Error, version 1.62).
Sampling and determination of vine and grape berry attributes
The interpolated NDVI data were classified into three classes of values using the Jenks natural breaks optimization method. The class with the highest value of NDVI was considered as a high NDVI zone, and the two remaining classes with lower values were considered as low NDVI zones due to the low territorial extension of the class with the lowest values.
From the NDVI class maps obtained at 99 dap in 2017 and at 103 dap in 2018 (Figure 2A and C, respectively), 12 sampling plots were selected at random from each area of the vineyard, six of which were from the high NDVI zone and six from the low NDVI zone. Each sampling plot consisted of 14 vines belonging to two neighboring rows, with seven vines in each row.
– Spatial distribution of the normalized difference vegetation index (NDVI) at 99 (A) and 120 (B) days after pruning (dap) in 2017 growing season and at 103 (C) and 124 dap (D) in 2018 growing season in areas 1 and 2 of the vineyard. The central position of the berry sampling plots is located in high (white diamond) and low NDVI (red diamond) zones in A and C. The position of the sampling vines is located in high (white circle) and low NDVI (red circle) zones in B and D.
One vine from each sampling plot was used to monitor the water status of the vineyard during the maturation period of each growing season; this was assessed by measuring leaf water potential (ψ, MPa) at 106, 120, and 127 dap in 2017 (20 Apr, 04 May, and 11 May, respectively) and at 105, 106, 120, and 126 dap in 2018 (19 Apr, 20 Apr, 04 May, and 10 May, respectively). The measurements were taken at dawn (ψdawn), between 03h30 and 05h00, and in the morning (ψdiurnal), between 10h00 and 12h00, using a Scholander pressure chamber. One leaf from the middle section of the main shoot axis was collected from each vine and used for each measurement.
In the 2018 growing season, gas exchanges were measured using an infrared gas analyzer during the grape maturation period (105 and 126 dap; 19 Apr and 10 May, respectively). For each NDVI zone, six leaves exposed to the sun that were in the middle section of the main shoot, belonging to the same vines used for measuring ψ, were used. Measurements were taken during the morning (10h00) and again in the afternoon (13h00).
Both areas of the vineyard were harvested concomitantly in each growing season. A sample of 96 berries was collected at random from 12 vines in each sampling plot, two clusters per vine (Figure 3A), and four berries per cluster (Figure 3B). The clusters were selected to meet the requirement of using only one cluster per shoot from each vine, with one directly exposed to the sun, and another not directly exposed (Figure 3A). Four berries per cluster were sampled in a similar way using the procedure proposed by Trought and Bramley (2011)Trought, M.C.T.; Bramley, R.G.V. 2011. Vineyard variability in Marlborough, New Zealand: characterising spatial and temporal changes in fruit composition and juice quality in the vineyard. Australian Journal of Grape and Wine Research 17: 79-89., whereby one berry was collected from the top, another from the bottom, and two from the central cluster region (internal and external) (Figure 3B). The mean berry mass (BM, g) of the berry samples collected was determined based on the ratio between the total mass of each sample and its number of berries (96 berries). The volume of must of 100 berries (V100, mL) was determined by sieving the must extracted from the manual maceration of berries and measuring its volume in a graduated cylinder. The content of soluble solids (SS, °Brix) was determined using a digital refractometer, the pH by a benchtop pH meter, and the malic acid (MA, g L1) by using the enzymatic method.
– Selection of clusters by vine highlighted by black and white circles (A) and selection of berries by clusters highlighted by red circles (B) for collecting in the sampling plots.
Twenty sampling vines (outside the sampling plots) were selected at random from each area of the vineyard and were used to determine the attributes related to vineyard production. Some of these vines were selected from the low NDVI zones and others from the high NDVI zones based on the NDVI class maps of 120 dap in 2017 and 124 dap in 2018 (Figure 2B and D, respectively).
The clusters of sampling vines were hand-harvested for determining yield (Y, t ha1), number of clusters per vine (NC), and the mean mass of cluster (MC, g cluster1) on the same day of the berry sampling.
Vegetative vigor was assessed during the plant formation pruning in the subsequent growing season. For this, the fresh pruning weight (FPW, kg vine1), determined by weighing the pruning shoots using a semi-analytic digital balance, was considered. In this plant formation pruning, which is performed at a little over two months after cluster harvesting (Table 1), two buds per spur were left untouched. The vines used for determining FPW in 2017 and 2018 were the same ones used for determining ψ (24 vines) and Y (40 vines), respectively.
Pearson correlation analysis was plotted deploying the NDVI against the other determined attributes. Mean values of NDVI data measured inside 2.5 m radius buffers, with their centers coinciding with the centers of the berry sampling plots and sampling vines, were used for this procedure. Furthermore, a significant difference in the mean values of the attributes assessed between NDVI zones was observed in the one-way analysis of variance at the 10, 5 and 1 % significance levels by the F test, which was carried out using the R software (version 3.3.3).
Results and Discussion
Fresh pruning weight
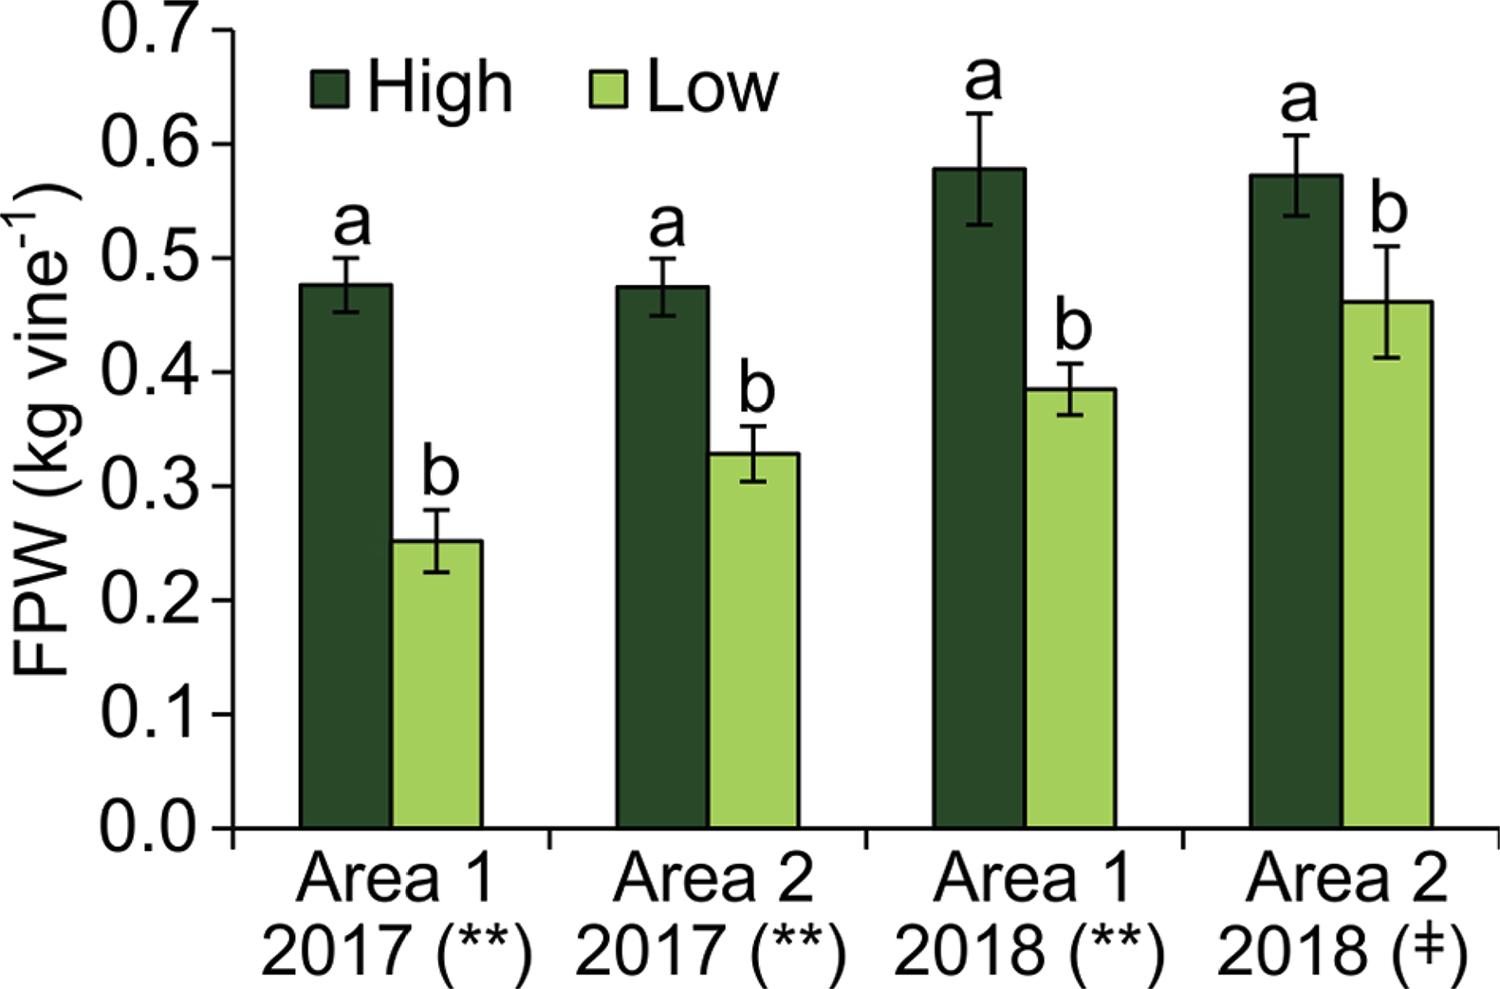
Mean FPW values for the NDVI zones of both areas and growing seasons (p ≤ 0.01 and p ≤ 0.10) (Figure 4) were different. The highest values were observed in the high NDVI zones since more vigorous vines reflect more in the near infrared band and less in the visible red band. This corroborates the high positive correlation between NDVI and FPW (Table 2).
– Fresh pruning weight (FPW) of ‘Chardonnay’ vines in zones of high and low normalized difference vegetation index (NDVI) of the 2017 and 2018 growing seasons in areas 1 and 2 of the vineyard. Different letters represent difference at the 10 % or 1 % significance levels (ǂ, and **, respectively) as determined by the F test.
Vine vegetative vigor is of high interest to viticulture, and control of this attribute is said to ensure the balance between the vegetative and reproductive phases, which in turn has repercussions for grape quality (Mota et al., 2010b). Identifying the spatial variability of the vine vegetative vigor using NDVI can highly benefit crop management. Site-specific management of vineyard vigor and yield can increase the grape quality in the most deficient zones and homogenize the quality of vineyard production (Bramley et al., 2011Bramley, R.G.V.; Ouzman, J.; Boss, P.K. 2011. Variation in vine vigour, grape yield and vineyard soils and topography as indicators of variation in the chemical composition of grapes, wine and wine sensory attributes. Australian Journal of Grape and Wine Research 17: 217-229.). The difference in FPW observed across the individual NDVI zones (Figure 4), as well as their high correlation (Table 2), suggest that NDVI is a good indicator of vineyard vegetative vigor, and demonstrate that it is suitable and feasible for the vineyard division into zones of site-specific management.
Leaf water potential and gas exchange
A difference of ψ between NDVI zones was found in only a few days of assessment, predominantly for ψdawn (Figure 5A, B, C, and D). In general, on the days with a difference, ψ was lower in the low NDVI zones; however, for ψ diurnal measured 126 dap in area 2 (2018), a lower value was observed in the high NDVI zone.
– Dawn and diurnal leaf water potential (ψ) of ‘Chardonnay’ vines in zones of high and low normalized difference vegetation index (NDVI), during the maturation period of 2017 (A and C) and 2018 (B and D) in areas 1 and 2 of the vineyard. Different letters represent a difference of 10 %, 5 %, or 1 % significance levels (ǂ, * and **, respectively) as determined by the F test.
During the assessment period of the 2017 growing season, the vineyard water status reached only low water deficit levels (–0.3 MPa < ψ dawn < –0.2 MPa; Van Leeuwen et al., 2009)Van Leeuwen, C.; Tregoat, O.; Choné, X.; Bois, B.; Pernet, D.; Gaudillère, J.P. 2009. Wine water status is a key factor in grape ripening and vintage quality for red Bordeaux wine: how can it be assessed for vineyard management purposes? Journal International des Sciences de la Vigne et du Vin 43: 121-134. (Figure 5A and C). In 2018, moderate to weak water deficit levels (–0.5 MPa < ψ dawn < –0.3 MPa; Van Leeuwen et al., 2009)Van Leeuwen, C.; Tregoat, O.; Choné, X.; Bois, B.; Pernet, D.; Gaudillère, J.P. 2009. Wine water status is a key factor in grape ripening and vintage quality for red Bordeaux wine: how can it be assessed for vineyard management purposes? Journal International des Sciences de la Vigne et du Vin 43: 121-134. were reached only in the low NDVI zone of area 1 (Figure 5B) and low levels in area 2 (Figure 5D).
Certain climatic conditions provided the lowest values of ψ in 2018 compared to 2017. During Apr and May, which correspond to the maturation period of both growing seasons, the mean monthly ETo was lower in 2017 (3.2 and 2.8 mm d1 in 2017 against 3.3 and 3.1 mm d1 in 2018, observed during Apr and May of each year; Figure 1); furthermore, rainfall volumes were also higher in 2017 (339 mm accumulated from Apr and May 2017 against 67 mm in 2018). This resulted in higher levels of soil moisture during the maturation period of 2017 (Table 3) which consequently led to greater water availability for the crop.
The positive correlation coefficients (r) between NDVI and ψ (Table 2) suggest that low vegetation indices indicate a higher plant water deficit. Moreover, the correlation was more significant when the vineyard water deficit was higher, because in periods with higher ψdawn, r was either insignificant or showed significance on only one of the two days when NDVI was calculated for their respective years.
The monitoring of plant water status allows for more efficient irrigation management of the vineyard towards berry quality improvement. Since its spatial variability is known irrigation management can be differentiated for the balance of berry composition at harvest or to guide selective harvesting (Brillante et al., 2017Brillante, L.; Martínez-Luscher, J.; Yu, R.; Plank, C.M.; Sanchez, L.; Bates, T.L.; Brenneman, C.; Oberholster, A.; Kurtural, S.K. 2017. Assessing spatial variability of grape skin flavonoids at the vineyard scale based on plant water status mapping. Journal of Agricultural and Food Chemistry 65: 5255-5265.). In this study few results were found to support the characterization of ψ spatial variability by canopy reflectance measurements due to low water deficit. Although regions of the vineyard with lower NDVI had a lower ψ, this effect seems to be lower in a situation where there is an inexistent or weak water deficit. In a situation of more severe water deficit, a new assessment of the vineyard should be conducted to complement the results found here. Nevertheless, identifying different patterns of NDVI in the vineyard should still be considered important when determining the points for ψ sampling, in order to ensure more consistent values from the vineyard.
Differences in gas exchange between vines with different NDVIs were observed only in area 1 (Table 4). In vines with low NDVI (low vigor), the rates of photosynthesis (A) and transpiration (E) were reduced less than 15 %, while stomatal conductance (gs) was reduced by 21 %, when compared to high NDVI zones (high vigor). However, this reduction seems to be more related to low vigor than to the water status of the vines, since there were no differences in ψdawn on the days when gas exchanges were measured in 2018 (Figure 5B and D), except at 120 dap in area 1. The positive correlations between A (105 and 126 dap) and NDVI (p ≤ 0.05 and p ≤ 0.01) also show that photosynthetic rates may have been limited by low vine vigor (Table 2). Despite the differences observed in gas exchange, lower values of A, gs, and E still indicate well-hydrated vines according to previous studies (Pietro et al., 2010Pietro, J.A.; Lebon, E.; Ojeda, H. 2010. Stomatal behavior of different grapevine cultivars in response to soil water status and air water vapor pressure deficit. Journal International des Sciences de la Vigne et du Vin 44: 9-20.; Souza et al., 2003Souza, C.S.; Maroco, J.P.; Santos, T.P.; Rodrigues, M.L.; Lopes, C.M.; Pereira, J.S.; Chaves, M.M. 2003. Partial rootzone drying: regulation of stomatal aperture and carbon assimilation in field-grown grapevines (Vitis vinifera cv. Moscatel). Functional Plant Biology 30: 653-662.). It is important to emphasize that the CO2 assimilation rate was affected only in the area where the greatest difference in vine vigor was observed (Figure 4). This may have occurred because the reduction in the concentration of leaf nitrogen, generally observed in vines with reduced growth (Keller, 2010Keller, M. 2010. The Science of Grapevines: Anatomy and Physiology. Elsevier, London, UK.), may have affected the photosynthetic apparatus through the reduction in the concentration of chlorophyll and/or photosynthetic enzymes, since these compounds are formed by nitrogen (Taiz and Zeiger, 2004Taiz, L.; Zeiger, E. 2004. Plant Physiology = Fisiologia Vegetal. 3ed. Artmed, Porto Alegre, RS, Brazil (in Portuguese).).
– Mean values (± standard error of the mean) and results of analysis of variance of the transpiration rate (E), stomatal conductance (gs), and net photosynthesis (A) of ‘Chardonnay’ vines of each zone of normalized difference vegetation index (NDVI) of the 2018 growing season in areas 1 and 2 of the vineyard.
Grape berry attributes
There were differences (p ≤ 0.01) between the NDVI zones of area 1 in the 2018 growing season in terms of the physiological grape maturation observed in the lower values of BM and V100 in the low NDVI zone (Table 5). Correlation analysis also indicated that canopy reflectance measurements had a positive associations with BM and V100 for the 2018 growing season only (Table 2). Water deficit can reduce the size of berries and modify their composition (Bassoi et al., 2015Bassoi, L.H.; Correia, J.S.; Santos, A.R.L.; Silva, J.A.; Costa, B.R.S. 2015. Deficit irrigation in grapevine cv. Syrah during two growing seasons in the Brazilian Semiarid. Engenharia Agrícola 35: 430-441.). Therefore, the higher levels of water deficit observed in the low NDVI zone of area 1 at 120 dap in 2018 (Figure 5C) may explain that correspondence.
– Mean values (± standard error of the mean) and results of the analysis of variance of the mean berry mass (BM), volume of 100 berries (V100), soluble solids content (SS), pH and malic acid (MA) of the ‘Chardonnay’ berries of each zone of normalized difference vegetation index (NDVI) of the 2017 and 2018 growing seasons in areas 1 and 2 of the vineyard.
Similar to the BM and V100 values, SS was found to be correlated with NDVI in 2018; but this correlation was negative and had a higher level of significance (p ≤ 0.01) on both days (Table 2). Moreover, SS was different in the NDVI zones in both years (Table 5). However, only in 2018 were the highest values of SS observed in the low NDVI zone (p ≤ 0.01) of area 1.
In the 2018 growing season, the increase in SS in the low NDVI zone of area 1 (Table 5) and the negative correlation with the NDVI values (Table 2) may be associated with lower values of BM and V100 (smaller berry size) in this zone (Table 5), result of conditions more favorable to the increase of the water deficit in this growing season (lower rainfall levels; Figure 1). According to Dreier et al. (2000)Dreier, L.P.; Stoll, G.S.; Ruffner, H.P. 2000. Berry ripening and evapotranspiration in Vitis vinifera L. American Journal of Enology and Viticulture 51: 340-346., correlation exists between the size of the berry and the final sugar content, since smaller berries in the same climatic condition are more susceptible to dehydration through evapotranspiration due to their higher surface/volume ratio (Dreier et al., 2000Dreier, L.P.; Stoll, G.S.; Ruffner, H.P. 2000. Berry ripening and evapotranspiration in Vitis vinifera L. American Journal of Enology and Viticulture 51: 340-346.; Mota et al., 2010a). Furthermore, the higher mean temperature observed during the 2018 maturation stage (Figure 1) facilitated the process of berry dehydration in this growing season, especially in vines with lower vegetative vigor (lower NDVI) due to the lower shading of the clusters. This caused a higher sugar concentration at the end of the maturation period of these vines (Table 5). King et al. (2014)King, P.D.; Smart, R.E.; McClellan, D.J. 2014. Within-vineyard variability in vine vegetative growth, yield, and fruit and wine composition of Cabernet Sauvignon in Hawke’s Bay, New Zealand. Australian Journal of Grape and Wine Research 20: 234-246. identified the negative effect of shading on the berries in cv. Cabernet Sauvignon due to high vegetative vigor.
Given that SS is associated with berry size (Bassoi et al., 2015Bassoi, L.H.; Correia, J.S.; Santos, A.R.L.; Silva, J.A.; Costa, B.R.S. 2015. Deficit irrigation in grapevine cv. Syrah during two growing seasons in the Brazilian Semiarid. Engenharia Agrícola 35: 430-441.), the lack of correlation between SS and NDVI observed in 2017 (Table 2) was also affected by the lack of correlation observed between NDVI and the attributes related to berry size (BM and V100; Table 2), a result of the climatic conditions during the maturation period of that year (higher rainfall volume; Figure 1).
In both growing seasons, the pH was not correlated with the NDVI (p > 0.05), unlike the MA, which showed positive correlation with the NDVI measured on all days (p ≤ 0.05 and p ≤ 0.01) (Table 2). In terms of the differences between NDVI zones, the results for pH and MA were favorable only in the 2018 growing season (Table 5). A difference for pH was observed only between the NDVI zones in area 2 of the 2018 growing season (p ≤ 0.05), wherein it was observed that the lowest value occurred in the high NDVI zone. Malic acid was lower only in the low NDVI zone of area 1 (p ≤ 0.10) in the 2018 growing season. Therefore, in general, the NDVI showed little efficacy in the distinction of berry pH values and higher efficacy for MA.
Vines with lower vegetative vigor (low NDVI) are likely to have a lower MA in berry composition (King et al., 2014King, P.D.; Smart, R.E.; McClellan, D.J. 2014. Within-vineyard variability in vine vegetative growth, yield, and fruit and wine composition of Cabernet Sauvignon in Hawke’s Bay, New Zealand. Australian Journal of Grape and Wine Research 20: 234-246.). The increase in berry temperature is a determining factor in the reduction in MA (Conde et al., 2007Conde, C.; Silva, P.; Fontes, N.; Dias, A.C.P.; Tavares, R.M.; Sousa, M.J.; Agasse, A.; Delrot, S.; Gerós, H. 2007. Biochemical changes throughout grape berry development and fruit and wine quality. Food 1: 1-22.). Thus, smaller berries found in low NDVI zones (Table 5) may have this factor intensified due to their lower volume, which determines the lower levels of this acid in low NDVI zones (Table 5) and its positive correlation with it (Table 2). The lower vegetative vigor (indicated by FPW) found in the vines with lower NDVI (Figure 4) may have also contributed to the reduction in MA (Table 5), since these vines provide less shading for the clusters, leading to an increase in the berry temperature. The higher water deficit observed in vines with lower NDVI (Table 2; Figure 5A, B, and C), mainly from area 1 in the 2018 growing season, is considered another factor responsible for the lower values of MA (Table 5) for these vines. The reduction in MA in berries is associated with their use as an energy source (catabolism) during the maturation process (Conde et al., 2007Conde, C.; Silva, P.; Fontes, N.; Dias, A.C.P.; Tavares, R.M.; Sousa, M.J.; Agasse, A.; Delrot, S.; Gerós, H. 2007. Biochemical changes throughout grape berry development and fruit and wine quality. Food 1: 1-22.), and the greater water deficits cause catabolism to be more favored (Esteban et al., 2002Esteban, M.A.; Villanueva, M.J.; Lissarrague, J.R. 2002. Relationships between different berry components in Tempranillo (Vitis vinifera L.) grapes from irrigated and non-irrigated vines during ripening. Journal of the Science of Food and Agriculture 82: 1136-1146.).
Moderate water deficits post-veraison may be beneficial for berry composition (Bassoi et al., 2015Bassoi, L.H.; Correia, J.S.; Santos, A.R.L.; Silva, J.A.; Costa, B.R.S. 2015. Deficit irrigation in grapevine cv. Syrah during two growing seasons in the Brazilian Semiarid. Engenharia Agrícola 35: 430-441.; González-Flor et al., 2014González-Flor, C.; Serrano, L.; Gorchs, G.; Pons, J.M. 2014. Assessment of grape yield and composition using reflectance-based indices in rainfed vineyards. Agronomy Journal 106: 1309-1316.; Van Leeuwen et al., 2009Van Leeuwen, C.; Tregoat, O.; Choné, X.; Bois, B.; Pernet, D.; Gaudillère, J.P. 2009. Wine water status is a key factor in grape ripening and vintage quality for red Bordeaux wine: how can it be assessed for vineyard management purposes? Journal International des Sciences de la Vigne et du Vin 43: 121-134.). González-Flor et al. (2014)González-Flor, C.; Serrano, L.; Gorchs, G.; Pons, J.M. 2014. Assessment of grape yield and composition using reflectance-based indices in rainfed vineyards. Agronomy Journal 106: 1309-1316., in a study conducted in non-irrigated vineyards, concluded that the extent and timing of the water deficit may interfere with the NDVI’s ability to estimate berry composition. This conclusion is also valid for the present study, conducted in irrigated vineyards in southeastern Brazil. Growing seasons with higher rainfall volumes during the berry maturation period (e.g., 2017) may compromise the usefulness of irrigation in controlling the desired water deficit in the vineyard and cause lower spatial variability. This was probably what caused the 2017 growing season to show less satisfactory results regarding the usefulness of the NDVI in identifying different patterns of berry ripeness within the vineyard. Conversely, in growing seasons with lower levels of rainfall, where the water deficit of the vineyard in the berry maturation period can be controlled by irrigation management (for example, in the 2018 growing season), even when there is a low water deficit, NDVI is still more effective during berry maturation.
Thus, when post-veraison periods are characterized by low rainfall, NDVI maps were useful for supporting the differentiated vineyard management. Normalized difference vegetation index measurements taken in the maturation period yielded no difference between evaluations at both dap (except for BM), as presented in previous results (Table 2) which give the grower a certain flexibility in carrying out canopy proximal sensing. Maps can be useful for indicating where to sample berries and guarantee more representative data on the evolution of berry maturation. Furthermore, NDVI maps can guide the selective harvesting in order to choose clusters on optimal technological maturation for winemaking. Wine quality essentially depends on the optimal berry maturity at harvest (Conde et al., 2007Conde, C.; Silva, P.; Fontes, N.; Dias, A.C.P.; Tavares, R.M.; Sousa, M.J.; Agasse, A.; Delrot, S.; Gerós, H. 2007. Biochemical changes throughout grape berry development and fruit and wine quality. Food 1: 1-22.) which is evaluated by monitoring sugar and acidity levels.
Selective harvesting can also make diversification in winemaking possible using grapes from the same vineyard since zones with different berry sizes and sugar and acidity levels can be delimited by NDVI mapping (Table 5). Wine quality is also related to the concentration of other compounds in berries which can vary according to size (Conde et al., 2007Conde, C.; Silva, P.; Fontes, N.; Dias, A.C.P.; Tavares, R.M.; Sousa, M.J.; Agasse, A.; Delrot, S.; Gerós, H. 2007. Biochemical changes throughout grape berry development and fruit and wine quality. Food 1: 1-22.; Chen et al., 2018Chen, W.K.; He, F.; Wang, Y.X.; Liu, X.; Duan, C.Q.; Wang, J. 2018. Influences of berry size on fruit composition and wine quality of Vitis vinifera L. cv. ‘Cabernet Sauvignon’ grapes. South African Journal of Enology and Viticulture 39: 67-76.).
Production parameters
All production parameters assessed (NC, MC, and Y) showed positive correlation with the NDVI (p ≤ 0.01 and p ≤ 0.05) for both growing seasons (Table 2). Furthermore, the NDVI zones were efficient in identifying different production patterns within the vineyard, especially in area 1 (Table 6). There was a difference in both growing seasons for NC, MC, and Y between NDVI zones of area 1 (p ≤ 0.05, p ≤ 0.01 and p ≤ 0.01, respectively), with the highest means observed in the high NDVI zone. In area 2, only NC and Y (for the 2017 growing season) and Y (for the 2018 growing season) were higher in the high NDVI zone (p ≤ 0.10).
– Mean values (± standard error of the mean) and results of the analysis of variance of the number of clusters per vine (NC), mean mass of clusters (MC), and yield (Y) of ‘Chardonnay’ vines of each zone of normalized difference vegetation index (NDVI) of the 2017 and 2018 growing seasons in areas 1 and 2 of the vineyard.
Several studies assessed the relationship between vegetative vigor and vine production using vegetation indices (Bonilla et al., 2015Bonilla, I.; Martínez De Toda, F.; Martínez-Casasnovas, J.A. 2015. Vine vigor, yield and grape quality assessment by airborne remote sensing over three years: analysis of unexpected relationships in cv. Tempranillo. Spanish Journal of Agricultural Research 13: 1-8.; González-Flor et al., 2014González-Flor, C.; Serrano, L.; Gorchs, G.; Pons, J.M. 2014. Assessment of grape yield and composition using reflectance-based indices in rainfed vineyards. Agronomy Journal 106: 1309-1316.; Hall et al., 2011Hall, A.; Lamb, D.W.; Holzapfel, B.P.; Louis, J.P. 2011. Within-season temporal variation in correlations between vineyard canopy and winegrape composition and yield. Precision Agriculture 12: 103-117.; King et al., 2014King, P.D.; Smart, R.E.; McClellan, D.J. 2014. Within-vineyard variability in vine vegetative growth, yield, and fruit and wine composition of Cabernet Sauvignon in Hawke’s Bay, New Zealand. Australian Journal of Grape and Wine Research 20: 234-246.). In most cases, vegetative vine vigor was positively associated with its production, as had also been observed by Mendonça et al. (2016)Mendonça, T.R.; Mota, R.V.; Souza, C.R.; Alcântara, F.; Dias, N.; Pimentel, R.M.A.; Regina, M.A. 2016. Pruning management of Chardonnay grapevines at high altitude in Brazilian southeast. Bragantia 75: 57-62. in ‘Chardonnay’ after assessing different types of pruning in vines in southern Minas Gerais, Brazil. Therefore, the small difference in vigor between the NDVI zones of area 2 compared to area 1, especially in 2018, as was observed (based on the FPW, p ≤ 0.01 and p ≤ 0.10 for area 1 and 2, respectively) (Figure 4), may have contributed to a lower difference in production parameter in area 2 (p ≤ 0.10) (Table 6). Similar results were found by Bonilla et al. (2015)Bonilla, I.; Martínez De Toda, F.; Martínez-Casasnovas, J.A. 2015. Vine vigor, yield and grape quality assessment by airborne remote sensing over three years: analysis of unexpected relationships in cv. Tempranillo. Spanish Journal of Agricultural Research 13: 1-8. when they observed that high vigor vines produced similar or even lower values than those of moderate vigor.
The results related to the production parameters (NC, MC, and Y; Tables 2 and 6) showed that they are proportionally related to the NDVI of the vine, that is, to its vegetative vigor. This demonstrates that the variability of production parameters over the irrigated ‘Chardonnay’ vineyards can be indicated by maps of homogeneous zones of NDVI since vegetative vigor shows significant spatial variation. Moreover, the different climatic conditions between the growing seasons do not seem to have influenced the results, which suggests that NDVI can be used to predict the variability of plant attributes related to vineyard production.
Conclusion
Spatial distribution maps of the normalized difference vegetation index (NDVI) of irrigated ‘Chardonnay’ vineyards allow for the determination of variability in vegetative vigor and production as well as guide the selective harvesting of grapes. However, high levels of rainfall during the maturation period can reduce the relationship between homogeneous NDVI zones and berry maturation indicators. These maps show zones can help in the estimation of vineyard yield and in the monitoring of maturation, gas exchange and leaf water potential, in order to ensure the acquisition of better quality information on their variability in the vineyard.
Acknowledgments
We thank the Coordination for the Improvement of Higher Level Personnel Foundation (CAPES) – Finance Code 001, for granting a scholarship to the first author, and the Brazilian National Council for Scientific and Technological Development (CNPq) for granting a scholarship to Embrapa’s Precision Agriculture Network, for technical support, the second author and financial support for the project, and Vinícola Guaspari for supporting the research.
References
- Alvares, C.A.; Stape, J.L.; Sentelhas, P.C.; Gonçalves, J.L.M.; Sparovek, G. 2013. Köppen’s climate classification map for Brazil. Meteorologische Zeitschrift 22: 711-728.
- Bassoi, L.H.; Correia, J.S.; Santos, A.R.L.; Silva, J.A.; Costa, B.R.S. 2015. Deficit irrigation in grapevine cv. Syrah during two growing seasons in the Brazilian Semiarid. Engenharia Agrícola 35: 430-441.
- Bonilla, I.; Martínez De Toda, F.; Martínez-Casasnovas, J.A. 2015. Vine vigor, yield and grape quality assessment by airborne remote sensing over three years: analysis of unexpected relationships in cv. Tempranillo. Spanish Journal of Agricultural Research 13: 1-8.
- Bramley, R.G.V.; Ouzman, J.; Boss, P.K. 2011. Variation in vine vigour, grape yield and vineyard soils and topography as indicators of variation in the chemical composition of grapes, wine and wine sensory attributes. Australian Journal of Grape and Wine Research 17: 217-229.
- Brillante, L.; Martínez-Luscher, J.; Yu, R.; Plank, C.M.; Sanchez, L.; Bates, T.L.; Brenneman, C.; Oberholster, A.; Kurtural, S.K. 2017. Assessing spatial variability of grape skin flavonoids at the vineyard scale based on plant water status mapping. Journal of Agricultural and Food Chemistry 65: 5255-5265.
- Cancela, J.J.; Fandiño, M.; Rey, B.J.; Dafonte, J.; González, X.P. 2017. Discrimination of irrigation water management effects in pergola trellis system vineyards using a vegetation and soil index. Agricultural Water Management 183: 70-77.
- Chen, W.K.; He, F.; Wang, Y.X.; Liu, X.; Duan, C.Q.; Wang, J. 2018. Influences of berry size on fruit composition and wine quality of Vitis vinifera L. cv. ‘Cabernet Sauvignon’ grapes. South African Journal of Enology and Viticulture 39: 67-76.
- Conde, C.; Silva, P.; Fontes, N.; Dias, A.C.P.; Tavares, R.M.; Sousa, M.J.; Agasse, A.; Delrot, S.; Gerós, H. 2007. Biochemical changes throughout grape berry development and fruit and wine quality. Food 1: 1-22.
- Dias, F.A.N.; Mota, R.V.; Souza, C.R.; Pimentel, R.M.A.; Souza, L.C.; Souza, A.L.; Regina, M.A. 2017. Rootstock on vine performance and wine quality of ‘Syrah’ under double pruning management. Scientia Agricola 74: 134-141.
- Dreier, L.P.; Stoll, G.S.; Ruffner, H.P. 2000. Berry ripening and evapotranspiration in Vitis vinifera L. American Journal of Enology and Viticulture 51: 340-346.
- Esteban, M.A.; Villanueva, M.J.; Lissarrague, J.R. 2002. Relationships between different berry components in Tempranillo (Vitis vinifera L.) grapes from irrigated and non-irrigated vines during ripening. Journal of the Science of Food and Agriculture 82: 1136-1146.
- González-Flor, C.; Serrano, L.; Gorchs, G.; Pons, J.M. 2014. Assessment of grape yield and composition using reflectance-based indices in rainfed vineyards. Agronomy Journal 106: 1309-1316.
- Hall, A.; Lamb, D.W.; Holzapfel, B.P.; Louis, J.P. 2011. Within-season temporal variation in correlations between vineyard canopy and winegrape composition and yield. Precision Agriculture 12: 103-117.
- Junges, A.H.; Fontana, D.C.; Anzanello, R.; Bremm, C. 2017. Normalized difference vegetation index obtained by ground-based remote sensing to characterize vine cycle in Rio Grande do Sul, Brazil. Ciência e Agrotecnologia 41: 543-553.
- Keller, M. 2010. The Science of Grapevines: Anatomy and Physiology. Elsevier, London, UK.
- King, P.D.; Smart, R.E.; McClellan, D.J. 2014. Within-vineyard variability in vine vegetative growth, yield, and fruit and wine composition of Cabernet Sauvignon in Hawke’s Bay, New Zealand. Australian Journal of Grape and Wine Research 20: 234-246.
- Lima, I.M. 2016. The new frontier of Brazilian wine production = A nova fronteira da produção de vinhos brasileiros. Available at: https://paladar.estadao.com.br/noticias/bebida,a-nova-fronteira-da-producao-de-vinhos-brasileiros,10000066798 [Accessed July 7, 2019] (in Portuguese).
» https://paladar.estadao.com.br/noticias/bebida,a-nova-fronteira-da-producao-de-vinhos-brasileiros,10000066798 - Marciniak, M.; Brown, R.; Reynolds, A.; Jollineau, M. 2015. Use of remote sensing to understand the terroir of the Niagara Peninsula: applications in a riesling vineyard. Journal International des Sciences de la Vigne et du Vin 49: 1-26.
- Mendonça, T.R.; Mota, R.V.; Souza, C.R.; Alcântara, F.; Dias, N.; Pimentel, R.M.A.; Regina, M.A. 2016. Pruning management of Chardonnay grapevines at high altitude in Brazilian southeast. Bragantia 75: 57-62.
- Mota, R.V.; Silva, C.P.C.; Favero, A.C.; Purgatto, E.; Shiga, T.M.; Regina, M.A. 2010a. Physico-chemical composition of wine grapes berries in summer and winter growing seasons. Revista Brasileira de Fruticultura 32: 1127-1137 (in Portuguese, with abstract in English).
- Mota, R.V.; Souza, C.R.; Silva, C.P.C.; Freitas, G.F.; Shiga, T.M.; Purgatto, E.; Lajolo, F.M.; Regina, M.A. 2010b. Biochemical and agronomical responses of grapevines to alteration of source-sink ratio by cluster thinning and shoot trimming. Bragantia 69: 17-25.
- Ozdemir, G.; Sessiz, A.; Pekitkan, F.G. 2017. Precision viticulture tools to production of high quality grapes. Horticulture 61: 209-218.
- Pietro, J.A.; Lebon, E.; Ojeda, H. 2010. Stomatal behavior of different grapevine cultivars in response to soil water status and air water vapor pressure deficit. Journal International des Sciences de la Vigne et du Vin 44: 9-20.
- Romero, M.; Luo, Y.; Su, B.; Fuentes, S. 2018. Vineyard water status estimation using multispectral imagery from an UAV platform and machine learning algorithms for irrigation scheduling management. Computers and Electronics in Agriculture 147: 109-117.
- Soil Survey Staff. 2014. Keys to Soil Taxonomy. 12ed. USDA-Natural Resources Conservation Service, Washington, DC, USA.
- Souza, C.R.; Mota, R.V.; Dias, F.A.N.; Melo, E.T.; Souza, L.C.; Souza, A.L.; Pimentel, R.M.A.; Regina, M.A. 2015. Starch accumulation and agronomical performance of ‘Syrah’ under winter cycle: responses to pruning and ethephon management. Vitis 54: 195-201.
- Souza, C.S.; Maroco, J.P.; Santos, T.P.; Rodrigues, M.L.; Lopes, C.M.; Pereira, J.S.; Chaves, M.M. 2003. Partial rootzone drying: regulation of stomatal aperture and carbon assimilation in field-grown grapevines (Vitis vinifera cv. Moscatel). Functional Plant Biology 30: 653-662.
- Taiz, L.; Zeiger, E. 2004. Plant Physiology = Fisiologia Vegetal. 3ed. Artmed, Porto Alegre, RS, Brazil (in Portuguese).
- Trought, M.C.T.; Bramley, R.G.V. 2011. Vineyard variability in Marlborough, New Zealand: characterising spatial and temporal changes in fruit composition and juice quality in the vineyard. Australian Journal of Grape and Wine Research 17: 79-89.
- Van Leeuwen, C.; Tregoat, O.; Choné, X.; Bois, B.; Pernet, D.; Gaudillère, J.P. 2009. Wine water status is a key factor in grape ripening and vintage quality for red Bordeaux wine: how can it be assessed for vineyard management purposes? Journal International des Sciences de la Vigne et du Vin 43: 121-134.
-
Erratum
In the paper “Homogeneous zones of vegetation index for characterizing variability and site-specific management in vineyards”, with DOI number: http://dx.doi.org/10.1590/1678-992X-2019-0243, published in the journal Scientia Agricola v.78, n.4, e20190243, 2021, on page 7:The correct unit of net photosynthesis (A) is μmol CO2 m-2 s-1, instead of μmol H2O m-2 s-1Where it shows:Table 4
Mean values (± standard error of the mean) and results of analysis of variance of the transpiration rate (E), stomatal conductance (gs), and net photosynthesis (A) of ‘Chardonnay’ vines of each zone of normalized difference vegetation index (NDVI) of the 2018 growing season in areas 1 and 2 of the vineyard.
It should be:Table 4
Mean values (± standard error of the mean) and results of analysis of variance of the transpiration rate (E), stomatal conductance (gs), and net photosynthesis (A) of ‘Chardonnay’ vines of each zone of normalized difference vegetation index (NDVI) of the 2018 growing season in areas 1 and 2 of the vineyard.
Edited by
Publication Dates
-
Publication in this collection
08 July 2020 -
Date of issue
2021
History
-
Received
06 Sept 2019 -
Accepted
29 Jan 2020