ABSTRACT
The method used to sample the runoff collected from soil erosion plots can be a significant source of error. In this study, we performed a laboratory experiment to evaluate the efficiency of the runoff sampling method most commonly used in Brazil. It is based on the manual homogenization and sampling of the collected runoff. Using soil material with 583 g kg–1 of sand and 89 g kg–1 of clay, the manual sampling method was tested for its ability to produce representative samples of artificial suspensions with a concentration of 2, 10 and 50 g L–1 of total solids. An underestimation of 30 % or more of the concentration of total solids was observed, with a variation of the same magnitude (CV between 20 and 45 %). We then developed a prototype sample splitter to replace the manual sampling method and tested it using the same artificial suspensions. The splitter was efficient in producing samples representative of the artificial suspensions, even without altering the particle size distribution of the total solids. Both absolute percentage errors (|< 5 %|) and the variation between five replicates (CV < 3 %) were small. The problems with the manual method are due to the inefficient homogenization that facilitates the differential sedimentation of particles of different sizes. If these problems are also found in other areas, then the prototype that we developed is a reasonable alternative.
erosion monitoring; soil loss; sandy soil; uncertainty
Introduction
Soil erosion is one of the major concerns of soil scientists (Panagos et al., 2017Panagos, P.; Borrelli, P.; Meusburger, K.; Yu, B.; Klik, A.; Lim, K.J.; Yang, J.E.; Ni, J.; Miao, C.; Chattopadhyay, N.; Sadeghi, S.H.; Hazbavi, Z.; Zabihi, M.; Larionov, G.A.; Krasnov, S.F.; Gorobets, A.V.; Levi, Y.; Erpul, G.; Birkel, C.; Hoyos, N.; Naipali, V.; Oliveira, P.T.S.; Bonilla, C.A.; Meddi, M.; Nel, W.; Dashti, H.A.; Boni, M.; Diodato, N.; Oost, K.V.; Nearing, M.; Ballabio, C. 2017. Global rainfall erosivity assessment based on high-temporal resolution rainfall records. Scientific Reports 7: 4175. https://doi.org/10.1038/s41598-017-04282-8
https://doi.org/10.1038/s41598-017-04282...
). Proof of this are the many erosion plots distributed around the globe (García-Ruiz et al., 2015García-Ruiz, J.M.; Beguería, S.; Nadal-Romero, E.; González-Hidalgo, J.C.; Lana-Renault, N.; Sanjuán, Y. 2015. A meta-analysis of soil erosion rates across the world. Geomorphology 239: 160-173. https://doi.org/10.1016/j.geomorph.2015.03.008
https://doi.org/10.1016/j.geomorph.2015....
; Anache et al., 2017Anache, J.A.A.; Wendland, E.C.; Oliveira, P.T.; Flanagan, D.C.; Nearing, M.A. 2017. Runoff and soil erosion plot-scale studies under natural rainfall: a meta-analysis of the Brazilian experience. Catena 152: 29-39. https://doi.org/10.1016/j.catena.2017.01.003
https://doi.org/10.1016/j.catena.2017.01...
; Silva et al., 2018Silva, R.M.; Santos, C.A.G.; Santos, J.Y.G. 2018. Evaluation and modeling of runoff and sediment yield for different land covers under simulated rain in a semiarid region of Brazil. International Journal of Sediment Research 33: 117-125. https://doi.org/10.1016/j.ijsrc.2017.04.005
https://doi.org/10.1016/j.ijsrc.2017.04....
). However, the quality of the data from erosion plots has often been questioned on account of the great variability that attaches to the use of a diversity of methods and monitoring strategies (Nearing et al., 1999Nearing, M.A.; Govers, G.; Norton, L.D. 1999. Variability in soil erosion data from replicated plots. Soil Science Society of America Journal 63: 1829-1835. https://doi.org/10.2136/sssaj1999.6361829x
https://doi.org/10.2136/sssaj1999.636182...
; Boix-Fayos et al., 2006Boix-Fayos, C.; Martínez-Mena, M.; Arnau-Rosalén, E.; Calvo-Cases, A.; Castillo, V.; Albaladejo, J. 2006. Measuring soil erosion by field plots: understanding the sources of variation. Earth-Science Reviews 78: 267-285. https://doi.org/10.1016/j.earscirev.2006.05.005
https://doi.org/10.1016/j.earscirev.2006...
; García-Ruiz et al., 2015García-Ruiz, J.M.; Beguería, S.; Nadal-Romero, E.; González-Hidalgo, J.C.; Lana-Renault, N.; Sanjuán, Y. 2015. A meta-analysis of soil erosion rates across the world. Geomorphology 239: 160-173. https://doi.org/10.1016/j.geomorph.2015.03.008
https://doi.org/10.1016/j.geomorph.2015....
; Poesen, 2018Poesen, J. 2018. Soil erosion in the Anthropocene: research needs. Earth Surface Processes and Landforms 43: 64-84. https://doi.org/10.1002/esp.4250
https://doi.org/10.1002/esp.4250...
). Lack of resources for monitoring a period longer than 5-10 years to obtain more consistent data has also been detrimental (Anache et al., 2017Anache, J.A.A.; Wendland, E.C.; Oliveira, P.T.; Flanagan, D.C.; Nearing, M.A. 2017. Runoff and soil erosion plot-scale studies under natural rainfall: a meta-analysis of the Brazilian experience. Catena 152: 29-39. https://doi.org/10.1016/j.catena.2017.01.003
https://doi.org/10.1016/j.catena.2017.01...
) - the poorer the data, the greater the uncertainty about the magnitude of the true soil losses.
The method used to sample the runoff collected from erosion plots can be a major source of error (Kinnell, 2016Kinnell, P.I.A. 2016. A review of the design and operation of runoff and soil loss plots. Catena 145: 257-265. https://doi.org/10.1016/j.catena.2016.06.013
https://doi.org/10.1016/j.catena.2016.06...
): sampling the collected runoff requires that it first be homogenized; however, accomplishing this is difficult when solid particles of different sizes and densities are present. Researchers from various places around the world have already shown that manual sampling methods are among those methods that suffer most from this problem, commonly underestimating soil losses (Lang, 1992Lang, R.D. 1992. Accuracy of two sampling methods used to estimate sediment concentrations in runoff from soil-loss plots. Earth Surface Processes and Landforms 17: 841-844. https://doi.org/10.1002/esp.3290170809
https://doi.org/10.1002/esp.3290170809...
; Zöbisch et al., 1996Zöbisch, M.A.; Klingspor, P.; Oduor, A.R. 1996. The accuracy of manual runoff and sediment sampling from erosion plots. Journal of Soil and Water Conservation 51: 231-233.; Ciesiolka et al., 2006Ciesiolka, C.A.A.; Yu, B.; Rose, C.; Ghadiri, H.; Lang, D.; Rosewell, C. 2006. Improvement in soil loss estimation in USLE type experiments. Journal of Soil and Water Conservation 61: 223-229.; Nikkami, 2012Nikkami, D. 2012. Investigating sampling accuracy to estimate sediment concentrations in erosion plot tanks. Turkish Journal of Agriculture and Forestry 36: 583-590. https://doi.org/10.3906/tar-1110-27
https://doi.org/10.3906/tar-1110-27...
; Huang et al., 2019Huang, Y.; Zhao, H.; Li, F.; Yuan, P.; Wang, W.; Zhang, G. 2019. Measurement errors on sediment concentration from traditional runoff collection tanks and its correction possibility. International Journal of Agricultural and Biological Engineering 12: 77-83. https://doi.org/10.25165/j.ijabe.20191203.4208
https://doi.org/10.25165/j.ijabe.2019120...
). Curiously, this literature seems to have been largely ignored in Brazil, where a manual sampling method (Veiga and Wildner, 1993Veiga, M.; Wildner, L.P. 1993. Manual for the installation and conduction of soil loss experiments = Manual para la instalación y conducción de experimentos de pérdida de suelos. FAO Regional Office for Latin America and the Caribbean, Santiago, Chile (in Spanish).) has remained the standard (Tengberg et al., 1997Tengberg, A.; Stocking, M.; Dechen, S.C.F. 1997. The impact of erosion on soil productivity: an experimental design applied in São Paulo state, Brazil. GeografiskaAnnaler: Series A. Physical Geography 79: 95-107. https://doi.org/10.1111/j.0435-3676.1997.00009.x
https://doi.org/10.1111/j.0435-3676.1997...
; Eltz et al., 2001Eltz, F.L.F.; Mehl, H.U.; Reichert, J.M. 2001. Interrill soil and water losses in an Ultisol under four rainfall patterns. Revista Brasileira de Ciência do Solo 25: 485-493. https://doi.org/10.1590/S0100-06832001000200024 (in Portuguese, with abstract in English).
https://doi.org/10.1590/S0100-0683200100...
; Volk and Cogo, 2009Volk, L.B.S.; Cogo, N.P. 2009. Relationships between size of eroded sediments, runoff velocity, surface roughness created by tillage, and size of aggregates in a soil submitted to different managements. Revista Brasileira de Ciência do Solo 33: 1459-1471. https://doi.org/10.1590/S0100-06832009000500036 (in Portuguese, with abstract in English).
https://doi.org/10.1590/S0100-0683200900...
; Merten et al., 2015Merten, G.H.; Araújo, A.G.; Biscaia, R.C.M.; Barbosa, G.M.C.; Conte, O. 2015. No-till surface runoff and soil losses in southern Brazil. Soil and Tillage Research 152: 85-93. https://doi.org/10.1016/j.still.2015.03.014
https://doi.org/10.1016/j.still.2015.03....
; Corrêa et al., 2016Corrêa, E.A.; Moraes, I.C.; Pinto, S.D.A.F.; Lupinacci, C.M. 2016. Soil losses, soil loss ratio and cover management factor of sugarcane: a first approach. Revista do Departamento de Geografia 32: 72-87. https://doi.org/10.11606/rdg.v32i0.116671 (in Portuguese, with abstract in English).
https://doi.org/10.11606/rdg.v32i0.11667...
).
Advanced sampling (Nikkami, 2012Nikkami, D. 2012. Investigating sampling accuracy to estimate sediment concentrations in erosion plot tanks. Turkish Journal of Agriculture and Forestry 36: 583-590. https://doi.org/10.3906/tar-1110-27
https://doi.org/10.3906/tar-1110-27...
; Todisco et al., 2012Todisco, F.; Vergni, L.; Mannocchi, F.; Bomba, C. 2012. Calibration of the soil loss measurement method at the Masse experimental station. Catena 91: 4-9. https://doi.org/10.1016/j.catena.2011.02.003
https://doi.org/10.1016/j.catena.2011.02...
) and correction methods (Ciesiolka et al., 2006Ciesiolka, C.A.A.; Yu, B.; Rose, C.; Ghadiri, H.; Lang, D.; Rosewell, C. 2006. Improvement in soil loss estimation in USLE type experiments. Journal of Soil and Water Conservation 61: 223-229.; Huang et al., 2019Huang, Y.; Zhao, H.; Li, F.; Yuan, P.; Wang, W.; Zhang, G. 2019. Measurement errors on sediment concentration from traditional runoff collection tanks and its correction possibility. International Journal of Agricultural and Biological Engineering 12: 77-83. https://doi.org/10.25165/j.ijabe.20191203.4208
https://doi.org/10.25165/j.ijabe.2019120...
) were developed to circumvent the issues described above. The drawback is that they still require the collected runoff to be homogenized before sampling. An alternative is to use sample splitters such as cone and churn splitters (Capel et al., 1995Capel, P.D.; Nacionales, F.C.; Larson, S.J. 1995. Precision of a Splitting Device for Water Samples. U.S. Geological Survey, Sacramento, CA, USA. https://doi.org/10.3133/ofr95293
https://doi.org/10.3133/ofr95293...
; Horowitz et al., 2001Horowitz, A.J.; Smith, J.J.; Elrick, K.A. 2001. Selected laboratory evaluations of the whole-water sample-splitting capabilities of a prototype fourteen-liter teflon churn splitter. U.S. Geological Survey, Atlanta, GA, USA. https://doi.org/10.3133/ofr01386
https://doi.org/10.3133/ofr01386...
). Sample splitters are designed to produce samples with a constitution very similar to the original suspension without the need for prior homogenization. However, most of the splitters currently in existence were designed for sampling suspensions with a low concentration of total solids (Capel et al., 1995Capel, P.D.; Nacionales, F.C.; Larson, S.J. 1995. Precision of a Splitting Device for Water Samples. U.S. Geological Survey, Sacramento, CA, USA. https://doi.org/10.3133/ofr95293
https://doi.org/10.3133/ofr95293...
; Horowitz et al., 2001Horowitz, A.J.; Smith, J.J.; Elrick, K.A. 2001. Selected laboratory evaluations of the whole-water sample-splitting capabilities of a prototype fourteen-liter teflon churn splitter. U.S. Geological Survey, Atlanta, GA, USA. https://doi.org/10.3133/ofr01386
https://doi.org/10.3133/ofr01386...
).
The aim of this paper was twofold. First, to add to the existing literature in this field by showing that the manual runoff sampling method used in Brazil also underestimates soil losses. Second, to present a prototype sample splitter – to replace the manual sampling method – and its performance. Both methods were analyzed through a laboratory experiment using sandy soil material.
Materials and Methods
Background
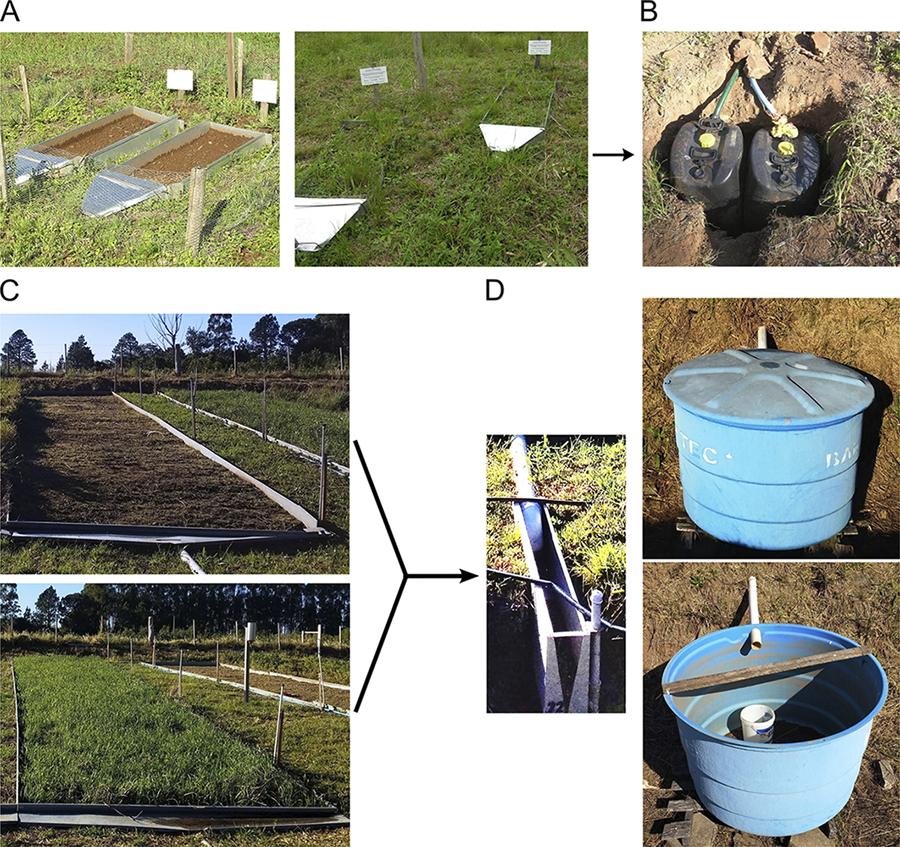
Our research group has recently been involved in designing and implementing an experiment to monitor soil erosion under natural rainfall in marginal areas in southern Brazil. In such experiments, soil losses are measured after rainfall events in collection tanks placed at the exit of runoff plots (Figure 1A-D). The size of collection tanks is determined by the size of runoff plots and expected intensity of rainfall events. Large plots generally contain a flume with a multislot divisor at the exit to subdivide the runoff and avoid overflow in the collection tanks. Nevertheless, in most cases, the volume of runoff and sediment collected in the tanks is so large that it needs to be sub-sampled. During the design of our experiment, we discovered that a manual sampling method is used in Brazil for this purpose. The international literature suggests that manual sampling methods tend to underestimate soil losses. Thus, this represented to us a gap/weakness in soil erosion monitoring research in Brazil. The section evaluating the manual sampling method describes how we assessed the performance of the sampling method used in Brazil. Since our findings agreed with the existing international literature – and we were not satisfied with the existing solutions –, we designed and tested a sample splitter that could replace the manual runoff sampling method. Constructive details and performance assessments are described in the section ‘A prototype sample splitter’.
– Soil erosion monitoring plots under natural rainfall conditions encountered in Brazil. In both small (A) and large (C) scale erosion studies the setup consists of a rectangular runoff plot – 0.5 × 1.0 m and 3.5 × 22 m, respectively – with a triangle shaped collector at its lower end and a reservoir where the runoff and sediment are collected (B and D) – 50 L and 1000 L, respectively.
Soil material
The two sample splitting methods – manual and splitter – were evaluated in the laboratory using artificial suspensions. These suspensions were composed of distilled water and fine soil material formulated to simulate runoff and sediment samples. The soil material was collected from the upper part (0-20 cm depth) of the A horizon of a soil profile derived from sedimentary rocks in the Santa Maria Formation. Located at –29°42’47.01” N and –53°42’43.36” E, altitude of 90 m the profile had no apparent anthropic use, and was classified as an Argissolo Vermelho-Amarelo Distrófico típico in the 2018 Brazilian classification code and as a Rhodic Acrisol in the 2015 update of the IUSS international classification code. With an A-E-Bt-C horizon sequence, the clay content is very low in the topsoil and increases considerably with depth, with a direct effect on the soil bulk density and porosity. The low content of basic cations, phosphorus and organic matter reflect the low availability of plant nutrients in the soil parent material (Tables 1 and 2), and the analytic data are available in the Free Brazilian Repository for Open Soil Data (FEBR, www.ufsm.br/febr), dataset ctb0013. Similar characteristics can be found in the topsoil of a large portion of the Central Depression region in the state of Rio Grande do Sul (Figure 2), having been the target of many erosion monitoring studies (Cogo et al., 1984Cogo, N.P.; Moldenhauer, W.C.; Foster, G.R. 1984. Soil loss reductions from conservation tillage practices. Soil Science Society of America Journal 48: 368. https://doi.org/10.2136/sssaj1984.03615995004800020029x
https://doi.org/10.2136/sssaj1984.036159...
; Eltz et al., 2001Eltz, F.L.F.; Mehl, H.U.; Reichert, J.M. 2001. Interrill soil and water losses in an Ultisol under four rainfall patterns. Revista Brasileira de Ciência do Solo 25: 485-493. https://doi.org/10.1590/S0100-06832001000200024 (in Portuguese, with abstract in English).
https://doi.org/10.1590/S0100-0683200100...
; Volk and Cogo, 2009Volk, L.B.S.; Cogo, N.P. 2009. Relationships between size of eroded sediments, runoff velocity, surface roughness created by tillage, and size of aggregates in a soil submitted to different managements. Revista Brasileira de Ciência do Solo 33: 1459-1471. https://doi.org/10.1590/S0100-06832009000500036 (in Portuguese, with abstract in English).
https://doi.org/10.1590/S0100-0683200900...
).
– Area of the state of Rio Grande do Sul with a superficial soil layer similar in texture to the soil material used in this study. The cross near the center of the state indicates the location where the soil material was collected.
The collected soil material was air-dried, crushed and passed through a 2-mm sieve. The particle size distribution of the resulting fine soil material, used to prepare the artificial suspensions, was determined using three samples weighing approximately 20 g each. The total clay content (< 0.002 mm diameter) was determined via the pipette method after chemical dispersion and mechanical disintegration. The first was achieved using 1 mol L1 sodium hydroxide (NaOH). The latter consisted of horizontal stirring for 4 h at 120 cycles per min in the presence of two nylon spheres (diameter: 1.71 cm; mass: 3.04 g; density 1.11 g cm1). The total sand content (0.053-2.00 mm diameter) was determined via wet sieving. The total silt (0.002-0.053 mm diameter) content was determined by difference. According to these analyses, the particle size distribution of the fine soil material (0-20 cm) consisted of 583 g kg1 of sand, 89 g kg1 of clay, and 328 g kg1 of silt.
Evaluating the manual sampling method
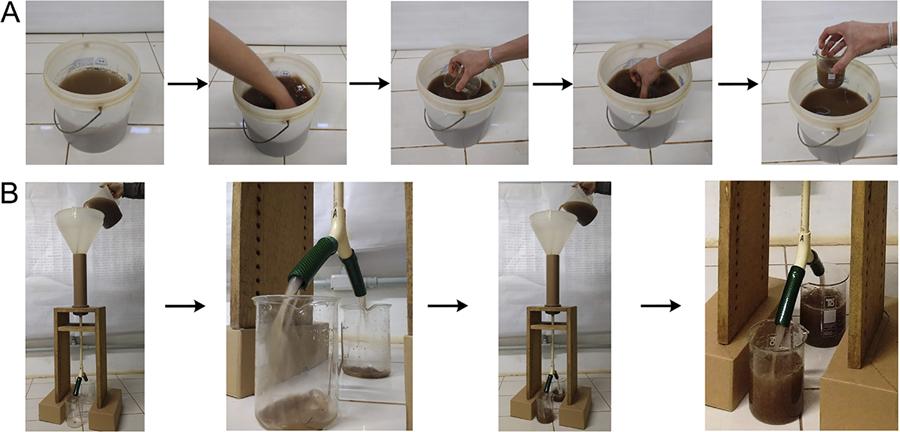
The first laboratory experiment that we carried out aimed at assessing the efficiency of the manual method, i.e., its ability to produce representative samples of the artificial suspensions. The samples were expected to have a concentration of total solids approximately equivalent to that of the suspension from which they were obtained. Artificial suspensions with three concentrations of total solids were used in the following amounts: 2, 10 and 50 g L1. They were prepared by adding the necessary mass of fine soil material to 3 L of distilled water in 10 L plastic containers (buckets) – such as those used in real world erosion monitoring studies (Figure 1D) – i.e, 6, 30, and 150 g, respectively. Five buckets (replicates) were prepared for each concentration. In each bucket, one person homogenized and stirred the suspension with one hand. After 10 seconds, without stopping the homogenization, another person collected a sample by immersing a 250 mL beaker into the suspension (Figure 3A). The concentration of total solids in the samples of each artificial suspension was determined as a function of the sample volume and the mass of total solids measured after oven drying at 105 °C until the water had completely evaporated.
– Sampling the artificial suspensions using (A) the manual sampling method and (B) the prototype sample splitter.
The five samples from each of the three artificial suspensions were summarized by computing the mean, standard deviation, and coefficient of variation. The estimation error, eij, was computed from the difference between the concentration of total solids in an artificial suspension j as estimated by a sample i, , and the true concentration, yj, i.e.,
where i = 1, 2, …, n, n = 5, and j is one of the three artificial suspensions. The percent mean estimation error (pME), defined as the percentage magnitude of the estimation error in relation to the true concentration in an artificial suspension j, was calculated by
Finally, the estimation errors were submitted to a one sample, two-tailed t-test to test if its mean was equal to zero (H0: μ = 0) or, alternatively, less or greater than zero (H1: μ ≠ 0). The t-statistic was given by
where sj is the sample standard deviation of the estimation error. The exact p-value of the t-test was obtained from Student’s t cumulative distribution function (CDF) with n–1 degrees of freedom.
A prototype sample splitter
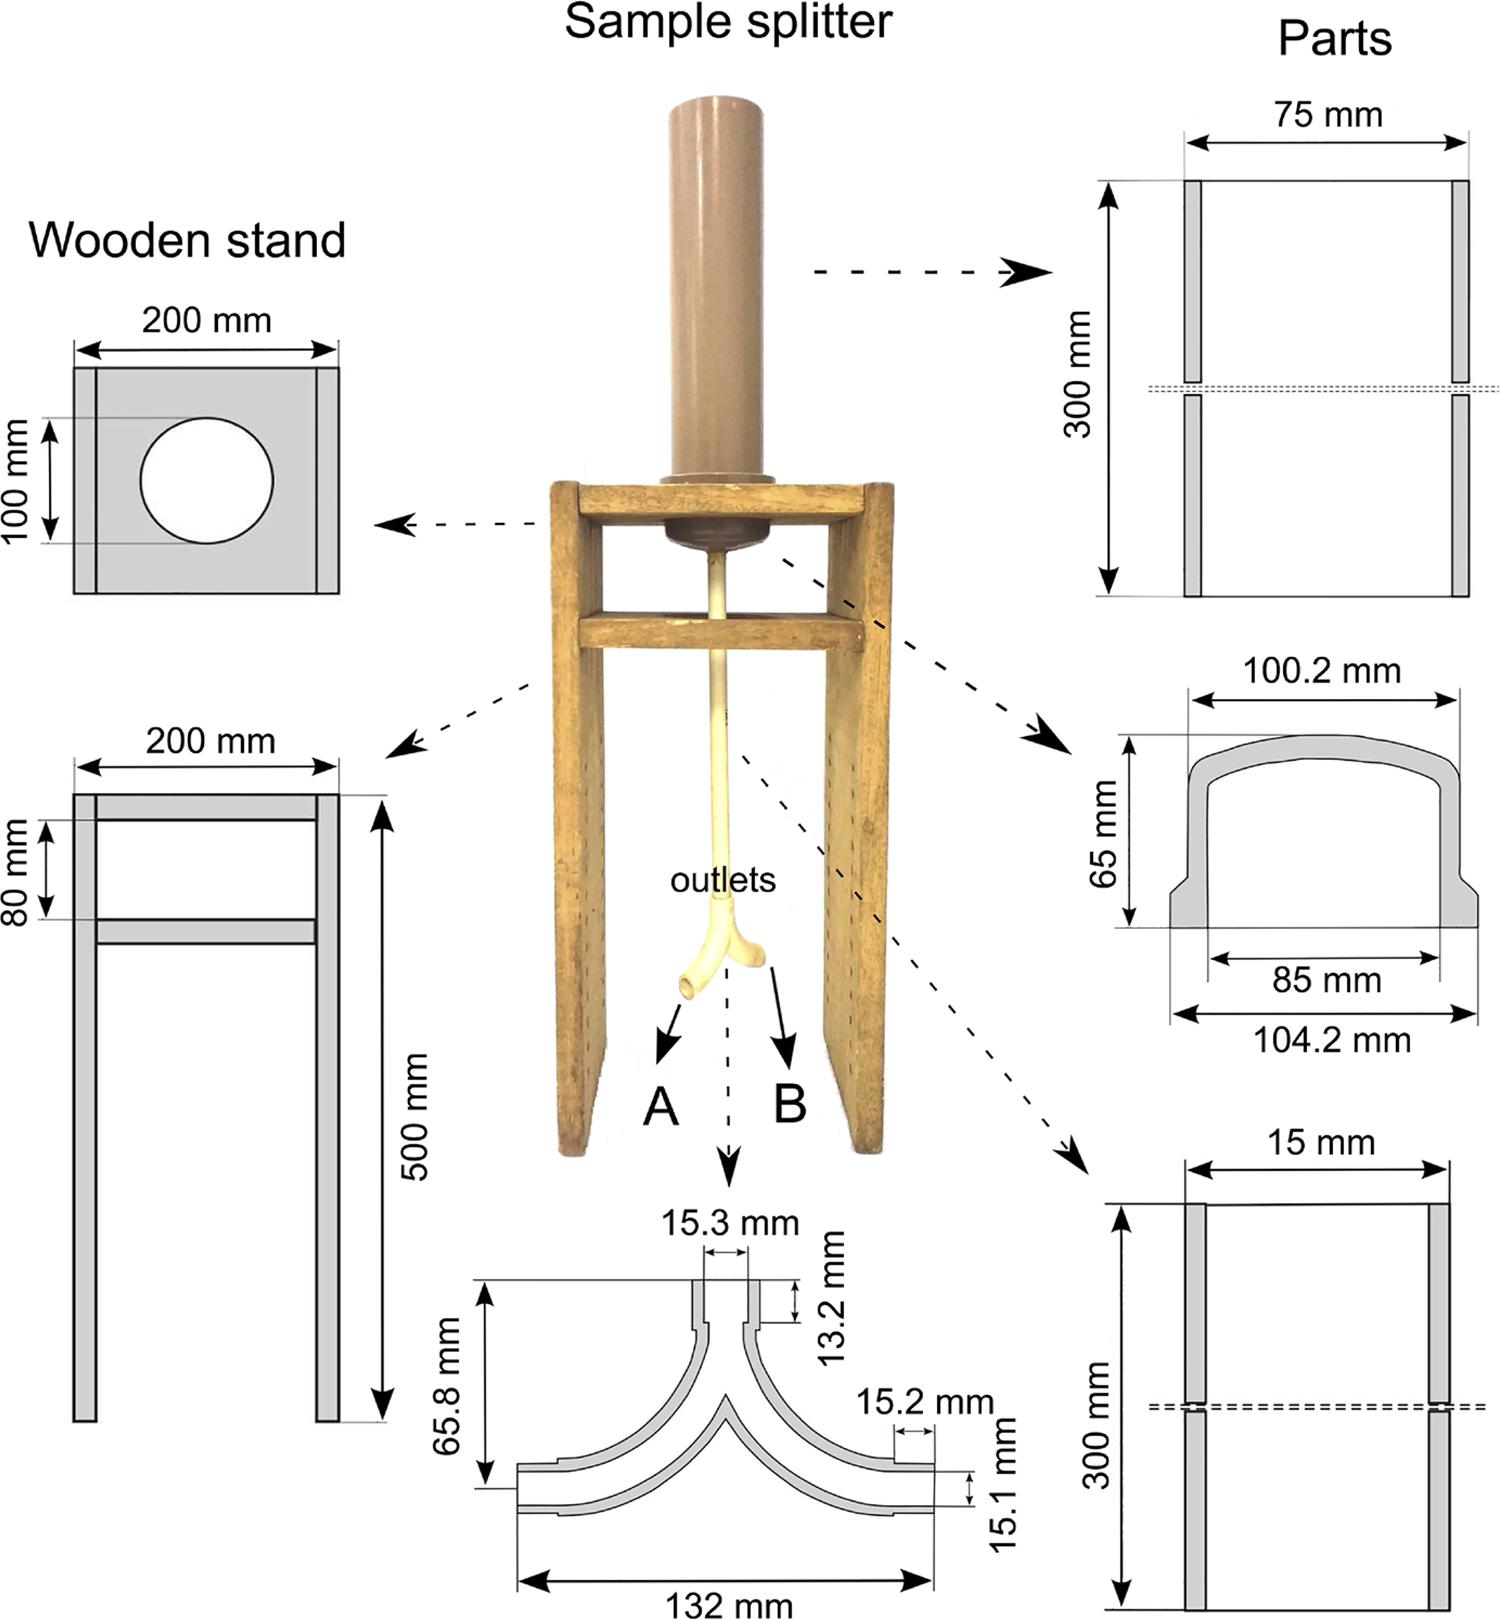
The prototype sample splitter was constructed with polyvinyl chloride (PVC) and wooden parts (Figure 3B and Figure 4). It is composed of a suspension reservoir, located on the upper part, which consists of a 300-mm long, 75-mm diameter PVC plastic pipe with a maximum net capacity of 1 L of suspension. The bottom of the reservoir consists of a PVC internal domed end cap. A 15-mm diameter hole was drilled in the center of the cap to connect a 300-mm long, 15-mm diameter PVC plastic pipe. The dome-shaped end cap helps direct the reservoir suspension to the smaller diameter pipe connected to the lower end. The function of this smaller diameter pipe is to direct the suspension in a continuous and concentrated flow to the splitting device, a Y-connector placed at its lower end. All parts are glued to each other using PVC-specific adhesive material. Since the splitter has two outlets, A and B, it produces two samples of the suspension at each splitting operation. Finally, the PVC parts were fixated on a wooden platform, leveled with both horizontal and vertical planes.
– Prototype sample splitter compared to the manual method. The constituent PVC and wooden parts and their dimensions (unscaled) are shown in detail.
The sample splitter method was submitted to three laboratory tests. The first test aimed to evaluate if the volume of the suspension affects the performance of the splitter, specifically, its capacity to produce pairs of samples with approximately equivalent volumes. Four volumes of distilled water were evaluated – 100, 300, 500, and 1000 mL – using five replicates. For each repetition, the total volume of distilled water was poured into the splitter’s reservoir at one time. The two resulting samples, A and B, were collected in beakers and their volume determined using calibrated graduated cylinders. The estimation error and its ratio to the true value (half of the total volume of distilled water), both defined above, were calculated for both samples. Estimation errors were submitted to the one sample, two-tailed t-test as described for the manual method. In addition, the estimation errors of outlets A and B were tested for equality using the paired sample, two-tailed t-test. The t-statistic was given by
where is the mean of differences between estimation errors of outlets A and B, sdj the sample standard deviation of the differences, and j one of the four volumes tested.
The second test to which the splitter method was submitted was the same as that applied to the manual method, i.e., an assessment of its ability to produce a representative sample of the artificial suspension. The same concentrations used to evaluate the manual method were employed, also with five replicates each. The artificial suspensions were prepared in 500-mL plastic containers. After vigorous shaking for 10 seconds, each suspension was poured into the splitter’s reservoir at the same time and both samples, A and B, were collected in 250-mL beakers. The splitter was washed with distilled water after each repetition. The concentration of total solids in the samples was determined as that described for the manual method. The estimation errors were submitted to one and paired sample, two-tailed t-tests as above.
Finally, the total solids contained in the samples produced by outlets A and B of the splitter were analyzed for particle size distribution. The same method used for the analysis of the soil material employed to produce the artificial suspensions was used. The aim of this test was to evaluate the capacity of the splitter to produce samples where the total solids have a size distribution approximately equivalent to that observed in the total solids of the artificial suspension. The one and paired sample, two-tailed t-tests were used to evaluate the estimation errors in the clay and sand content.
Results and Discussion
Manual sampling method
The test performed with the manual runoff sampling method showed that the resulting samples were not representative of the artificial suspensions used (Table 3). The mean concentration of total solids across the five replicates of all three artificial suspensions was considerably lower than the target concentration (2, 10 and 50 g L1). This resulted in an average concentration underestimate of 30 % or more as revealed by the pME. In addition, we observed a somewhat large variation in the concentration of total solids between the five replicates, the coefficients of variation ranging from 21 % to 46 %. The larger the concentration of total solids in the suspension, the larger the variation observed between the estimates of the replicates. This happened because the more solid particles in a suspension, the more difficult its homogenization becomes, especially if the solids are dominated by coarse material (sand). These empirical findings – the first of their kind ever obtained in Brazil – agree with those reported by studies on manual runoff sampling methods carried out in other parts of the world over the last three decades (Lang, 1992Lang, R.D. 1992. Accuracy of two sampling methods used to estimate sediment concentrations in runoff from soil-loss plots. Earth Surface Processes and Landforms 17: 841-844. https://doi.org/10.1002/esp.3290170809
https://doi.org/10.1002/esp.3290170809...
; Zöbisch et al., 1996Zöbisch, M.A.; Klingspor, P.; Oduor, A.R. 1996. The accuracy of manual runoff and sediment sampling from erosion plots. Journal of Soil and Water Conservation 51: 231-233.; Ciesiolka et al., 2006Ciesiolka, C.A.A.; Yu, B.; Rose, C.; Ghadiri, H.; Lang, D.; Rosewell, C. 2006. Improvement in soil loss estimation in USLE type experiments. Journal of Soil and Water Conservation 61: 223-229.; Todisco et al., 2012Todisco, F.; Vergni, L.; Mannocchi, F.; Bomba, C. 2012. Calibration of the soil loss measurement method at the Masse experimental station. Catena 91: 4-9. https://doi.org/10.1016/j.catena.2011.02.003
https://doi.org/10.1016/j.catena.2011.02...
; Kinnell, 2016Kinnell, P.I.A. 2016. A review of the design and operation of runoff and soil loss plots. Catena 145: 257-265. https://doi.org/10.1016/j.catena.2016.06.013
https://doi.org/10.1016/j.catena.2016.06...
). This agreement means that, irrespective of the experimental conditions, manual runoff sampling methods are inconsistent and inefficient when coarse particles (sand > 500 g kg1) dominate the solid fraction. Brazilian researchers monitoring erosion in sandy soil should be aware of these severe drawbacks and use more appropriate runoff sampling methods.
– Concentration of total solids in five samples (S1, S2, …, S5) obtained using the manual sampling method from three artificial suspensions with a known concentration of total solids of 2, 10 and 50 g L–1. Statistics: SD = standard deviation, CV = coefficient of variation, pME = percentage mean estimation error, t1 = one-sample t-test statistic, p1 = p-value of the t1-test.
The consistent underestimation of the concentration of total solids in a suspension by the manual sampling method suggests that real world soil losses could be considerably higher than those reported in the literature. In those areas of southern Brazil with coarse texture soil – < 100 g kg1 of clay and > 500 g kg1 of sand – similar to the soil material used to prepare the artificial suspensions for this study (Figure 2), soil losses could be underestimated by 30-50 %. For example, according to Lanzanova et al. (2013)Lanzanova, M.E.; Eltz, F.L.F.; Silveira Nicoloso, R.; Cassol, E.A.; Bertol, I.; Amado, T.J.C.; Girardello, V.C. 2013. Residual effect of soil tillage on water erosion from a typic paleudalf under long-term no-tillage and cropping systems. Revista Brasileira de Ciência do Solo 37: 1689-1698. https://doi.org/10.1590/S0100-06832013000600025
https://doi.org/10.1590/S0100-0683201300...
, a standard (bare) soil erosion monitoring plot (width = 3.5 m, length = 22 m, slope = 0.055 m m1) located near the place where we collected the soil material for this study lost about 2.5 Gg ha1 of soil in 16 years. Based on the results of our laboratory experiment, the amount of soil lost in this plot could be as high as 3.6-5.0 Gg ha1.
Despite corroboration of our results by articles in the international literature, attention must be paid to the fact that they are based on one-person sampling. Zöbisch et al. (1996)Zöbisch, M.A.; Klingspor, P.; Oduor, A.R. 1996. The accuracy of manual runoff and sediment sampling from erosion plots. Journal of Soil and Water Conservation 51: 231-233. evaluated five experienced professionals and observed estimation errors between 5 and 83 %. Since the variation observed by Zöbisch et al. (1996)Zöbisch, M.A.; Klingspor, P.; Oduor, A.R. 1996. The accuracy of manual runoff and sediment sampling from erosion plots. Journal of Soil and Water Conservation 51: 231-233. agrees with our results, this suggests our experiment should be reproduced by other research groups, as the results may be affected by the person responsible for sampling the suspension. Furthermore, this experiment does not reflect all field conditions found throughout Brazil and should be repeated under other soil – in terms of particle size distribution – and experimental conditions to produce more representative results. This is especially important so that an equation can be computed to correct soil loss estimates if the manual sampling method proves to fail under a wide diversity of conditions.
Sample splitter method
The results of the first test performed with the prototype sample splitter showed that its efficiency is not affected by the volume of water (Table 4). Both outlets A and B produced samples with similar volumes. However, the splitting process seems to become less efficient as the volume of water decreases. The largest errors were observed when the volume of water was 100 mL, possibly due to the swirling effect of the water inside the 15-mm diameter PVC plastic pipe connected to the lower end of the reservoir. The function of this pipe is to direct the water in a continuous and concentrated flow to the splitting device (Y-connector). Apparently, this objective was attained only when the volume of water exceeded 100 mL. Thus, it is reasonable to recommend that the sample splitter be used only on suspensions of volume greater than 250-300 mL.
– Volume of the five samples (S1, S2, …, S5) produced by outlets A and B of the sample splitter for initial volumes of 100, 300, 500 and 1000 mL. Statistics: SD = standard deviation, CV = coefficient of variation, pME = percentage mean estimation error, t1 and t2 = one and two-sample t-test statistic, p1 and p2 = p-value of the t1 and t2-test.
The prototype sample splitter was efficient in producing representative samples at both outlets A and B for all three artificial suspensions tested – 2, 10 and 50 g L1 of total solids (Table 5). Compared to the manual sampling method, the absolute errors were considerably small (pME< |5 %|), as well as the variation between the repetitions (CV < 3 %). The occurrence of a consistent trend of negative estimation errors, indicated even by the t-test statistic, means that it is possible to correct the estimated concentration of total solids with a high degree of confidence. In addition, this underestimation can be avoided or minimized by adopting additional care during the splitting operation. We observed that, during the pouring of the suspension into the splitter’s reservoir, larger diameter particles (sand) tend to remain inside the container where the suspension was stored. To avoid or minimize this loss of particles it is necessary to vigorously shake the container and pour the suspension rapidly into the reservoir. An additional practice is to wash the container using a known volume of distilled water and then pouring the new suspension into the splitter.
– Concentration of total solids in five samples (S1, S2, …, S5) obtained using the prototype sample splitter from three artificial suspensions with a known concentration of total solids of 2, 10 and 50 g L–1. Statistics: SD = standard deviation, CV = coefficient of variation, pME = percentage mean estimation error, t1 and t2 = one and two-sample t-test statistic, p1 and p2 = p-value of the t1 and t2-test.
Samples produced by the splitter also were representative of the artificial suspensions tested in terms of sand content (Table 6). This occurred regardless of the splitter’s outlet. The exception was for the artificial suspension with the lowest concentration of total solids, 2 g L1, for which the estimation error was deemed too large. For all the five replicates, on average, the sand content was underestimated by about 50 %. We note, however, that this underestimation was not due to the sample splitting process itself. It resulted from the issue reported above, that is, particles of larger diameter tend to remain inside the container where the suspension was stored. This loss of larger particles results in the underestimation of the sand content.
– Sand content in the total solids of five samples (S1, S2, …, S5) obtained using the prototype sample splitter from three artificial suspensions with a known concentration of total solids of 2, 10 and 50 g L–1. Statistics: SD = standard deviation, CV = coefficient of variation, pME = percentage mean estimation error, t1 and t2 = one and two-sample t-test statistic, p1 and p2 = p-value of the t1 and t2-test.
The estimation errors of the clay content in the samples of both outlets were considerably larger than those for the sand content (Table 7). Errors were especially large for the artificial suspension with 2.00 g L1 of total solids. This occurred because, for the soil material used, the quantity of clay in the resulting samples was below the detection limit of the analytical method used. When the concentration of total solids was higher (10 and 50 g L1), the percentage estimation error was lower, its significance decreasing as the concentration of total solids increased.
– Clay content in the total solids of five samples (S1, S2, …, S5) obtained using the prototype sample splitter from three artificial suspensions with a known concentration of total solids of 10 and 50 g L–1. Statistics: SD = standard deviation, CV = coefficient of variation, pME = percentage mean estimation error, t1 and t2 = one and two-sample t-test statistics, p1 and p2 = p-value of the t1 and t2-test.
Further assessments of the sample splitter should be carried out using a wider range of concentrations of total solids and particle size distributions. This is necessary to guarantee its efficiency under different conditions, especially if the manual sampling method proves to underestimate soil losses even when the solid fraction is dominated by fine particles (clay).
Conclusions
The manual runoff sampling method used in Brazil is unsuitable for the sampling of suspensions containing total solids with a prevalence of coarse particles (sand > 500 g kg1). In addition to the concentration underestimates of total solids, there is a large variation in the estimated values. This means that the sampling method constitutes an important element of variation in the results of soil erosion monitoring studies. This variation adds to the uncertainty arising from other sources already described in the literature.
The prototype sample splitter that we developed proved to be an efficient producer of samples from artificial suspension with different concentrations of total solids without changing the particle size distribution. This efficiency is clear and consistent mainly for suspension volumes above 250-300 mL and concentrations of total solids greater than 2 g L1. Thus, if the problems that we identify in the manual sampling method are also found by other research groups, the prototype we developed can be considered a reasonable alternative.
Acknowledgments
We are grateful to Dr. Pablo Miguel (Federal University of Pelotas - UFPel) who took part in data acquisition. We are grateful to two anonymous reviewers for helpful comments on the original version of the manuscript as well as the critical comments by another three anonymous reviewers on an earlier version of the manuscript. The research for this paper was financially supported by the Coordination for the Improvement of Higher Level Personnel (CAPES), and the Brazilian National Council for Scientific and Technological Development (CNPq).
References
- Anache, J.A.A.; Wendland, E.C.; Oliveira, P.T.; Flanagan, D.C.; Nearing, M.A. 2017. Runoff and soil erosion plot-scale studies under natural rainfall: a meta-analysis of the Brazilian experience. Catena 152: 29-39. https://doi.org/10.1016/j.catena.2017.01.003
» https://doi.org/10.1016/j.catena.2017.01.003 - Boix-Fayos, C.; Martínez-Mena, M.; Arnau-Rosalén, E.; Calvo-Cases, A.; Castillo, V.; Albaladejo, J. 2006. Measuring soil erosion by field plots: understanding the sources of variation. Earth-Science Reviews 78: 267-285. https://doi.org/10.1016/j.earscirev.2006.05.005
» https://doi.org/10.1016/j.earscirev.2006.05.005 - Capel, P.D.; Nacionales, F.C.; Larson, S.J. 1995. Precision of a Splitting Device for Water Samples. U.S. Geological Survey, Sacramento, CA, USA. https://doi.org/10.3133/ofr95293
» https://doi.org/10.3133/ofr95293 - Ciesiolka, C.A.A.; Yu, B.; Rose, C.; Ghadiri, H.; Lang, D.; Rosewell, C. 2006. Improvement in soil loss estimation in USLE type experiments. Journal of Soil and Water Conservation 61: 223-229.
- Cogo, N.P.; Moldenhauer, W.C.; Foster, G.R. 1984. Soil loss reductions from conservation tillage practices. Soil Science Society of America Journal 48: 368. https://doi.org/10.2136/sssaj1984.03615995004800020029x
» https://doi.org/10.2136/sssaj1984.03615995004800020029x - Corrêa, E.A.; Moraes, I.C.; Pinto, S.D.A.F.; Lupinacci, C.M. 2016. Soil losses, soil loss ratio and cover management factor of sugarcane: a first approach. Revista do Departamento de Geografia 32: 72-87. https://doi.org/10.11606/rdg.v32i0.116671 (in Portuguese, with abstract in English).
» https://doi.org/10.11606/rdg.v32i0.116671 - Eltz, F.L.F.; Mehl, H.U.; Reichert, J.M. 2001. Interrill soil and water losses in an Ultisol under four rainfall patterns. Revista Brasileira de Ciência do Solo 25: 485-493. https://doi.org/10.1590/S0100-06832001000200024 (in Portuguese, with abstract in English).
» https://doi.org/10.1590/S0100-06832001000200024 - García-Ruiz, J.M.; Beguería, S.; Nadal-Romero, E.; González-Hidalgo, J.C.; Lana-Renault, N.; Sanjuán, Y. 2015. A meta-analysis of soil erosion rates across the world. Geomorphology 239: 160-173. https://doi.org/10.1016/j.geomorph.2015.03.008
» https://doi.org/10.1016/j.geomorph.2015.03.008 - Horowitz, A.J.; Smith, J.J.; Elrick, K.A. 2001. Selected laboratory evaluations of the whole-water sample-splitting capabilities of a prototype fourteen-liter teflon churn splitter. U.S. Geological Survey, Atlanta, GA, USA. https://doi.org/10.3133/ofr01386
» https://doi.org/10.3133/ofr01386 - Huang, Y.; Zhao, H.; Li, F.; Yuan, P.; Wang, W.; Zhang, G. 2019. Measurement errors on sediment concentration from traditional runoff collection tanks and its correction possibility. International Journal of Agricultural and Biological Engineering 12: 77-83. https://doi.org/10.25165/j.ijabe.20191203.4208
» https://doi.org/10.25165/j.ijabe.20191203.4208 - Kinnell, P.I.A. 2016. A review of the design and operation of runoff and soil loss plots. Catena 145: 257-265. https://doi.org/10.1016/j.catena.2016.06.013
» https://doi.org/10.1016/j.catena.2016.06.013 - Lang, R.D. 1992. Accuracy of two sampling methods used to estimate sediment concentrations in runoff from soil-loss plots. Earth Surface Processes and Landforms 17: 841-844. https://doi.org/10.1002/esp.3290170809
» https://doi.org/10.1002/esp.3290170809 - Lanzanova, M.E.; Eltz, F.L.F.; Silveira Nicoloso, R.; Cassol, E.A.; Bertol, I.; Amado, T.J.C.; Girardello, V.C. 2013. Residual effect of soil tillage on water erosion from a typic paleudalf under long-term no-tillage and cropping systems. Revista Brasileira de Ciência do Solo 37: 1689-1698. https://doi.org/10.1590/S0100-06832013000600025
» https://doi.org/10.1590/S0100-06832013000600025 - Merten, G.H.; Araújo, A.G.; Biscaia, R.C.M.; Barbosa, G.M.C.; Conte, O. 2015. No-till surface runoff and soil losses in southern Brazil. Soil and Tillage Research 152: 85-93. https://doi.org/10.1016/j.still.2015.03.014
» https://doi.org/10.1016/j.still.2015.03.014 - Nearing, M.A.; Govers, G.; Norton, L.D. 1999. Variability in soil erosion data from replicated plots. Soil Science Society of America Journal 63: 1829-1835. https://doi.org/10.2136/sssaj1999.6361829x
» https://doi.org/10.2136/sssaj1999.6361829x - Nikkami, D. 2012. Investigating sampling accuracy to estimate sediment concentrations in erosion plot tanks. Turkish Journal of Agriculture and Forestry 36: 583-590. https://doi.org/10.3906/tar-1110-27
» https://doi.org/10.3906/tar-1110-27 - Panagos, P.; Borrelli, P.; Meusburger, K.; Yu, B.; Klik, A.; Lim, K.J.; Yang, J.E.; Ni, J.; Miao, C.; Chattopadhyay, N.; Sadeghi, S.H.; Hazbavi, Z.; Zabihi, M.; Larionov, G.A.; Krasnov, S.F.; Gorobets, A.V.; Levi, Y.; Erpul, G.; Birkel, C.; Hoyos, N.; Naipali, V.; Oliveira, P.T.S.; Bonilla, C.A.; Meddi, M.; Nel, W.; Dashti, H.A.; Boni, M.; Diodato, N.; Oost, K.V.; Nearing, M.; Ballabio, C. 2017. Global rainfall erosivity assessment based on high-temporal resolution rainfall records. Scientific Reports 7: 4175. https://doi.org/10.1038/s41598-017-04282-8
» https://doi.org/10.1038/s41598-017-04282-8 - Poesen, J. 2018. Soil erosion in the Anthropocene: research needs. Earth Surface Processes and Landforms 43: 64-84. https://doi.org/10.1002/esp.4250
» https://doi.org/10.1002/esp.4250 - Silva, R.M.; Santos, C.A.G.; Santos, J.Y.G. 2018. Evaluation and modeling of runoff and sediment yield for different land covers under simulated rain in a semiarid region of Brazil. International Journal of Sediment Research 33: 117-125. https://doi.org/10.1016/j.ijsrc.2017.04.005
» https://doi.org/10.1016/j.ijsrc.2017.04.005 - Tengberg, A.; Stocking, M.; Dechen, S.C.F. 1997. The impact of erosion on soil productivity: an experimental design applied in São Paulo state, Brazil. GeografiskaAnnaler: Series A. Physical Geography 79: 95-107. https://doi.org/10.1111/j.0435-3676.1997.00009.x
» https://doi.org/10.1111/j.0435-3676.1997.00009.x - Todisco, F.; Vergni, L.; Mannocchi, F.; Bomba, C. 2012. Calibration of the soil loss measurement method at the Masse experimental station. Catena 91: 4-9. https://doi.org/10.1016/j.catena.2011.02.003
» https://doi.org/10.1016/j.catena.2011.02.003 - Veiga, M.; Wildner, L.P. 1993. Manual for the installation and conduction of soil loss experiments = Manual para la instalación y conducción de experimentos de pérdida de suelos. FAO Regional Office for Latin America and the Caribbean, Santiago, Chile (in Spanish).
- Volk, L.B.S.; Cogo, N.P. 2009. Relationships between size of eroded sediments, runoff velocity, surface roughness created by tillage, and size of aggregates in a soil submitted to different managements. Revista Brasileira de Ciência do Solo 33: 1459-1471. https://doi.org/10.1590/S0100-06832009000500036 (in Portuguese, with abstract in English).
» https://doi.org/10.1590/S0100-06832009000500036 - Zöbisch, M.A.; Klingspor, P.; Oduor, A.R. 1996. The accuracy of manual runoff and sediment sampling from erosion plots. Journal of Soil and Water Conservation 51: 231-233.
Edited by
Publication Dates
-
Publication in this collection
08 July 2020 -
Date of issue
2021
History
-
Received
24 Apr 2019 -
Accepted
07 Jan 2020