
ABSTRACT:
Results of nutrient requirements as determined in dose-response trials are valid only for fish within the same size range of that of experimental model fish. This study used the factorial approach to estimate digestible energy (DE) and digestible protein (DP) requirements for maintenance and growth of pacu ( Piaractus mesopotamicus ). Juvenile pacu (63.5 ± 1.27 g) were stocked in a recirculation system (26.89 ± 0.36 °C) for 58 days, and fed two daily meals. One diet contained 6.96 % lipids (LF) and another 9.98 % lipids (HF), both diets formulated to contain 32 % crude protein, theoretical dietary energy level for maintenance (52.23 kJ DE kg−0.80 d−1), in a completely randomized, 2 × 5 factorial experimental design. The apparent digestibility coefficients of energy and protein were 84.66 ± 0.27 % and 89.20 ± 0.61 %, respectively, determined in specific assays for the HF diet, while for the LF diet, the values were 84.52 ± 0.37 % and 89.19 ± 0.16 %, respectively. The analysis of growth and carcass composition data revealed that dietary requirements of digestible energy and protein for maintenance were not influenced by dietary lipid levels; however, requirements of growth digestible energy were higher for fish fed the LF diet (1.39) than for fish fed the HF diet (1.29). The requirement of DP for growth, expressed as g of DP per g of deposited protein, were higher for fish fed the LF diet than for fish fed the HF diet (1.70 vs 1.58).
Keywords:
factorial modeling; energy requirement; dietary lipids; digestibility; energy utilization
Introduction
Nutritional requirements of pacu Piaractus mesopotamicus have already been assessed by dose-response models, including energy, protein and amino acids requirements (e.g. Bicudo et al., 2009Bicudo, A.J.A.; Sado, R.Y.; Cyrino, J.E.P. 2009. Dietary lysine requeriment of juvenile pacu Piaractus mesopotamicus (Holmberg, 1887). Aquaculture 297: 151-156. , 2010Bicudo, A.J.A.; Sado, R.Y.; Cyrino, J.E.P. 2010. Growth performance and body composition of pacu Piaractus mesopotamicus (Holmberg 1887) in response to dietary protein and energy levels. Aquaculture Nutrition 16: 213-222. ; Fernandes et al., 2001Fernandes, J.B.K.; Carneiro, D.J.; Sakomura, N.K. 2001. Sources and levels of crude protein in diets for pacu ( Piaractus mesopotamicus ) fingerlings. Revista Brasileira de Zootecnia 30: 617-626 (in Portuguese, with abstract in English). ). Nutrient requirements as determined in dose-response trials are expressed as dietary nutrient or energy contents. However, such results are valid only for fish with body weights within the same range of that of fish used as the experimental model ( Thornley and France, 2007Thornley, J.H.M.; France, J. 2007. Mathematical Models in Agriculture: Quantitative Methods for the Plant, Animal and Ecological Sciences. CAB Internacional, Wallingford, UK. ). In the factorial model approach, digestible energy (DE) requirements are partitioned for maintenance (DEm) and growth (1/ kg(ED) ) and expressed per unit of metabolic weight and energy retention, regardless of fish size and weight ( Amrkolaie et al., 2013Amrkolaie, A.K.; Yansari, A.T.; Khalesi, M.K. 2013. Calculation of protein and energy requirements in beluga sturgeon ( Huso huso ) using a factorial approach. Journal of Animal Physiology and Animal Nutrition 97: 485-494. ).
Composition of diets affect the efficiency of DE retention ( kg(ED) ), and utilization of DE by fish frequently increases when dietary energy stems from lipids instead of carbohydrates ( Rodehutscord and Pfeffer, 1999Rodehutscord, M.; Pfeffer, E. 1999. Maintenance requirement for digestible energy and efficiency of utilisation of digestible energy for retention in rainbow trout, Oncorhynchus mykiss . Aquaculture 179: 95-107. ; Schrama et al., 2012Schrama, J.W.; Saravanan, S.; Geurden, I.; Heinsbroek, L.T.; Kaushik, S.J.; Verreth, J.A. 2012. Dietary nutrient composition affects digestible energy utilisation for growth: a study on Nile tilapia ( Oreochromis niloticus ) and a literature comparison across fish species. British Journal of Nutrition 108: 277-289. ). Theoretical estimations from biochemical production of ATP, either from glycolytic or lipid synthesis, and deposition routes help to explain the experimental findings ( Blaxter, 1989Blaxter, K. 1989. Energy Metabolism in Animals and Man. Cambridge University Press, Cambridge, UK. ). These limitations may be overcome by the use of the factorial approach to determine fish nutrient requirements, which has not been used to investigate the partitioning of DE and DP for pacu. Therefore, the aim of the current study was to set basis for the use of the factorial approach to estimate the DE and DP requirements for maintenance and growth of the species, considering a possible effect of dietary lipid content.
Material and Methods
Experimental diets
Two practical diets, one with low lipid (fat - LF) contents (6.75 % lipids; LF) and another with high lipid contents (9.68 % lipids; HF) were formulated and processed to contain 32 % of dietary protein. Dietary protein to digestible energy ratio (2.2 g CP MJ−1 DE) and amino acid contents followed recommendations of Bicudo et al. (2009Bicudo, A.J.A.; Sado, R.Y.; Cyrino, J.E.P. 2009. Dietary lysine requeriment of juvenile pacu Piaractus mesopotamicus (Holmberg, 1887). Aquaculture 297: 151-156. , 2010Bicudo, A.J.A.; Sado, R.Y.; Cyrino, J.E.P. 2010. Growth performance and body composition of pacu Piaractus mesopotamicus (Holmberg 1887) in response to dietary protein and energy levels. Aquaculture Nutrition 16: 213-222. ) ( Table 1 ). Feedstuffs were homogenized through a 1.0-mm sieve, mixed, moistened and extruded (2.0 mm die; PQ-30 experimental extruder; Imbramaq, Riberão Preto, SP, Brazil). Extruded diets were dried in a forced air oven (50 °C; 24 h) and pellets were hermetically packed in plastic bags and stored at 4 °C until use.
Experimental system and animals
Juvenile pacu (63.5 ± 1.27 g) were stocked in 30, 300-L plastic tanks (13 fish per tank), set up in a closed-loop system under constant temperature and dissolved oxygen conditions and monitoring, 12 h light period, in a completely randomized, 2 × 5 factorial experimental design, with two diets (LF vs HF), and five feeding levels (theoretical maintenance, 25, 50, 75, and 100 % of apparent satiety) (n = 3).
Fish were fed the experimental diets in two daily meals (8h00 and 16h00) for 58 days; overfeeding and feed wastes were carefully monitored and prevented, and 100 % satiety feed biomass was adjusted weekly according to fish growth rate. Water quality parameters remained constant and within the comfort zone of the species (temperature = 26.89 ± 1.36 °C, dissolved oxygen = 6.91 ± 1.96 mg L−1; pH = 7.51 ± 0.14; unionized ammonia levels: below detection threshold) for the duration of the trial.
A pooled sample of six fish from the original stock was euthanized ( AFS, 2014American Fisheries Society [AFS]. 2014. Guidelines for the Use of Fishes in Research: Use of Fishes in Research Committee (Joint Committee of the American Fisheries Society, the American Institute of Fishery Research Biologists, and the American Society of Ichthyologists and Herpetologists). American Fisheries Society, Bethesda, MD, USA. ) by anesthetic overdose (eugenol, 200 mg L−1), quick frozen, grounded, homogenized, and a triplicate sample of homogenized carcasses was analyzed to determine the entire body composition of fish before starting the feeding trial. The theoretical dietary energy level for maintenance (52.23 kJ ED kg−0.80 d−1) was obtained as average of values reported for several species ( Booth et al., 2010Booth, M.A.; Allan, G.L.; Pirozzi, I. 2010. Estimation of digestible protein and energy requirements of yellowtail kingfish Seriola lalandi using a factorial approach. Aquaculture 307: 247-259. ; Lupatsch et al., 2001Lupatsch, I.; Kissil, G.W.; Sklan, D. 2001. Optimization of feeding regimes for European sea bass Dicentrarchus labrax: a factorial approach. Aquaculture 202: 289-302. ; Peres and Oliva-Teles, 2005Peres, H.; Oliva-Teles, A. 2005. Protein and energy metabolism of European seabass ( Dicentrarchus labrax ) juveniles and estimation of maintenance requirements. Fish Physiology and Biochemistry 31: 23-31. ; Schrama et al., 2012Schrama, J.W.; Saravanan, S.; Geurden, I.; Heinsbroek, L.T.; Kaushik, S.J.; Verreth, J.A. 2012. Dietary nutrient composition affects digestible energy utilisation for growth: a study on Nile tilapia ( Oreochromis niloticus ) and a literature comparison across fish species. British Journal of Nutrition 108: 277-289. ; Trung et al., 2011Trung, D.V.; Diu, N.T.; Hao, N.T.; Glencross, B. 2011. Development of a nutritional model to define the energy and protein requirements of tilapia, Oreochromis niloticus . Aquaculture 320: 69-75. ). Handling, feeding, and sampling procedures of fish were duly approved by CEUA-ESALQ-USP protocols # 2014-01 and 2014-13.
Sampling and chemical analysis
At the end of the trial, fish fasted for 16 h, and all fish from each tank were euthanized by anesthetic overdose (eugenol, 200 mg L−1), weighed, quick frozen, ground and homogenized. Samples of homogenized material (180 g) were lyophilized until constant weight and analyzed to determine dry matter (DM), crude protein (CP), crude fat, and ash contents ( AOAC, 2000Association of Official Analytical Chemists [AOAC]. 2000. Official Methods of Analysis, 17ed. AOAC International, Gaithersburg, MD, USA. ). Moisture was determined by oven-drying samples to constant weight (105 °C); CP was determined by the Kjeldahl method (N × 6.25); lipids were determined by ether extraction (EE); ash was determined by burning samples in a muffle furnace at 550 °C for 24 h; and gross energy was estimated in an adiabatic calorimeter pump using benzoic acid as standard.
Digestibility trial
Apparent digestibility coefficients (ADC) of energy and protein of experimental diets were determined by the indirect method, using chromic oxide (Cr2O3) as inert marker (1.0 g kg−1). Samples of the experimental diets were ground to incorporate the marker and cold-extruded again (commercial mincer; 2 mm die). Juvenile pacu (113.74 ± 4.52 g) were adapted to laboratory conditions for 30 days and then stocked in three, 80-L cylindrical plastic cages (20 fish per cage) housed in 1000-L plastic tanks. Fish were fed manually to apparent satiety two daily meals (8h00 and 16h00) for nine days prior the period of feces collection to adapt to the experimental marked diet. Along the experimental period, 1.5 h after the last meal, fish were transferred to cylindrical, conical-bottomed aquaria (200 L) under aeration and continuous water exchange, coupled to refrigerated plastic bottles for feces collection by sedimentation. Fecal material was collected at 23h30 and 7h30 of the following day ( Kitagima and Fracalossi, 2010Kitagima, R.E.; Fracalossi, D.M. 2010. Validation of a methodology for measuring nutrient digestibility and evaluation of commercial feeds for channel catfish. Scientia Agricola 67: 611-615. ). Feces samples were transferred to 50-mL tubes, centrifuged under refrigeration (3,100 g; 4 °C; 10 min), and lyophilized for subsequent analysis. The levels of chromic oxide were quantified in diets and feces by colorimetry after nitro-perchloric acid digestion ( Bremer-Neto et al., 2005Bremer-Neto, H.; Graner, C.A.F.; Pezzato, L.E.; Padovani, C.R. 2005. The spectrophotometric method on the routine of 1,5-diphenylcarbazide was adjusted on chromium determination in feces, after its utilization as a biological marker as chromium (III) oxide. Ciência Rural 35: 691-697 (in Portuguese, with abstract in English). ), and chemical composition of feces and diets determined as previously described.
Apparent digestibility coefficients of nutrient were determined using the following equation ( Abimorad et al., 2008Abimorad, E.G.; Squassoni, G.H.; Carneiro, D.J. 2008. Apparent digestibility of protein, energy, and amino acids in some selected feed ingredients for pacu Piaractus mesopotamicus . Aquaculture Nutrition 14: 374-380. ; Kitagima and Fracalossi, 2010Kitagima, R.E.; Fracalossi, D.M. 2010. Validation of a methodology for measuring nutrient digestibility and evaluation of commercial feeds for channel catfish. Scientia Agricola 67: 611-615. ):
where: ADCnutrient (%) is the apparent digestibility coefficient of nutrient or energy in the diet; Cr 2 O 3 diet is percent chromic oxide contents of diets; % Cr 2 O 3 feces is the percent chromic oxide contents of feces; Nutrientfeces is percent nutrient or gross energy contents of feces; and nutrient diet is the percent nutrient or gross energy contents of diets.
Calculations of performance parameters
The data collected allowed calculating the following performance parameters ( NRC, 2011National Research Council [NRC]. 2011. Nutrient Requirements of Fish and Shrimp. Animal Nutrition Series. USDA-National Research Council, Washington, DC, USA. ):
-
Daily weight gain
-
Feed conversion ratio
-
Protein efficiency ratio
-
Daily protein gain
-
Efficiency of retention of digestible protein
-
Energy retention rate
-
Efficiency of retention of digestible energy
where: Wf is final body weight (g); Wi is initial body weight (g); FI is feed intake (g); PI is protein intake (g); BPf is final body protein (%); BPi is initial body protein (%); BEf is final body gross energy (kJ g−1); BEi is initial body gross energy (kJ g−1); GEI is gross energy intake ( kJ ); ADCCP is apparent digestible coefficient of crude protein; and ADCGE is apparent digestible coefficient of gross energy.
Models for partitioning DE, ME and DP
A linear regression curve between daily DE intake (DEI, x ) and retained energy (RE, y ), both expressed per unit of metabolic weight (kg0.80), was fitted to experimental data using the geometric mean of body weight ( Pirozzi et al., 2010Pirozzi, I.; Booth, M.A.; Allan, G.L. 2010. Protein and energy utilization and the requirements for maintenance in juvenile mulloway ( Argyrosomus japonicus ). Fish Physiology and Biochemistry 36: 109-121. ). The allometric exponent 0.8, accepted for scaling energetic metabolism in several species ( Booth et al., 2010Booth, M.A.; Allan, G.L.; Pirozzi, I. 2010. Estimation of digestible protein and energy requirements of yellowtail kingfish Seriola lalandi using a factorial approach. Aquaculture 307: 247-259. ; Lupatsch et al., 2003Lupatsch, I.; Kissil, G.W.; Sklan, D. 2003. Comparison of energy and protein efficiency among three fish species gilthead sea bream ( Sparus aurata ), European sea bass ( Dicentrarchus labrax ) and white grouper ( Epinephelus aeneus ): energy expenditure for protein and lipid deposition. Aquaculture 225: 175-189. ; Schrama et al., 2012Schrama, J.W.; Saravanan, S.; Geurden, I.; Heinsbroek, L.T.; Kaushik, S.J.; Verreth, J.A. 2012. Dietary nutrient composition affects digestible energy utilisation for growth: a study on Nile tilapia ( Oreochromis niloticus ) and a literature comparison across fish species. British Journal of Nutrition 108: 277-289. ) was validated for pacu by Aguilar et al. (2017)Aguilar, F.A.A.; Cruz, T.M.P.; Mourão, G.B.; Cyrino, J.E.P. 2017. Water temperature, body mass and fasting heat production of pacu ( Piaractus mesopotamicus ). Anais da Academia Brasileira de Ciências 89: 1305-1312. and duly used ( Model 1 ):
where: DE is the digestible energy requirement (kJ d−1); DEm is the maintenance energy requirement (kj DE kg−b d−1); kg ( DE ) is the efficiency utilization of digestible energy for energy retention above the maintenance level; RE is the energy retention (kJ d−1); and b is the allometric exponent. Similarly, the model was fitted to the metabolizable energy intake (MEI). For that purpose, the non-fecal N excretion was calculated as the difference between the digestible N intake (digestible protein intake ÷ 6.25) and N retention (protein retention ÷ 6.25). The energy loss associated to this excretion coefficient was calculated using the energetic equivalents of 24.9 kJ g−1 ammonia N ( Elliott and Davison, 1975Elliott, J.M.; Davison, W. 1975. Energy equivalents of oxygen consumption in animal energetics. Oecologia 19: 195-201. ), assuming 100 % of N is excreted as ammonia by fish. Therefore:
where: ME is the metabolizable energy requirement (kJ d−1); MEm is the maintenance energy requirement (kj ME kg−b d−1); kg ( ME ) is the efficiency utilization of ME above the maintenance for energy retention; and RE is energy retention (kJ d−1). The allometric exponent 0.8 was also assumed and used in this scenario. In another approach of the factorial model, the RE was partitioned in energy for protein deposition and for lipid (fat) deposition ( Lupatsch et al., 2003Lupatsch, I.; Kissil, G.W.; Sklan, D. 2003. Comparison of energy and protein efficiency among three fish species gilthead sea bream ( Sparus aurata ), European sea bass ( Dicentrarchus labrax ) and white grouper ( Epinephelus aeneus ): energy expenditure for protein and lipid deposition. Aquaculture 225: 175-189. ; Pirozzi et al., 2010Pirozzi, I.; Booth, M.A.; Allan, G.L. 2010. Protein and energy utilization and the requirements for maintenance in juvenile mulloway ( Argyrosomus japonicus ). Fish Physiology and Biochemistry 36: 109-121. ). Therefore, the model for estimating DE requirements was:
where: kp ( DE ) and kf ( DE ) represent the efficiencies of DE utilization for fat and protein deposition; REp is the energy retention as protein; REf is the energy retention as fat, and, therefore, REp + REf = RE. Both REf and REp were expressed as kJ kg−0.8 d−1. The heat of combustion for fat and protein was estimated by multiple linear regressions from energy, protein and lipid contents on the fish body composition samples ( Lupatsch et al., 2003Lupatsch, I.; Kissil, G.W.; Sklan, D. 2003. Comparison of energy and protein efficiency among three fish species gilthead sea bream ( Sparus aurata ), European sea bass ( Dicentrarchus labrax ) and white grouper ( Epinephelus aeneus ): energy expenditure for protein and lipid deposition. Aquaculture 225: 175-189. ; Pirozzi et al., 2010Pirozzi, I.; Booth, M.A.; Allan, G.L. 2010. Protein and energy utilization and the requirements for maintenance in juvenile mulloway ( Argyrosomus japonicus ). Fish Physiology and Biochemistry 36: 109-121. ). Regarding collinearity, the ridge regression (a biased regression technique) was used ( Bernier et al., 1987Bernier, J.F.; Calvert, C.C.; Famula, T.R.; Baldwin, R.L. 1987. Energetic efficiency of protein and fat deposition in mice with a major gene for rapid postweaning gain. Journal of Nutrition 117: 539-548. ). This approach was also fitted for ME, and so:
where: kp ( DE ) and kf ( DE ) represent the efficiencies of ME utilization for lipid and protein deposition. The parameters kp ( DE ), kf ( DE ), kp ( ME ) and kf ( ME ) were estimated according to the model proposed by Koong (1977)Koong, L.J. 1977. A new method for estimating energetic efficiencies. Journal of Nutrition 107: 1724-1728. ; briefly, DEm or MEm are estimated by the simple liner regression ( Model 1 or Model 2 ), and posteriorly, for partitioning the energy intake above the maintenance, that is, DE above the maintenance (DEA), a set of two equations is formulated:
where: P is the proportion of energy retained as lipid (fat), and (1–P) is, consequently, the part of dietary energy retained as protein. The parameter P is non-constant and affected by factors such as feeding level, diet composition, and maturity (age) of the animal. Values of P parameter increase with increasing DEA or MEA levels (values) and eventually reach a plateau. This effect of DEA or MEA on P can be represented by the Michaelis-Menten type equation ( Koong, 1977Koong, L.J. 1977. A new method for estimating energetic efficiencies. Journal of Nutrition 107: 1724-1728. ):
where: K represents the DEA in which 50 % of the DEA is used for fat deposition and was derived by iteration (minimizing the sum of squared difference between measured and calculated data) using Microsoft Excel®. Posteriorly, the estimated P values was replaced in the set of equations of Model 5 and the kp ( DE ) and kf ( DE ) values derived by iteration using the solver tool, minimizing the sum of squared difference between observed and estimated energy retention. The delete-one jackknife procedure was used to estimate uncertainties (standard deviation) of kp ( DE ) and kf ( DE ) ( Harris, 1998Harris, D.C. 1998. Nonlinear least-squares curve fitting with Microsoft Excel Solver. Journal of Chemical Education 75: 119-121. ).
The simplest version of the factorial model was used to estimate DP requirements:
where: DP is the digestible protein requirement (g d−1); DPm is the requirement of digestible protein for maintenance (g kg−b d−1); kg ( DP ) is the efficiency utilization of DP for protein deposition; RP is protein retention (g d−1); and b is the allometric exponent that, for this case, was fixed at 0.7, after suggestions of Booth et al. (2010)Booth, M.A.; Allan, G.L.; Pirozzi, I. 2010. Estimation of digestible protein and energy requirements of yellowtail kingfish Seriola lalandi using a factorial approach. Aquaculture 307: 247-259. and Pirozzi et al. (2010)Pirozzi, I.; Booth, M.A.; Allan, G.L. 2010. Protein and energy utilization and the requirements for maintenance in juvenile mulloway ( Argyrosomus japonicus ). Fish Physiology and Biochemistry 36: 109-121. .
Statistical analysis
Fish performance parameters were submitted to the ANOVA with the aid of the MIXED procedure of SAS software (SAS Institute, Cary, NC, USA). The effects of dietary lipid and feeding levels and the interaction between both variables were considered in the model. The Tukey test was used for means separation. Because of data heteroscedasticity, feedings levels were grouped for similar variances to ensure that different mean standard errors could be used in means treatment comparisons according to variance treatment group. The parameters of factorial model for digestible energy and digestible protein were estimated by regression using the NLMIXED procedure of SAS software. In the procedure, contrasts were performed for testing the hypothesis of the effect of dietary lipid levels on the factorial model parameters (α = 0.05). The ridge regression for estimating the combustion heat of protein and fat was performed in the R v. 3.4.0 (R Development Core Team, 2017. R: A Language and Environment for Statistical Computing; R Foundation for Statistical Computing, Vienna, Austria) with the aid of the ridge package ( Moritz and Cule, 2017Moritz, S.; Cule, E. 2017. Ridge: Ridge Regression with Automatic Selection of the Penalty Parameter; Package Version 2.2. The R Core Team, Vienna, Austria. ).
Results
Digestibility coefficients of experimental diets
The apparent digestibility coefficients of energy and protein for the HF diet were 84.66 ± 0.27 % and 89.20 ± 0.61 %, respectively. Concerning the LF diet, ADC of energy was 84.52 ± 0.37 % and of CP was 89.19 ± 0.16 %.
Fish performance and body composition
No casualties were recorded along the experimental period. Interaction between diet and feeding level was non-significant. Decreasing feeding level resulted in decreasing live weight gain. The feed conversion ratio, energy retention efficiency, and protein retention efficiency were affected by the feeding level. Decreases of feeding level resulted in poor feed efficiency and poor efficiency of retention of digestible nutrients. The protein retention efficiency and the PER were higher for fish fed the HF diet ( Table 2 ). The interaction between diet and feeding level was significant for the body composition variables. Dry matter, ash, lipid, and energy contents of fish were affected by the feeding level: increasing feeding level increased the carcass DM, lipid and energy contents; however, the ash contents decreased with increasing feeding levels ( Table 3 ).
Effect of feeding level and dietary fat level on productive performance (mean ± SEM) of juvenile pacu.
Effect of dietary fat content and feeding level on whole body composition and energy content (mean ± SEM) of juvenile pacu.
Energy and protein requirements for maintenance and growth
The linear relationship between digestible energy intake (DEI) and energy retention (ER) (both expressed as kJ kg−0.8 d−1) was:
and
The intercept of each equation corresponds to fasting heat production and the estimates did not differ between diets ( p > 0.05) ( Figure 1 ). The slope corresponds to ER of digestible energy above maintenance level and estimates differed between diets ( p < 0.05). In this approach, the slope reciprocal (1 /k ( DE )) corresponds to dietary DE requirements for growth (kJ of DE per kJ of ER); therefore, the requirement was 1.29 for fish fed the HF diet and 1.39 for fish fed the LF diet. The estimated requirement of DE for maintenance (DE intake for ER = 0) expressed as kJ DE kg−0.8 d−1 was 27.64 ± 2.37 for fish fed the HF diet, and 25.50 ± 2.57 for fish fed the LF diet, and these estimates did not differ ( p > 0.05).

Linear relationship between energy retention and digestible energy intake for pacu ( Piaractus mesopotamicus ). HF = High fat diet; LF = Low fat diet.
The linear relationship between metabolizable energy intake (MEI) and ER, both expressed as kJ kg−0.8 d−1, was ER = −21.36 (± 1.78) + 0.801 (± 0.013) × MEI, for the HL diet, and ER = −17.98 (± 1.76) + 0.752 (± 0.013) × MEI, for the LF diet.
Therefore, the estimated dietary requirement of ME for maintenance (ME intake for ER = 0) expressed as kJ ME kg−0.8 d−1 was 26.66 ± 1.82 for the HF diet, and 23.92 ± 1.97 for the LF diet. The estimates did not differ ( p > 0.05).
The heat of combustion for protein was 23.28 ± 0.86 kJ g−1, and for fat, 36.12 kJ ± 3.72 g−1. The average of DEm and MEm between the two diets were considered to calculate DEA and MEA, respectively. The K parameter for the Michaelis-Menten type equation was estimated as 131.65 kJ DE kg−0.8 d−1 and 127.77 kJ ME kg−0.8 d−1. The kf ( DE ) and kf ( ME ) parameters was very similar between diets; in turn, the kp ( ME ) and kp ( DE ) was higher for the HL diet than the LF diet ( Table 4 ).
Parameter estimates (± SD by the delete-one jackknife procedure) of factorial model for prediction of energy requirements for pacu according of dietary fat level.
The linear relationship between digestible protein intake (DPI) and protein retention (PR) (both expressed as g kg−0.7 d−1) was PR = −0.0333 (± 0.0321) + 0.632 (± 0.0151) × DPI, for the HL diet, and PR = −0.0588 (± 0.0318) + 0.5877 (± 0.0141) × DPI, for the LF diet.
The intercept of each equation corresponds to protein loss at fasting, and the estimates did not differ ( p > 0.05) ( Figure 2 ). The slope corresponds to retention efficiency of digestible protein above the level of maintenance and these parameter estimates differed between diets ( p < 0.05). The slope reciprocal corresponds to DP requirement for growth (g of DP per g of PR); therefore, the requirement was 1.58 for the HF diet and 1.70 for the LF diet. The estimated DP requirement for maintenance (DPI for RP = 0) expressed as g DP kg−0.7 d−1 was 0.0527 ± 0.0498 for the HF diet and 0.1001 ± 0.0519 for the LF diet, and no differences between estimates were detected ( p > 0.05).
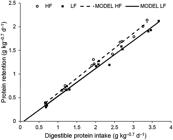
Linear relationship between protein retention and digestible protein intake for pacu ( Piaractus mesopotamicus ). HF = High fat diet; LF = Low fat diet.
Discussion
Improving feed conversion rate and increasing the retention efficiency of digestible nutrients (energy and protein) according to increases in the feeding level are essentially a result of decreasing nutrients cost for maintenance per each unit of growth increase, that is, the “dilution of maintenance” effect. This effect follows the “diminishing return law”, meaning that at a feeding level around the maintenance, the increasing digestible nutrient intake results in the highest efficiency of nutrient retention, but this response decreases until reaching an asymptotic value at high feeding levels ( Brody, 1945Brody, S. 1945. Bioenergetics and Growth, with Special Reference to the Efficiency Complex in Domestic Animals. Reinhold, New York, NY, USA. ). However, feed conversion could worsen at exceedingly high feeding levels if the maximum protein deposition capacity is surpassed and only fat is deposited as body mass ( Patience et al., 2015Patience, J.F.; Rossoni-Serão, M.C.; Gutierrez, N.A. 2015. A review of feed efficiency in swine: biology and application. Journal of Animal Science and Biotechnology 6: 1-9. ).
The higher values of protein efficiency ratio and retention efficiency of digestible protein registered for the HL diet could be associated to the “protein-sparing” effect of dietary lipids. Therefore, part of the dietary protein that is oxidized by fish to obtain energy is “spared” from this oxidation and then used for the synthesis and deposition of protein, that is, true growth ( Li et al., 2012Li, X.F.; Jiang, Y.Y.; Liu, W.B.; Ge, X.P. 2012. Protein-sparing effect of dietary lipid in practical diets for blunt snout bream ( Megalobrama amblycephala ) fingerlings: effects on digestive and metabolic responses. Fish Physiology and Biochemistry 38: 529-541. ; Sargent et al., 2002Sargent, J.R.; Tocher, D.R.; Bell, J.G.; 2002. The lipids. p. 181-257. In: Halver, J.E.; Hardy, R.W., eds. Fish nutrition. Academic Press, London, UK. ).
The increasing lipid (fat) contents of fish with increasing feeding levels is reflected in increased final body weight. Increasing body fat results in decreasing water and ash contents with growth and, consequently, increased body energy contents caused by the higher combustion heat of fat as compared to water and ash ( Amin et al., 2014Amin, M.N.; Carter, C.G.; Katersky Barnes, R.S.; Adams, L.R. 2014. Protein and energy nutrition of brook trout ( Salvelinus fontinalis ) at optimal and elevated temperatures. Aquaculture Nutrition 22: 527-540. ; Dumas et al., 2007Dumas, A.; De Lange, C.F.M.; France, J.; Bureau, D.P. 2007. Quantitative description of body composition and rates of nutrient deposition in rainbow trout ( Oncorhynchus mykiss ). Aquaculture 273: 165-181. ; Weatherley and Gill, 1987Weatherley, A.H.; Gill, H.S. 1987. The Biology of Fish Growth. Academic Press, London, UK. ).
Estimates of intercept of energy retention regression resulting from digestible energy intake were not affected by the dietary lipid level; therefore, the mean value −19.94 kg−0.8 d−1 was proposed and represents a negative energetic balance at fasting condition. This value is similar to 19.65 kJ kg−0.78 d−1 estimated for pacu by the fasting heat production prediction equation developed by Aguilar et al. (2007) for the mean of water temperature during the current assay (26.89 °C). Similarly, estimates of digestible energy requirements for maintenance were not affected by the dietary fat level, meaning that the average value (26.57 kJ kg−0.8 d−1) could be considered for bioenergetics and nutritional models. This value is lower than 34.86 kJ DE kg−0.84 d−1 estimated for brook trout Salvelinus fontinalis by Amin et al. (2014)Amin, M.N.; Carter, C.G.; Katersky Barnes, R.S.; Adams, L.R. 2014. Protein and energy nutrition of brook trout ( Salvelinus fontinalis ) at optimal and elevated temperatures. Aquaculture Nutrition 22: 527-540. , and 34.05 kJ DE kg−0.84 d−1 reported for white grouper Epinephelus aeneus by Lupatsch et al. (2003)Lupatsch, I.; Kissil, G.W.; Sklan, D. 2003. Comparison of energy and protein efficiency among three fish species gilthead sea bream ( Sparus aurata ), European sea bass ( Dicentrarchus labrax ) and white grouper ( Epinephelus aeneus ): energy expenditure for protein and lipid deposition. Aquaculture 225: 175-189. . Considering the range from 25.9 kJ DE kg−0.8 d−1 estimated for Nile tilapia Oreochromis niloticus by Trung et al. (2011)Trung, D.V.; Diu, N.T.; Hao, N.T.; Glencross, B. 2011. Development of a nutritional model to define the energy and protein requirements of tilapia, Oreochromis niloticus . Aquaculture 320: 69-75. up to 87.44 kJ DE kg−0.8 d−1 reported for yellowtail kingfish Seriola lalandi by Booth et al. (2010)Booth, M.A.; Allan, G.L.; Pirozzi, I. 2010. Estimation of digestible protein and energy requirements of yellowtail kingfish Seriola lalandi using a factorial approach. Aquaculture 307: 247-259. , pacu have a noticeable comparatively low dietary energy requirement for maintenance.
Dietary lipid level influenced the kg ( DE ) and kg ( ME ) estimates, the highest value recorded for fish fed the HF diet. Similar results have been reported for Nile tilapia and rainbow trout ( Rodehutscord and Pfeffer, 1999Rodehutscord, M.; Pfeffer, E. 1999. Maintenance requirement for digestible energy and efficiency of utilisation of digestible energy for retention in rainbow trout, Oncorhynchus mykiss . Aquaculture 179: 95-107. ; Schrama et al., 2012Schrama, J.W.; Saravanan, S.; Geurden, I.; Heinsbroek, L.T.; Kaushik, S.J.; Verreth, J.A. 2012. Dietary nutrient composition affects digestible energy utilisation for growth: a study on Nile tilapia ( Oreochromis niloticus ) and a literature comparison across fish species. British Journal of Nutrition 108: 277-289. ). These findings could be explained by the fact that heat increment resulting from dietary lipids is lower than that registered for carbohydrates, such as starch. Body fat synthesis from non-fat energy substrates (synthesis of fatty acids from glucose units, for instance) requires more ATP than the body fat synthesis from fatty acids originating from dietary fat, and causes the decline in kg ( DE ) and kg ( ME ) ( Emmans, 1994Emmans, G.C. 1994. Effective energy: a concept of energy utilization applied across species. British Journal of Nutrition 71: 801-821. ; Rodehutscord and Pfeffer, 1999Rodehutscord, M.; Pfeffer, E. 1999. Maintenance requirement for digestible energy and efficiency of utilisation of digestible energy for retention in rainbow trout, Oncorhynchus mykiss . Aquaculture 179: 95-107. ; Schrama et al., 2012Schrama, J.W.; Saravanan, S.; Geurden, I.; Heinsbroek, L.T.; Kaushik, S.J.; Verreth, J.A. 2012. Dietary nutrient composition affects digestible energy utilisation for growth: a study on Nile tilapia ( Oreochromis niloticus ) and a literature comparison across fish species. British Journal of Nutrition 108: 277-289. ). However, the “protein-sparing” effect of dietary lipids found for the HL diet is another route to improve energy retention efficiency. The recorded values for kg ( DE ) in the current study (0.778 for HF diet and 0.721 for a LF diet) were higher than those reported for brook trout (0.63), Nile tilapia (0.636), gilthead sea bream Sparus aurata (0.67), and both European sea bass Dicentrarchus labrax and white grouper Epinephelus aeneus (0.69) ( Amin et al., 2014Amin, M.N.; Carter, C.G.; Katersky Barnes, R.S.; Adams, L.R. 2014. Protein and energy nutrition of brook trout ( Salvelinus fontinalis ) at optimal and elevated temperatures. Aquaculture Nutrition 22: 527-540. ; Lupatsch et al., 2003Lupatsch, I.; Kissil, G.W.; Sklan, D. 2003. Comparison of energy and protein efficiency among three fish species gilthead sea bream ( Sparus aurata ), European sea bass ( Dicentrarchus labrax ) and white grouper ( Epinephelus aeneus ): energy expenditure for protein and lipid deposition. Aquaculture 225: 175-189. ; Schrama et al., 2012Schrama, J.W.; Saravanan, S.; Geurden, I.; Heinsbroek, L.T.; Kaushik, S.J.; Verreth, J.A. 2012. Dietary nutrient composition affects digestible energy utilisation for growth: a study on Nile tilapia ( Oreochromis niloticus ) and a literature comparison across fish species. British Journal of Nutrition 108: 277-289. ). Therefore, pacu have a higher efficiency of ER than the other referenced species even when fed diets containing low lipid levels.
In fish nutrition, most experimental estimations of energy requirements for maintenance and growth – DEm and kg ( DE ) – have been done by simple linear regression. However, this methodology does not consider that kg ( DE ) is influenced not only by the diet composition, but also by the composition of gain. It is well known and accepted that energy retention as deposition of lipids, that is, body fat, is more efficient than ER as protein deposition ( Emmans, 1994Emmans, G.C. 1994. Effective energy: a concept of energy utilization applied across species. British Journal of Nutrition 71: 801-821. ). Protein turnover, that is, the ordinary process of synthesis and degradation of body protein, has a high energetic cost and leads to heat increment – specific dynamic action – from feed intake and utilization, thus, decreasing kg ( DE ) and kg ( ME ) ( Hawkins, 1991Hawkins, A.J.S. 1991. Protein turnover: a functional appraisal. Functional Ecology 5: 222-233. ; Waterlow, 2006Waterlow, J.C. 2006. Protein Turnover. CAB International, Wallingford, UK. ). From this point of view, and given that the gain composition is not a constant phenomenon (i.e., fat deposition increases as function of fish growth), estimates of energy requirements for growth from the partition of RE in REf and REp could produce more accurate estimates along the whole production cycle ( Dumas et al., 2007Dumas, A.; De Lange, C.F.M.; France, J.; Bureau, D.P. 2007. Quantitative description of body composition and rates of nutrient deposition in rainbow trout ( Oncorhynchus mykiss ). Aquaculture 273: 165-181. ; van Milgen and Noblet, 1999Van Milgen, J.; Noblet, J. 1999. Energy partitioning in growing pigs: the use of a multivariate model as an alternative for the factorial analysis. Journal of Animal Science 77: 2154-2162. ). Nonetheless, accurate estimation of kp ( DE ) and kf ( DE ) or kp ( ME ) and kf ( ME ) is difficult, given the correlation between protein and fat deposition ( Azevedo et al., 2005Azevedo, P.A.; Van Milgen, J.; Leeson, S.; Bureau, D.P. 2005. Comparing efficiency of metabolizable energy utilization by rainbow trout ( Oncorhynchus mykiss ) and Atlantic salmon ( Salmo salar ) using factorial and multivariate approaches. Journal of Animal Science 83: 842-851. ; Bernier et al., 1987Bernier, J.F.; Calvert, C.C.; Famula, T.R.; Baldwin, R.L. 1987. Energetic efficiency of protein and fat deposition in mice with a major gene for rapid postweaning gain. Journal of Nutrition 117: 539-548. ; Koong, 1977Koong, L.J. 1977. A new method for estimating energetic efficiencies. Journal of Nutrition 107: 1724-1728. ; Van Milgen and Noblet, 1999Van Milgen, J.; Noblet, J. 1999. Energy partitioning in growing pigs: the use of a multivariate model as an alternative for the factorial analysis. Journal of Animal Science 77: 2154-2162. ).
In this study, the model proposed by Koong (1977)Koong, L.J. 1977. A new method for estimating energetic efficiencies. Journal of Nutrition 107: 1724-1728. was used to circumvent collinearity. The kp ( DE ), kf ( DE ), kp ( ME ) and kf ( ME ) estimates were similar to those reported for the yellowtail kingfish Seriola lalandi ( kp ( DE ) = 0.61; kf ( DE ) = 0.83) by Booth et al. (2010)Booth, M.A.; Allan, G.L.; Pirozzi, I. 2010. Estimation of digestible protein and energy requirements of yellowtail kingfish Seriola lalandi using a factorial approach. Aquaculture 307: 247-259. , and for the white grouper Epinephelus aeneus ( kp ( DE ) = 0.56; kf ( DE ) = 0.91) by Lupatsch et al. (2003)Lupatsch, I.; Kissil, G.W.; Sklan, D. 2003. Comparison of energy and protein efficiency among three fish species gilthead sea bream ( Sparus aurata ), European sea bass ( Dicentrarchus labrax ) and white grouper ( Epinephelus aeneus ): energy expenditure for protein and lipid deposition. Aquaculture 225: 175-189. . The combustion heat for fat and protein was also very similar to that reported for marine fish especies by Lupatsch et al. (2003)Lupatsch, I.; Kissil, G.W.; Sklan, D. 2003. Comparison of energy and protein efficiency among three fish species gilthead sea bream ( Sparus aurata ), European sea bass ( Dicentrarchus labrax ) and white grouper ( Epinephelus aeneus ): energy expenditure for protein and lipid deposition. Aquaculture 225: 175-189. . The kf ( DE ) and kf ( ME ) estimates were very similar between diets; however, the kp ( DE ) and kp ( ME ) estimates were higher for the HF diet than for the LF diet. The “protein-sparing” effect of dietary lipids was thus apparently the primary route for the increases on kg ( DE ) and kg ( ME ) registered for the HF diet.
The estimated requirements of digestible energy and digestible protein for the maintenance of pacu were lower than that reported for other fish species and were not influenced by the dietary lipid levels. On the other hand, estimates of digestible energy and digestible protein requirement for growth were higher for fish fed the LF diet. In other words, feeding farmed pacu with low-fat diets does not hamper growth and productivity and may yield leaner fish. The findings of the current study are a significant advance in the knowledge of nutrient metabolism of pacu and have implications for the design of feeding systems and programs for the species.
Acknowledgements
Authors thank São Paulo Research Foundation (FAPESP) for the support to the research project, grant #2012/21937-8. Fredy Armando Aguilar Aguilar is an international scholar of Coordination for the Improvement of Higher Level Personnel (CAPES). Gerson Barreto Mourão is a research scholar of Brazilian National Council for Scientific and Technological Development (CNPq).
References
- Abimorad, E.G.; Squassoni, G.H.; Carneiro, D.J. 2008. Apparent digestibility of protein, energy, and amino acids in some selected feed ingredients for pacu Piaractus mesopotamicus . Aquaculture Nutrition 14: 374-380.
- Aguilar, F.A.A.; Cruz, T.M.P.; Mourão, G.B.; Cyrino, J.E.P. 2017. Water temperature, body mass and fasting heat production of pacu ( Piaractus mesopotamicus ). Anais da Academia Brasileira de Ciências 89: 1305-1312.
- American Fisheries Society [AFS]. 2014. Guidelines for the Use of Fishes in Research: Use of Fishes in Research Committee (Joint Committee of the American Fisheries Society, the American Institute of Fishery Research Biologists, and the American Society of Ichthyologists and Herpetologists). American Fisheries Society, Bethesda, MD, USA.
- Amin, M.N.; Carter, C.G.; Katersky Barnes, R.S.; Adams, L.R. 2014. Protein and energy nutrition of brook trout ( Salvelinus fontinalis ) at optimal and elevated temperatures. Aquaculture Nutrition 22: 527-540.
- Amrkolaie, A.K.; Yansari, A.T.; Khalesi, M.K. 2013. Calculation of protein and energy requirements in beluga sturgeon ( Huso huso ) using a factorial approach. Journal of Animal Physiology and Animal Nutrition 97: 485-494.
- Association of Official Analytical Chemists [AOAC]. 2000. Official Methods of Analysis, 17ed. AOAC International, Gaithersburg, MD, USA.
- Azevedo, P.A.; Van Milgen, J.; Leeson, S.; Bureau, D.P. 2005. Comparing efficiency of metabolizable energy utilization by rainbow trout ( Oncorhynchus mykiss ) and Atlantic salmon ( Salmo salar ) using factorial and multivariate approaches. Journal of Animal Science 83: 842-851.
- Bernier, J.F.; Calvert, C.C.; Famula, T.R.; Baldwin, R.L. 1987. Energetic efficiency of protein and fat deposition in mice with a major gene for rapid postweaning gain. Journal of Nutrition 117: 539-548.
- Bremer-Neto, H.; Graner, C.A.F.; Pezzato, L.E.; Padovani, C.R. 2005. The spectrophotometric method on the routine of 1,5-diphenylcarbazide was adjusted on chromium determination in feces, after its utilization as a biological marker as chromium (III) oxide. Ciência Rural 35: 691-697 (in Portuguese, with abstract in English).
- Bicudo, A.J.A.; Sado, R.Y.; Cyrino, J.E.P. 2009. Dietary lysine requeriment of juvenile pacu Piaractus mesopotamicus (Holmberg, 1887). Aquaculture 297: 151-156.
- Bicudo, A.J.A.; Sado, R.Y.; Cyrino, J.E.P. 2010. Growth performance and body composition of pacu Piaractus mesopotamicus (Holmberg 1887) in response to dietary protein and energy levels. Aquaculture Nutrition 16: 213-222.
- Blaxter, K. 1989. Energy Metabolism in Animals and Man. Cambridge University Press, Cambridge, UK.
- Brody, S. 1945. Bioenergetics and Growth, with Special Reference to the Efficiency Complex in Domestic Animals. Reinhold, New York, NY, USA.
- Booth, M.A.; Allan, G.L.; Pirozzi, I. 2010. Estimation of digestible protein and energy requirements of yellowtail kingfish Seriola lalandi using a factorial approach. Aquaculture 307: 247-259.
- Dumas, A.; De Lange, C.F.M.; France, J.; Bureau, D.P. 2007. Quantitative description of body composition and rates of nutrient deposition in rainbow trout ( Oncorhynchus mykiss ). Aquaculture 273: 165-181.
- Elliott, J.M.; Davison, W. 1975. Energy equivalents of oxygen consumption in animal energetics. Oecologia 19: 195-201.
- Emmans, G.C. 1994. Effective energy: a concept of energy utilization applied across species. British Journal of Nutrition 71: 801-821.
- Fernandes, J.B.K.; Carneiro, D.J.; Sakomura, N.K. 2001. Sources and levels of crude protein in diets for pacu ( Piaractus mesopotamicus ) fingerlings. Revista Brasileira de Zootecnia 30: 617-626 (in Portuguese, with abstract in English).
- Harris, D.C. 1998. Nonlinear least-squares curve fitting with Microsoft Excel Solver. Journal of Chemical Education 75: 119-121.
- Hawkins, A.J.S. 1991. Protein turnover: a functional appraisal. Functional Ecology 5: 222-233.
- Kitagima, R.E.; Fracalossi, D.M. 2010. Validation of a methodology for measuring nutrient digestibility and evaluation of commercial feeds for channel catfish. Scientia Agricola 67: 611-615.
- Koong, L.J. 1977. A new method for estimating energetic efficiencies. Journal of Nutrition 107: 1724-1728.
- Li, X.F.; Jiang, Y.Y.; Liu, W.B.; Ge, X.P. 2012. Protein-sparing effect of dietary lipid in practical diets for blunt snout bream ( Megalobrama amblycephala ) fingerlings: effects on digestive and metabolic responses. Fish Physiology and Biochemistry 38: 529-541.
- Lupatsch, I.; Kissil, G.W.; Sklan, D. 2001. Optimization of feeding regimes for European sea bass Dicentrarchus labrax: a factorial approach. Aquaculture 202: 289-302.
- Lupatsch, I.; Kissil, G.W.; Sklan, D. 2003. Comparison of energy and protein efficiency among three fish species gilthead sea bream ( Sparus aurata ), European sea bass ( Dicentrarchus labrax ) and white grouper ( Epinephelus aeneus ): energy expenditure for protein and lipid deposition. Aquaculture 225: 175-189.
- Moritz, S.; Cule, E. 2017. Ridge: Ridge Regression with Automatic Selection of the Penalty Parameter; Package Version 2.2. The R Core Team, Vienna, Austria.
- National Research Council [NRC]. 2011. Nutrient Requirements of Fish and Shrimp. Animal Nutrition Series. USDA-National Research Council, Washington, DC, USA.
- Peres, H.; Oliva-Teles, A. 2005. Protein and energy metabolism of European seabass ( Dicentrarchus labrax ) juveniles and estimation of maintenance requirements. Fish Physiology and Biochemistry 31: 23-31.
- Patience, J.F.; Rossoni-Serão, M.C.; Gutierrez, N.A. 2015. A review of feed efficiency in swine: biology and application. Journal of Animal Science and Biotechnology 6: 1-9.
- Pirozzi, I.; Booth, M.A.; Allan, G.L. 2010. Protein and energy utilization and the requirements for maintenance in juvenile mulloway ( Argyrosomus japonicus ). Fish Physiology and Biochemistry 36: 109-121.
- Rodehutscord, M.; Pfeffer, E. 1999. Maintenance requirement for digestible energy and efficiency of utilisation of digestible energy for retention in rainbow trout, Oncorhynchus mykiss . Aquaculture 179: 95-107.
- Sargent, J.R.; Tocher, D.R.; Bell, J.G.; 2002. The lipids. p. 181-257. In: Halver, J.E.; Hardy, R.W., eds. Fish nutrition. Academic Press, London, UK.
- Schrama, J.W.; Saravanan, S.; Geurden, I.; Heinsbroek, L.T.; Kaushik, S.J.; Verreth, J.A. 2012. Dietary nutrient composition affects digestible energy utilisation for growth: a study on Nile tilapia ( Oreochromis niloticus ) and a literature comparison across fish species. British Journal of Nutrition 108: 277-289.
- Thornley, J.H.M.; France, J. 2007. Mathematical Models in Agriculture: Quantitative Methods for the Plant, Animal and Ecological Sciences. CAB Internacional, Wallingford, UK.
- Trung, D.V.; Diu, N.T.; Hao, N.T.; Glencross, B. 2011. Development of a nutritional model to define the energy and protein requirements of tilapia, Oreochromis niloticus . Aquaculture 320: 69-75.
- Van Milgen, J.; Noblet, J. 1999. Energy partitioning in growing pigs: the use of a multivariate model as an alternative for the factorial analysis. Journal of Animal Science 77: 2154-2162.
- Waterlow, J.C. 2006. Protein Turnover. CAB International, Wallingford, UK.
- Weatherley, A.H.; Gill, H.S. 1987. The Biology of Fish Growth. Academic Press, London, UK.
Edited by
Publication Dates
-
Publication in this collection
16 Oct 2020 -
Date of issue
2021
History
-
Received
31 Jan 2020 -
Accepted
23 June 2020


