ABSTRACT
Wood characterization must be done in huge populations of Eucalyptus breeding programs in order to efficiently select potential trees. In this study, Eucalyptus benthamii wood was non-destructively characterized and the performance of near infrared (NIR) spectroscopy in estimating the wood basic density, lignin, extractive, glucose, xylan contents and total carbohydrates was evaluated. NIR models for wood traits were performed from 481 trees from E. benthamii progeny test (4-year-old) managed for pulp cultivated in Santa Catarina state, Southern Brazil. Increment cores were sampled for chemical and physical characterization in laboratory, as well as for NIR spectroscopy analyses. Three 350 samples were selected from PCA for model calibrations whereas 131 were reserved for independent test validation. The E. benthamii wood presented the standards required for Kraft pulp processing. The predictive NIR models showed satisfactory ability for estimating the chemical properties of wood. The prediction models for total lignin, extractive and xylan contents and total carbohydrates showed coefficients of determination of 0.53, 0.65; 0.36 and 0.53, with RPD values for these traits ranging from 1.3 to 2.3. The predictive model for basic density of wood and glucose presented low coefficient of determination (0.13 and 0.10). However, isn’t possible to use these models for ranking in genetic selection because there was no correlation. Therefore, NIR spectroscopy can potentially be applied in breeding programs, as it enables an early, non-destructive selection of trees with adequate physical and chemical properties for pulp production process.
Keywords:
Physicochemical traits; Wood characterization non-destructively; Wood quality
RESUMO
A caracterização da madeira deve ser feita em grandes populações dos programas de melhoramento de eucaliptos, a fim de selecionar eficientemente árvores potenciais. Neste estudo, a madeira de E. benthamii foi caracterizada de forma não destrutiva e avaliou-se o desempenho da espectroscopia de infravermelho próximo (NIR) na estimativa da densidade básica da madeira, lignina, extrativos, glicose, xilanas e carboidratos totais. Modelos NIR para características da madeira foram realizados a partir de 481 árvores do teste de progênie de E. benthamii (4 anos de idade) destinada a produção de celulose no estado de Santa Catarina, no sul do Brasil. Baguetas foram amostrados para caracterização química e física em laboratório, bem como para análises de espectroscopia NIR. 350 amostras foram selecionadas via PCA para calibrações de modelos, enquanto 131 foram reservadas para o teste de validação independente. A madeira de E. benthamii apresentou os padrões exigidos para processo de polpa Kraft. Os modelos preditivos NIR apresentaram capacidade satisfatória para estimar as propriedades químicas da madeira. Os modelos de predição para teores totais de lignina, extrativos, xilanas e carboidratos totais apresentaram coeficientes de determinação de 0,53, 0,65, 0,36 e 0,53, com valores de RPD variando de 1,3 a 2,3. O modelo preditivo para a densidade básica da madeira e glicose apresentaram baixo coeficiente de determinação (0,13 e 0,10). No entanto, não é possível usar esses últimos modelos para classificação e seleção genética porque não houve correlação. Porém, o modelo para extrativos apresentou boa qualidade e pode ser usado para predição e melhoramento genético. Portanto, a espectroscopia NIR tem potencial para ser aplicada em programas de melhoramento, pois permite uma seleção precoce e não destrutiva de árvores para propriedades químicas do processo de produção de celulose.
Palavras chave:
fisioquímicas; Caracterização não destrutiva da madeira; Qualidade da madeira
INTRODUCTION
Brazil has become a reference in Eucalyptus forestry due to its great advances in traditional breeding and improvements in forestry management practices. The total Eucalyptus planted area in Brazil was 7.8 million hectares in 2015: 11.6% of this surface is concentrated in the South (IBÁ, 2016). Eucalyptus benthamii is a species of commercial importance in Southern Brazil because it is highly resistant to cold, and it also presents good adaptation and volumetric growth. The breeding of this species is very recent, with current strategies focusing on selecting intraspecific and multi-species hybrids, i.e., hybrid individuals that combine several important features to increase yield, resistance to cold, and, in particular, the quality of wood suitable for pulp production. Eucalyptus benthamii is a species with a very narrow genetic basis; the little knowledge available stems from the fact that only a few individuals have been sampled (FONSECA et al., 2010FONSECA, S. M.; RESENDE, M. D.V.; ALFENAS, A.C.; GUIMARAES, L.M.S.; ASSIS, T.F.; GRATTAPAGLIA, D. Manual prático de melhoramento genético do eucalipto. Viçosa: Editora UFV, 2010. 200p.; ALVES et al., 2011ALVES, I.C.N.; GOMIDE, J.L.; COLODETTE, J.L. and SILVA, H.D.Technological characterization of Eucalyptus benthamii wood for Kraft pulp production. Ciência Florestal, v. 21, p. 167-174, 2011.).
Evaluating wood quality in breeding populations can be challenging because it is not always possible to fell an elite tree, due to its genetic value in the breeding programme. Thus, non-destructive evaluation methods are required to enable the collection of a small wood sample without compromising the survival of the individual. Another important factor is wood assessment age, given that wood properties can only be determined after a tree has reached its harvest age (PASQUINI et al., 2007PASQUINI, C.; CARNEIRO, J.G.C.;BOMFIM, P.M. Development and validation of multivariate model employing Near Infrared Spectroscopy for Eucalyptus wood characteristics estimations. O Papel , v. 68, p. 3, 2007. ), which hinders selection time and generation advancement. Hence, the minimum optimal assessment age that allows a good correlation with the quality of 7-year-old wood must be determined to enable earlier breeding (SCHIMLECK et al., 2005SCHIMLECK, L.R.; PAYNE, P. and WEARNE, R.H. Determination of important pulp properties of hybrid poplar by near infrared spectroscopy. Wood and Fiber Science, v. 37, p. 3, 2005.).
Considering the need for early and non-destructive analysis, near infrared (NIR) spectroscopy - which has been used for several purposes in laboratory research and industrial processes - has been pointed out as a quick and inexpensive method, which has greatly contributed to the chemical (RAYMOND; SCHIMLECK, 2002RAYMOND, C.A.;SCHIMLECK, L.R. Development of near infrared reflectance analysis calibrations for estimating genetic parameters for cellulose content in Eucalyptus globulus. Canadian Journal of Forest Research, v. 32, p. 170-176, 2002.; SOUSA, 2008SOUSA, L.C. Use of Near Infra Red Spectroscopy to predict Eucalyptus wood characteristics for cellulose production. 2008. PhD thesis. Universidade Federal de Viçosa, Viçosa/MG.; VIANA et al., 2010VIANA, L.C.; TRUGILHO, P.F.; HEIN, P.R.G.; SILVA, J.M.; LIMA, J.T. Calibration models and near infrared spectroscopy for predicting chemical properties and wood basic density in Eucalyptus. Ciência Florestal , v. 20, p. 2, 2010.; MILAGRES, 2013MILAGRES, F.R. Espectroscopia DE infravermelho próximo para predição de propriedade da madeira e híbridos de Eucalyptus spp. 2013. PhD thesis. Universidade Federal de Viçosa, Viçosa/ MG ., RAMADEVI et al., 2016RAMADEVI, P.; HEGDE, D.V.; VARGHESE,M; KAMALAKANNAN, R, GANAPATHY, S.P.; GURUMURTHY, D.S. Evaluation of lignin syringyl/guaiacyl ratio in Eucalyptus camaldulensis across three diverse sites based on near infrared spectroscopic calibration modelling with five Eucalyptus species and its impact on Kraft pulp yield. J. Near Infrared Spectroscopy , v. 24, p. 529-536, 2016.), physical analysis of major wood components (SCHIMLECK et al., 2005; HEIN et al., 2009HEIN, P.R.G.; LIMA, J.T. and CHAIX, G. Robustness of models based on near infrared spectra to predict the basic density in Eucalyptus urophylla wood. Journal of Near Infrared Spectroscopy, v. 17, p. 141-150, 2009., ROSOS et al., 2013), pulp yield (SANTOS et al., 2009SANTOS, R.B.; GOMIDE, J.L.; SOUSA, L.C. Prediction of wood and Kraft Pulp quality by Near Infrared Spectroscopy. Revista Árvore , Viçosa-MG, v.33, n.4, p.759-767, 2009. ) and ever paper properties (SAMISTRARO et al., 2009SAMISTRARO, G.; DE MUNIZ, G; G. I. B.; PERALTA-ZAMORA, P.; CORDEIRO, G.A. Previsão das propriedades físicas do papel Kraft por espectroscopia no infravermelho próximo (NIR) e regressão por mínimos quadrados parciais (PLS). Química Nova , v.32, n. 6, p.1422-1425, 2009.). Another application of NIR in trees was to indicate the technology can be used as an effective tool to distinguish between pure pine species and suggest that it will also distinguish hybrids from their parents (ESPINOZA; HODGE, 2012ESPINOZA, J. A.; HODGE, G.R.; DVORAK W.S. The potential use of Near Infrared Spectroscopy to discriminate between pine spices and their hybrids. Journal of Near Infrared Spectroscopy, v. 18, p. 437-447, 2012.). OLIVEIRA et al. (2015OLIVEIRA, A.A; SIQUEIRA, P.H.; NISGOSKI, S.; BOLZON DE MUNIZ, G.I.; FERREIRA, J.H. Identificação de Madeiras utilizando a Espectrometria no Infravermelho Próximo e Redes Neurais Artificiais. Tendências em Matemática Aplicada e Computacional, v. 16, n. 2 p.81-95, 2015. ), analysing the spectra of timber of four species of trees showed able to separate this species by NIR spectroscopy and Artificial Neural Networks. In another way, for native wood charcoal, near infrared spectrometry has been used to distinguish species (DAVRIEUX et al., 2010DAVRIEUX, F.; ROUSSET, P.L.A.; PASTORE, M.C.T.; MACEDO, L.A. and QUIRINO, W.F. Discrimination of native wood charcoal by infrared spectroscopy. Química Nova, v. 33, p. 1093-1097, 2010.; NISGOSKI et al., 2015NISGOSKI, S.; MUÑIZ, G.I.B.; MORRONE, S.R.; SCHARDOSIN, F.Z.; FRANÇA, R.F. NIR and anatomy of wood and charcoal from Moraceae and Euphorbiaceae species. Ciência da Madeira v. 6, n. 3, p. 183-190, 2015.). Another study combined visible and near-infrared spectroscopy to discriminate solid wood samples of two Corymbia spp. and five Eucalyptus spp. (NISGOSKI et al., 2017).
In regard to tree selection in breeding programs based on NIR spectroscopy information, many studies have presented promising findings. GREAVES et al. (1996) evaluated the genetic control of NIR spectra recorded on wood powder of 588 Eucalyptus nitens while HEIN and CHAIX (2014HEIN, P.R.G.;CHAIX, G. NIR spectral heritability: a promising tool for wood breeders. Journal of Near Infrared Spectroscopy , v. 22, p. 141-147, 2014.) have recorded NIR spectra on solid wood of Eucalyptus urophylla x E grandis hybrids clones. In both studies they have calculated the ratio between the genetic variance and phenotypic variance of the NIR absorbance values for each wavenumber producing broad-sense NIR spectral heritability estimates. reported that some ranges of the spectra taken on the wood of 6-year-old Eucalyptus clones presented heritability estimates greater than 0.50, indicating that the wood breeder could select potential trees using the most heritable NIR signature bands (HEIN; CHAIX, 2014).
Thus, the aim of this study was develop NIR-based calibrations for estimating wood density and glucose, xylan, lignin, extractive contents and total carbohydrates in Eucalyptus benthamii wood in order to efficiently select potential trees for improving next generations.
MATERIAL AND METHODS
Genetic material
A progeny test conducted with 81 mother plants of 4-year-old E. benthamii located at the municipality of Otacílio Costa (geographic coordinates (27º 28’ 59” S, 50º 07’ 19” W, 884 m) in Santa Catarina state, Brazil, was investigated for the wood characterization and NIR-based models development.
Sample collection and preparation
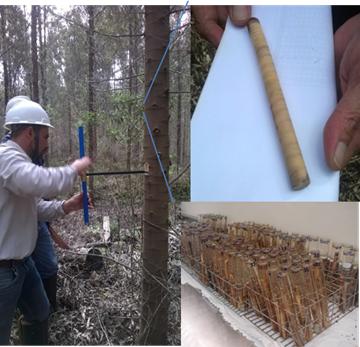
Sample for NIR spectra: non-destructive collection of 481 samples (Figure 1) was performed using a 12 mm increment borer to extract a bark-to-bark increment core at breast height. The cores were kept in a control room with 50% moisture and 23ºC (±2ºC) of tempeture. They were ground using a Wiley mill, followed by a cyclone mill, to uniform particle size. Samples were stored for at least 48 hours at room temperature under controlled humidity prior to acquisition of NIR spectra. For that purpose, sawdust was manually placed in the spectrophotometer sample chamber. The spectrophotometer was calibrated with the equipment’s internal reference standards.

Samples being taken from the standing tree (A). Increment core (B) and saturated samples (C) for determination of basic density of wood.
Sample for chemical analysis: 481 samples were selected by PCA (Principal Component Analysis). Sampling was separated in two groups, one for calibration (350 samples) and other for external validation (131 samples). Wet chemistry analysis was carried out in these selected samples at the Pulp and Paper Laboratory in the Federal University of Viçosa, southern Brazil.
Sample for wood basic density: 481 trees were sampled again at the same time. Non-destructive collection of the 481 samples was performed using a 12 mm increment borer to extract a bark-to-bark increment core at breast height. The basic density of wood was determined in the selected samples in Klabin facilities.
Spectral readings
The NIR spectra were acquired using a Bruker TANGO FT-NIR (Bruker Optics Ettlingen Germany) in diffuse reflectance mode; 32 scans were recorded from 10,000 to 4,000 cm-1 with a resolution of 16 cm-1. Two readings were performed per sample and the means of 64 scans were calculated and averaged to a single NIR spectrum.
Chemical analysis of wood
Wood samples were chemically analysed to determine the lignin, extractive, glucose, xylan, arabinans, galactans and mannan contents. And the total carbohydrates were considered as the sum of glucose, xylan, arabinans, galactans and mannan contents. Before analyses, the wood samples were ground and the sawdust samples were graded using 40 and 60 mesh sieves and stored in a room with constant temperature and humidity (23ºC and 50%, respectively), followed by storage in hermetically sealed vials. Chemical analyses were performed according to the standard methods (GOMIDE; DEMUNER (1986GOMIDE, J.L.; DEMUNER, B.J. Determination of lignin content in woody material: modification Klason Method. O Papel, v. 47, p. 8, 1986.); WALLIS et al., 1996WALLIS, A.F.A.; WEARNE, R.H.; WRIGHT, P.J. Analytical characteristics of plantation eucalypt woods relating to Kraft pulp yields. Appita Journalv. 49, p. 6, 1996.).
Determination of wood basic density
Basic density of wood was determined on increment cores using the hydrostatic balance method, according to an adaptation of the NBR 7190 (ABNT, 1997) for increment core. This parameter was calculated through the relationship between the absolute dry weight and the saturated volume of the samples.
Model Calibration
Partial Least Squares (PLS) regressions were calibrated and validated using the Unscrambler software (CAMO AS, Norway, version 10.2) for establishing the relationships between NIR spectra and wood traits. The samples were separated into two sets using the Kennard and Stone algorithm (KENNARD; STONE, 1969KENNARD, R.W.; STONE, L.A. Computer aided design of experiments. Technometrics, v. 11, p. 137-148, 1969.): 350 samples were used for calibration while 131 samples were used for external validations. Sample reflectance values acquired with the NIR spectrophotometer at various wavenumbers were associated with the concentrations of the chemical constituents of the samples. Principal Component Analyses (PCA) were performed for previewing the samples for calibration and validation sets and for detecting outliers.
The following selection criteria were adopted for the development of predictive calibration models: coefficient of determination of models (R²); root mean square error of cross-validation (RMSECV) and of prediction (RMSEP); and the lowest possible adequate number of PLS factors for each model. The RMSE (root mean square error) was calculated according to the equation [1], where: y i is known value of the sample constituent interest i; is the estimated value of the sample i by calibration; n is the number of samples used for the calibration development.
Ratio of Performance to Deviation (RPD=SD/RMSE) was used to evaluate the predictive models where SD is the standard deviation and RMSE is the root mean square error of cross-validation (RMSECV) or of prediction (RMSEP). This ratio evaluates calibration accuracy to discern samples (WILLIAMS; SOBERING, 1993WILLIAMS, P.C.; SOBERING, D.C. Comparison of commercial Near Infrared transmittance and reflectance instruments for analysis of whole grains and seeds. Journal of Near Infrared Spectroscopy , v. 1, p. 25-33, 1993.). High values RPD means that the error of trait estimation is smaller than the standard deviation of the samples. On another hand, low values indicate the inefficiency of the model. According to SCHIMLECK et al. (2003SCHIMLECK, L.R.; MORA, C.; DANIELS, R.F. Estimation of physical wood properties of green Pinus taeda radial samples by near infrared spectroscopy. Canadian Journal of Forest Research , v. 33, p. 2297-2305, 2003.) RPD ratios around 1.5 are useful for screening and can be used in breeding programs, but values above 2 for RPD are ideal.
The original (untreated) NIR spectra were used for PCA and first-derivative NIR spectra (15-point filter and a second order polynomial) using the Savitzky-Golay method (SAVITZKY; GOLAY, 1997SAVITZKY, A. and GOLAY, M.J.E. Smoothing and differentiation of data by simplified least-squares procedures. Analytical Chemistry, v. 36, p. 8, 1997.) were used for developing PLS regression models. Samples that visually differed from the remaining samples, with high leverage and high residual variance, were detected in graphical analysis as outliers and excluded from the calculations. First of all, outliers were detected in scores graphic (PCA), and also compared with the laboratory results, before to be left out.
Others treatments mathematical were tested, like SNV and MSC, but did not improve efficiency model, did not increase coefficient of determination of models, neither decrease error.
Use of NIR models in the breeding program
After all calibrate and validation models, in 720 individuals were collected wood sample of individuals not selected for calibration and validation groups (481), (item 2.2) for prediction wood density, lignin and carbohydrates (item 2.3). Around 1200 individuals had wood traits value predicted NIR include.
SELEGEN-REML / BLUP (RESENDE, 2007RESENDE, M.D.V. Selegen-REML/BLUP: Sistema estatístico e seleção genética computadorizada via modelos lineares mistos. Colombo: Embrapa Florestas, 2007. 359p.) was used to determine the variance components and genetic parameters. The mixed linear model (model 19) was used: y = Xr + Za + e In that y is the data vector, r is the vector of the repetition effects (assumed as fixed) added to the general mean, a is the vector of the individual additive genetic effects (assumed to be random), and e is the vector of errors or residues (Random). X and Z represent the incidence matrices for the said effects.
After calibrate and validation of models, were collected wood samples (item 2.2 - proceedings )of individuals not selected for calibration and validation groups , were evaluated 720 individuals for prediction wood density, lignin and carbohydrates (item 2.3-proceedings). The complete population, around 1200 individuals, were had value predicted NIR wood.
RESULTS AND DISCUSSION
The progeny test in this study was conducted with four-year-old trees to evaluate wood and silvicultural traits. Individual volumes averaged 0.1 m³, which is consistent with the average yield for this age in areas with the occurrence of frost. In the same region, the yield from operational-scale clonal plantations is 42 m³/ha/year at 7 years of age. This yield is above the national average, currently at 39 m³/ha/year (IBÁ, 2015).
NIR spectra of wood
The scores from Principal Component Analysis display the variability of the NIR spectra among the Eucalyptus trees. The score chart in Figure 2 displays the spectral variability of the experiment using principal component analysis (PCA). The first principal component (PC1) accounted for 72% of the spectra variability while the PC2 accounted for 24% of the spectral variation, for a combined total of 96% of the spectral data variation of the samples.

Principal component analysis of all samples and example outlier detected in scores graphic. Untreated data matrices were used for the development of PCA.
In the Figure 2, the outliers were detected in scores graphic (PCA) and also compared with the laboratory results, before to be left out (Table 1).
The first derivative NIR spectra ranging from 10,000 to 4,000 cm-¹ were recorded on increment cores of 350 trees (Figure 3). Each spectrum was analysed by PLS multivariate regression for correlation with the wood quality variables obtained from cylinders collected at breast height.

NIR MODELS FOR WOOD TRAITS
Basic Density
The model for wood basic density was calibrated with the PLS method using 5 factors (Figure 4) and reached values of 0.37 and 0.026 g.cm-³ for the coefficient of determination (R²) and RMSEC, respectively. Twenty groups were used for cross-validation, resulting in a coefficient of determination of 0.33 and RMSECV of 0.027 g.cm-³ (Table 1). For external validation, 131 samples, that were not included in the model calibration, were used for validation, resulting in a coefficient of determination of 0.13, a RMSEP of 0.023 g.cm-³ and, also presented almost acceptable RPD (1.4) value to screening, but due the low error. FANTUZZI et al. (2011) achieved better results working with Eucalyptus spp., with the wood density yielding a coefficient of determination of 0.87 (error: 0.01) and a prediction coefficient of determination of 0.68 (error: 0.017 g.cm-³).

Correlation of reference values versus predicted NIR for wood basic density (A), lignin (B), extractive (C), glucose (D), xylan (E) and total carbohydrate (F) for independent validation test set.
To our knowledge, only one study has used NIR spectra to predict wood basic density in E. benthamii (LAZZAROTTO; MAGALHÃES, 2014LAZZAROTTO, M.; MAGALHÃES, W.L.E.Near infrared spectroscopy use for non-destructive prediction in Eucalyptus benthamii e Eucalyptus pellita wood basic density. Technical Notice - Embrapa Florestas, n. 342, 2014. ): forty E. benthamii and 44 E. pellita trees were used to calibrate the model for wood basic density with coefficient of determination above 0.8 for the calibration, standard error of prediction of 0.027 g.cm-³ and coefficient of determination in prediction set of 0.62. PASQUINI et al, (2007PASQUINI, C.; CARNEIRO, J.G.C.;BOMFIM, P.M. Development and validation of multivariate model employing Near Infrared Spectroscopy for Eucalyptus wood characteristics estimations. O Papel , v. 68, p. 3, 2007. ), reported similar results in 926 Eucalyptus samples for model calibration and 126 samples for external validation. Their prediction error of wood density was 0.026 g.cm-³ with R² was 0.86. However, SOUSA et al. (2011SOUSA, L.C.; GOMIDE, J.L.; MILAGRES, F.R.; ALMEIDA, D.P. Development of NIRS calibration models for minimization of Eucalyptus spp wood analysis. Ciência Florestal , Santa Maria, v. 21, n. 3, p. 591-599, 2011.), working with Eucalyptus spp., found a coefficient of determination of 0.89, but error of 0.034 g.cm-³.
Thus, when comparing the wood basic density prediction errors found in the literature with the ones obtained in this study (0.023 g.cm-³), we conclude that the error is low, but isn’t possible to use this model to determine wood basic density for ranking in genetic selection because there isn’t correlation. The best way is to feed this model with the next samples that are analyzed until the model reaches good determination coefficients to predict basic wood density.
Total Lignin
Calibration of total lignin via PLS regression resulted in a model with nine factors (Figure 2), and values of 0.71 and 0.59 for the coefficient of determination and RMSEC, respectively. Twenty groups were used for the cross-validation, resulting in coefficient of determination of 0.71 and RMSECV of 0.59 (Table 1). External validation was performed using 131 samples not used for model calibration, resulting in a coefficient of determination of 0.53, RMSEP of 0.77 and presented acceptable RPD (1.5) value to screening. The lignin model can be used for screening in breeding programs.
Milagres et al. (2013MILAGRES, F.R. Espectroscopia DE infravermelho próximo para predição de propriedade da madeira e híbridos de Eucalyptus spp. 2013. PhD thesis. Universidade Federal de Viçosa, Viçosa/ MG .) found a coefficient of determination of 0.55 to 0.71 and an error of 0.9 to 1.1 in cross validation for the total lignin content model using 136 Eucalyptus spp hybrid trees at the ages 3-7 years. In E. urophylla, Hein et al. (2010HEIN, P.R.G.; LIMA, J.T.; CHAIX, G. Effects of sample preparation on NIR spectroscopic estimation of chemical properties of Eucalyptus urophylla S.T. Blake wood. Holzforschung, v. 64, p. 45-54, 2010.) found a coefficient of determination of 0.89 and an error of 0.42 in the fit of the total lignin content model using 60 samples, along with a coefficient of determination of 0.84 and error of 0.5 in the cross-validation. Santos et al. (2009SANTOS, R.B.; GOMIDE, J.L.; SOUSA, L.C. Prediction of wood and Kraft Pulp quality by Near Infrared Spectroscopy. Revista Árvore , Viçosa-MG, v.33, n.4, p.759-767, 2009. ) calibrated NIR models for Eucalyptus clones to wood quality. The models generated for total lignin content presented coefficient of determination (0.84) and low average prediction errors (0.65). The results of this study are similar to others in the literature for the Eucalyptus genus, demonstrating the potential use of the lignin prediction model developed herein.
Extractives
The model for extractive content was calibrated using the PLS regression method with seven factors (Figure 2), yielding a coefficient of determination of 0.82 and an RMSEC of 0.33. Cross-validation was performed using 20 groups, resulting in a coefficient of determination of 0.80 and an RMSECV of 0.35 (Table 1). External validation was performed using 131 samples that were not included in model calibration, resulting in a coefficient of determination of 0.65, RMSEP of 0.34 and presented high RPD value (2.3) to estimate and screening.
The NIR-based model for extractives presented above generated the best prediction results, consistent with the majority of studies found in the literature. Fantuzzi et al. (2011) reported a coefficient of determination of 0.90 and an error of 0.4, as well as a prediction coefficient of determination of 0.84 with an error of 0.5. Meanwhile, Sousa (2008SOUSA, L.C. Use of Near Infra Red Spectroscopy to predict Eucalyptus wood characteristics for cellulose production. 2008. PhD thesis. Universidade Federal de Viçosa, Viçosa/MG.) presented a low coefficient of determination (0.64) and an error of 0.65 in a calibration model for extractive contents in Eucalyptus spp. All studies involving NIR calibrations support the idea that the prediction model developed herein is adequate for predicting extractive content in wood, given that the prediction error (0.35) is lower than the values reported in other studies, and there was good correlation between the predicted value and the reference data (0.81). Santos et al. (2009SANTOS, R.B.; GOMIDE, J.L.; SOUSA, L.C. Prediction of wood and Kraft Pulp quality by Near Infrared Spectroscopy. Revista Árvore , Viçosa-MG, v.33, n.4, p.759-767, 2009. ) calibrated the NIR models for total extractive for Eucalyptus clones and found coefficient of determination (0.83) and low average prediction errors (0.21).
The extractive model in this study show good quality and can be used to predict this trait for breeding or determination. The extractive content, a variable of great interest technology, is an important indicator of quality of wood for cellulose, since wood with high extractive content consume more alkali, provide lower incomes and the formation of “pitch”.
Carbohydrates
The glucose model was calibrated using the PLS regression method with three factors (Figure 2), yielding a coefficient of determination and RMSEC of 0.24 and 0.55, respectively. Cross-validation yielded coefficient of determination and RMSECV values of 0.56 and 0.22, respectively (Table 1). External validation was performed on 131 samples not used to calibrate the model, generating a coefficient of determination of 0.10 and an RMSEP of 0.54. This model showed low predictive capacity, there is low range between the laboratory data (glucose content ranging from 44.5 to 48.5%), the variability was low in this trait. However, the glucose model in this study must not be used for the prediction or screening application.
The xylan model was calibrated using the PLS regression method with six factors (Figure 2), yielding a coefficient of determination and RMSEC of 0.61 and 0.57, respectively. Cross-validation yielded coefficient of determination and RMSECV values of 0.57 and 0.60, respectively (Table 1). External validation was performed on 177 samples not used to calibrate the model, generating a coefficient of determination of 0.36 and an RMSEP of 0.68.
These results are very low than others in the literature. Viana et al. (2010VIANA, L.C.; TRUGILHO, P.F.; HEIN, P.R.G.; SILVA, J.M.; LIMA, J.T. Calibration models and near infrared spectroscopy for predicting chemical properties and wood basic density in Eucalyptus. Ciência Florestal , v. 20, p. 2, 2010.) built a calibration model for glucose content in Eucalyptus spp., finding coefficient of determination 0.44 and 0.86 and errors ranging from 0.78 to 1.15 in cross-validation. In xylan calibration model found coefficient of determination 0.51 and 0.90 and errors ranging from 0.12 to 0.37 in cross-validation. Milagres (2013MILAGRES, F.R. Espectroscopia DE infravermelho próximo para predição de propriedade da madeira e híbridos de Eucalyptus spp. 2013. PhD thesis. Universidade Federal de Viçosa, Viçosa/ MG .) found coefficient of determination 0.59 and 0.64 and errors ranging from 0.58 to 0.92 for xylan and mananas, respectively.
On another hand, when comparing all parameters and RPD (Table 1) we assumed it is better to use the total carbohydrates model than isolated sugars. The total carbohydrates model was calibrated using the PLS regression method with six factors (Figure 2), yielding a coefficient of determination and RMSEC of 0.65 and 0.66, respectively. Cross-validation yielded coefficient of determination and RMSECV values of 0.69 and 0.61, respectively (Table 1). External validation was performed on 131 samples not used to calibrate the model, generating a coefficient of determination of 0.53 and an RMSEP of 0.76.
The values reported in this study are statistically acceptable; however, a literature search did not return models for the total carbohydrates, only isolated values for each sugar showing that the values found are within the normal range. Viana et al. (2010VIANA, L.C.; TRUGILHO, P.F.; HEIN, P.R.G.; SILVA, J.M.; LIMA, J.T. Calibration models and near infrared spectroscopy for predicting chemical properties and wood basic density in Eucalyptus. Ciência Florestal , v. 20, p. 2, 2010.) reported a calibration model for xylan content in Eucalyptus spp., finding correlation coefficients between 0.72 and 0.95 and errors ranging from 0.12 to 0.37 in cross-validation. In E. globulus, NIR analysis gives good calibrations for predicting cellulose content. The standard errors of calibration and prediction were generally 1 or lower indicating that cellulose content can be predicted from NIR spectra (RAYMOND; SCHIMLECK, 2002RAYMOND, C.A.;SCHIMLECK, L.R. Development of near infrared reflectance analysis calibrations for estimating genetic parameters for cellulose content in Eucalyptus globulus. Canadian Journal of Forest Research, v. 32, p. 170-176, 2002.).
Genetics parameters by NIR models
Firstly, the genetics parameters were studied for wood volume. The mean herit-abilities (h2a, h2mp, h2ad) for wood volume are among the values found in the literature for wood volume in Eucalyptus spp. (ROSADO et al., 2009ROSADO, A.M.; ROSADO, T.B.; RESENDE JUNIOR, M.F.R.; BHERING, L.L.; CRUZ, C.D. Ganhos genéticos preditos por diferentes métodos de seleção em progênies de Eucalyptus urophylla. Pesquisa Agropecuária Brasileira, v.44, n.12, p.1653-1659, 2009.; COSTA et al., 2016COSTA, R.M.L.; ESTOPA, R.A.; BIERNASKI, F.A.; MORI, E.S. Predição de ganhos genéticos em progênies de Eucalyptus benthamii Maiden & Cambage por diferentes métodos de seleção. Scientia Forestalis, v. 44, n. 109, p. 105-113, 2016.; HEN-RIQUES et al., 2017). The average heritability of progenies was of 0.6 and narrow-sense heritability was of 0.2 evidencing possibilities of success with selection.The progeny selection accuracy was 77% for the wood volume, indicating high accuracy in access to the true genetic variation from the observed phenotypic variation.
The physicochemical properties of the wood were determined in laboratory as presented in Table 2. For all non-phenotyped individuals in the laboratory, the wood characterization was also made by the constructed NIR models. The values of wood quality found for E. benthamii in this study is closed to E. urophylla x E. grandis at 3 years old, where Sousa (2008SOUSA, L.C. Use of Near Infra Red Spectroscopy to predict Eucalyptus wood characteristics for cellulose production. 2008. PhD thesis. Universidade Federal de Viçosa, Viçosa/MG.) analyzing 100 trees found for total lignin (27.9%), ex-tractives (1.5%) and wood basic density (0.395 g.cm-³).
Thereafter, genetic parameters of the population were determined for genetic breeding and selection (Table 2 e 3). Heritability estimates for wood quality are pre-sented in Table 3. The average heritability of progenies was of 0.6 and narrow-sense heritability was of 0.2 evidencing possibilities of success with selection.
For wood basic density at 3 years, Henriques et al. (2017) found 0.59 of individ-ual heritability and average heritability of progeny of 0.82, close to the heritability values found in this study, 0.68 and 0.80 (Table 3), respectively. Kien et al. (2008), evaluated cellulose content from breast-height increment cores in E. urophylla, found to moderate heritability for cellulose content (0.50), heritability for wood basic density was of 0.48 and coefficient of additive genetic variation 5.6%.
For wood traits the values of accuracy were high (84 to 90%) indicating greater confidence in the individual genetic values. The wood traits also presented high values of heritabilities, suggesting that these characters suffer less environmental influence.
Varghese et al. (2017) applied NIR calibration models developed for E. camal-dulensis to determinate wood properties. After studied the genetic parameters of natural provenances of Eucalyptus camaldulensis in southern India. They found low values for narrow-sense heritability for pulp yield had (0.20 ± 0.04), wood basic density (0.37 ± 0.06) and lignin (0.21 ± 0.05).
CONCLUDING REMARKS
The PLS-R models for estimating lignin and extractive contents presented acceptable predictive ability indicating that the estimates presented small errors and can be applied in breeding programmes of Eucalyptus benthamii. However, the statistics associated to the models for glucose and xylan is not satisfactory for initial screenings.
The model for wood basic density exhibited a low error associated with this technology (despite its low correlation). The PLS-R model for wood density is unsuitable to estimate the wood density values of unknown samples.
The NIR technology presents itself as a potential tool for the E. benthamii breeding program, enabling the early, non-destructive evaluation of important physical and chemical wood features for the pulp production process and allowing cost reduction of chemical analysis, which may also be optimized.
The speed and low cost of NIR technology will allow a rapid advance of breeding generations of E.benthamii, increasing productivity and improving the technological wood properties, which can contribute to the reduction of operational costs and the improvement of raw material performance in the industrial process.
REFERENCES
- ALVES, I.C.N.; GOMIDE, J.L.; COLODETTE, J.L. and SILVA, H.D.Technological characterization of Eucalyptus benthamii wood for Kraft pulp production. Ciência Florestal, v. 21, p. 167-174, 2011.
- CASTILLO, R.; CONTRERAS, D.; FREERA, J.; RUIZA, J. and VALENZUELA, S. Supervised pattern recognition techniques for classification of Eucalyptus species from leaves NIR spectra. Journal of Chilian v. 53, p. 1709-1713, 2008.
- COSTA, R.M.L.; ESTOPA, R.A.; BIERNASKI, F.A.; MORI, E.S. Predição de ganhos genéticos em progênies de Eucalyptus benthamii Maiden & Cambage por diferentes métodos de seleção. Scientia Forestalis, v. 44, n. 109, p. 105-113, 2016.
- DAVRIEUX, F.; ROUSSET, P.L.A.; PASTORE, M.C.T.; MACEDO, L.A. and QUIRINO, W.F. Discrimination of native wood charcoal by infrared spectroscopy. Química Nova, v. 33, p. 1093-1097, 2010.
- ESPINOZA, J. A.; HODGE, G.R.; DVORAK W.S. The potential use of Near Infrared Spectroscopy to discriminate between pine spices and their hybrids. Journal of Near Infrared Spectroscopy, v. 18, p. 437-447, 2012.
- FANTUZZI NETO, H. Qualidade da madeira de eucalipto para produção de celulose Kraft. 2012. 105p. PhD thesis. Universidade Federal de Viçosa, Viçosa/MG.
- FONSECA, S. M.; RESENDE, M. D.V.; ALFENAS, A.C.; GUIMARAES, L.M.S.; ASSIS, T.F.; GRATTAPAGLIA, D. Manual prático de melhoramento genético do eucalipto. Viçosa: Editora UFV, 2010. 200p.
- GREAVES, B.L.; SCHIMLECK, L.R.; BORRALHO, N.M.G.; MICHELL, A.J. Genetic control and repeatability of near infrared reflectance from Eucalyptus nitens woodmeal. Appita Journal v. 49, p. 423-426, 1996.
- GOMIDE, J.L.; DEMUNER, B.J. Determination of lignin content in woody material: modification Klason Method. O Papel, v. 47, p. 8, 1986.
- HEIN, P.R.G.;CHAIX, G. NIR spectral heritability: a promising tool for wood breeders. Journal of Near Infrared Spectroscopy , v. 22, p. 141-147, 2014.
- HEIN, P.R.G.; LIMA, J.T.; CHAIX, G. Effects of sample preparation on NIR spectroscopic estimation of chemical properties of Eucalyptus urophylla S.T. Blake wood. Holzforschung, v. 64, p. 45-54, 2010.
- HEIN, P.R.G.; LIMA, J.T. and CHAIX, G. Robustness of models based on near infrared spectra to predict the basic density in Eucalyptus urophylla wood. Journal of Near Infrared Spectroscopy, v. 17, p. 141-150, 2009.
- HENRIQUES, E.P; MORAES, C.B; SEBBENN, A.M.; TOMAZELLO FILHO, M.; MORAES, M.L.T; MORI, E.S. Estimativa de parâmetros genéticos para caracteres silviculturais e densidade do lenho em teste de progênies de Eucalyptus urophylla Scientia Forestalis , v. 44, n. 109, p. 105-113, 2016.
- HOFFMEYER, P.; PEDERSEN, J.G. Evaluation of density and strength of Norway spruce by near infrared reflectance spectroscopy. Holz als Roh und Werkstoff, v. 53, p. 3, 1995.
- IBÁ. Brazilian tree industry, Statistical yearbook 2016, Base year 2015.
- KIEN, N.D.; QUANG, T.H.; JANSSON, G.; HARWOOD, C.; CLAPHAM, D.; VON ARNOLD, S. Cellulose content as a selection trait in breeding for Kraft pulp yield in Eucalyptus urophylla, Ann. Forest Sci. v. 66, p. 708, 1-8, (2009).
- KENNARD, R.W.; STONE, L.A. Computer aided design of experiments. Technometrics, v. 11, p. 137-148, 1969.
- LAZZAROTTO, M.; MAGALHÃES, W.L.E.Near infrared spectroscopy use for non-destructive prediction in Eucalyptus benthamii e Eucalyptus pellita wood basic density. Technical Notice - Embrapa Florestas, n. 342, 2014.
- MAESTRI, R. Modelo de crescimento e produção para povoamentos clonais deEucalyptus grandisconsiderando variáveis ambientais. 2003. 143p. PhD thesis. Universidade Federal do Paraná, Curitiba.
- MILAGRES, F. R.; GOMIDE, J. L.; MAGATON, A. S.; FANTUZZI NETO, H. The influence of the age on near infrared spectroscopy models to prediction of the Eucalyptus spp wood properties. Revista Árvore v. 37, p. 1165-1173, 2013.
- MILAGRES, F.R. Espectroscopia DE infravermelho próximo para predição de propriedade da madeira e híbridos de Eucalyptus spp. 2013. PhD thesis. Universidade Federal de Viçosa, Viçosa/ MG .
- NISGOSKI, S.; MUÑIZ, G.I.B.; MORRONE, S.R.; SCHARDOSIN, F.Z.; FRANÇA, R.F. NIR and anatomy of wood and charcoal from Moraceae and Euphorbiaceae species. Ciência da Madeira v. 6, n. 3, p. 183-190, 2015.
- OLIVEIRA, A.A; SIQUEIRA, P.H.; NISGOSKI, S.; BOLZON DE MUNIZ, G.I.; FERREIRA, J.H. Identificação de Madeiras utilizando a Espectrometria no Infravermelho Próximo e Redes Neurais Artificiais. Tendências em Matemática Aplicada e Computacional, v. 16, n. 2 p.81-95, 2015.
- PASQUINI, C.; CARNEIRO, J.G.C.;BOMFIM, P.M. Development and validation of multivariate model employing Near Infrared Spectroscopy for Eucalyptus wood characteristics estimations. O Papel , v. 68, p. 3, 2007.
- RAMADEVI, P.; HEGDE, D.V.; VARGHESE,M; KAMALAKANNAN, R, GANAPATHY, S.P.; GURUMURTHY, D.S. Evaluation of lignin syringyl/guaiacyl ratio in Eucalyptus camaldulensis across three diverse sites based on near infrared spectroscopic calibration modelling with five Eucalyptus species and its impact on Kraft pulp yield. J. Near Infrared Spectroscopy , v. 24, p. 529-536, 2016.
- RAYMOND, C.A.;SCHIMLECK, L.R. Development of near infrared reflectance analysis calibrations for estimating genetic parameters for cellulose content in Eucalyptus globulus Canadian Journal of Forest Research, v. 32, p. 170-176, 2002.
- RESENDE, M.D.V. Selegen-REML/BLUP: Sistema estatístico e seleção genética computadorizada via modelos lineares mistos. Colombo: Embrapa Florestas, 2007. 359p.
- ROSADO, A.M.; ROSADO, T.B.; RESENDE JUNIOR, M.F.R.; BHERING, L.L.; CRUZ, C.D. Ganhos genéticos preditos por diferentes métodos de seleção em progênies de Eucalyptus urophylla. Pesquisa Agropecuária Brasileira, v.44, n.12, p.1653-1659, 2009.
- ROSSO, S.; MUNIZ, G.I.B; MATOS, J.L.M.; HASELEIN, C.R.; HEIN, P.R.G, LOPES, M.C. Density of Eucalyptus Grandis W. Hill Ex Maiden using Near Infrared Spectroscopy. Cerne, Lavras, v. 19, n. 4, p. 647-652, 2013.
- SAMISTRARO, G.; DE MUNIZ, G; G. I. B.; PERALTA-ZAMORA, P.; CORDEIRO, G.A. Previsão das propriedades físicas do papel Kraft por espectroscopia no infravermelho próximo (NIR) e regressão por mínimos quadrados parciais (PLS). Química Nova , v.32, n. 6, p.1422-1425, 2009.
- SAVITZKY, A. and GOLAY, M.J.E. Smoothing and differentiation of data by simplified least-squares procedures. Analytical Chemistry, v. 36, p. 8, 1997.
- SCHIMLECK, L.R.; PAYNE, P. and WEARNE, R.H. Determination of important pulp properties of hybrid poplar by near infrared spectroscopy. Wood and Fiber Science, v. 37, p. 3, 2005.
- SCHIMLECK, L.R.; MORA, C.; DANIELS, R.F. Estimation of physical wood properties of green Pinus taeda radial samples by near infrared spectroscopy. Canadian Journal of Forest Research , v. 33, p. 2297-2305, 2003.
- SOUSA, L.C. Use of Near Infra Red Spectroscopy to predict Eucalyptus wood characteristics for cellulose production. 2008. PhD thesis. Universidade Federal de Viçosa, Viçosa/MG.
- SOUSA, L.C.; GOMIDE, J.L.; MILAGRES, F.R.; ALMEIDA, D.P. Development of NIRS calibration models for minimization of Eucalyptus spp wood analysis. Ciência Florestal , Santa Maria, v. 21, n. 3, p. 591-599, 2011.
- SANTOS, R.B.; GOMIDE, J.L.; SOUSA, L.C. Prediction of wood and Kraft Pulp quality by Near Infrared Spectroscopy. Revista Árvore , Viçosa-MG, v.33, n.4, p.759-767, 2009.
- Technical Association of the Pulp and Paper Industry-TAPPI. T280 pm-99 standard - Acetone extractives of wood and pulp. TAPPI Press, 2000.
- VIANA, L.C.; TRUGILHO, P.F.; HEIN, P.R.G.; SILVA, J.M.; LIMA, J.T. Calibration models and near infrared spectroscopy for predicting chemical properties and wood basic density in Eucalyptus Ciência Florestal , v. 20, p. 2, 2010.
- WALLIS, A.F.A.; WEARNE, R.H.; WRIGHT, P.J. Analytical characteristics of plantation eucalypt woods relating to Kraft pulp yields. Appita Journalv. 49, p. 6, 1996.
- WILLIAMS, P.C.; SOBERING, D.C. Comparison of commercial Near Infrared transmittance and reflectance instruments for analysis of whole grains and seeds. Journal of Near Infrared Spectroscopy , v. 1, p. 25-33, 1993.
Publication Dates
-
Publication in this collection
Jul-Sep 2017
History
-
Received
01 Mar 2017 -
Accepted
18 Sept 2017