Abstract
Most Neotropical birds, including Pteroglossus aracaris, do not have an adequate fossil record to be used as time constraints in molecular dating. Hence, the evolutionary timeframe of the avian biota can only be inferred using alternative time constraints. We applied a Bayesian relaxed clock approach to propose an alternative interpretation for the historical biogeography of Pteroglossus based on mitochondrial DNA sequences, using different combinations of outgroups and time constraints obtained from outgroup fossils, vicariant barriers and molecular time estimates. The results indicated that outgroup choice has little effect on the Bayesian posterior distribution of divergence times within Pteroglossus , that geological and molecular time constraints seem equally suitable to estimate the Bayesian posterior distribution of divergence times for Pteroglossus , and that the fossil record alone overestimates divergence times within the fossil-lacking ingroup. The Bayesian estimates of divergence times suggest that the radiation of Pteroglossus occurred from the Late Miocene to the Pliocene (three times older than estimated by the “standard” mitochondrial rate of 2% sequence divergence per million years), likely triggered by Andean uplift, multiple episodes of marine transgressions in South America, and formation of present-day river basins. The time estimates are in agreement with other Neotropical taxa with similar geographic distributions.
Pteroglossus; Ramphastidae; aves; molecular time estimates; biogeography
GENETICS
The historical biogeography of Pteroglossus aracaris (Aves, Piciformes, Ramphastidae) based on Bayesian analysis of mitochondrial DNA sequences
Sérgio L. Pereira1
Anita Wajntal2
1Department of Natural History, Royal Ontario Museum, Toronto, Canada
2Departamento de Genética e Biologia Evolutiva, Universidade de São Paulo, São Paulo, SP, Brazil
Most Neotropical birds, including Pteroglossus aracaris, do not have an adequate fossil record to be used as time constraints in molecular dating. Hence, the evolutionary timeframe of the avian biota can only be inferred using alternative time constraints. We applied a Bayesian relaxed clock approach to propose an alternative interpretation for the historical biogeography of Pteroglossus based on mitochondrial DNA sequences, using different combinations of outgroups and time constraints obtained from outgroup fossils, vicariant barriers and molecular time estimates. The results indicated that outgroup choice has little effect on the Bayesian posterior distribution of divergence times within Pteroglossus, that geological and molecular time constraints seem equally suitable to estimate the Bayesian posterior distribution of divergence times for Pteroglossus, and that the fossil record alone overestimates divergence times within the fossil-lacking ingroup. The Bayesian estimates of divergence times suggest that the radiation of Pteroglossus occurred from the Late Miocene to the Pliocene (three times older than estimated by the “standard” mitochondrial rate of 2% sequence divergence per million years), likely triggered by Andean uplift, multiple episodes of marine transgressions in South America, and formation of present-day river basins. The time estimates are in agreement with other Neotropical taxa with similar geographic distributions.
Toucans, aracaris and toucanets (Aves, Piciformes, Ramphastidae) are a group of Neotropical birds easily recognized by their colorful bills that are light and several times bigger than their head, bright-colored feathers and long tails sometime making up half of the body length. Traditionally, six genera have been recognized in the family (Short and Horne, 2001), but molecular sequence analyses (Eberhard and Bermingham, 2005; Kimura et al., 2004) revealed that the saffron aracari in the monotypic genus Baillonius is embedded within Pteroglossus aracaris. Aracaris are medium-sized toucans, predominantly green above and yellow below, with a red rump and usually yellow, red or black-red ventral bands or spots; the saffron aracari, on the other hand, has a distinct yellow-green plumage, red and green bill, and red periophtalmic region (Short and Horne, 2001). The molecular finding is supported by vocalization (Haffer, 1974; Short and Horne, 2001) and anatomical characters (Hofling, 2004; Pires, 2008; Sick, 1997), leading the South American Classification Committee of the American Ornithologists' Union and the Brazilian Committee for Ornithological Records (Comissão Brasileira de Registros Ornitológicos) to merge Baillonius into Pteroglossus.
Considerable attention has been given to understand the tempo and mode of diversification of Ramphastidae. Haffer (1974) proposed that the generic radiation within Ramphastidae occurred in the Pleistocene and was influenced by alleged changes in forest distribution in tropical America due to glacial cycles of the Pleistocene. However, he later reformulated his hypothesis, suggesting that these vegetational changes may have also occurred prior to the Pleistocene (reviewed in Haffer, 1997). Nahum et al. (2003) estimated that genus diversification within Ramphastidae occurred from about 47 million years ago (Mya) in the Middle Eocene to about 9.5 Mya in the Late Miocene, based on partial sequences of the mitochondrial cytochrome (cyt) b and the ribosomal small subunit (12S rDNA) genes of one species of each genus. Eberhard and Bermingham (2005) obtained cyt b, ATPase subunits 8 and 6 (ATPase8/6) and cytochrome oxidase subunit I (COI) sequences for all but one species of Pteroglossus and estimated that the radiation within Pteroglossus initiated around 3 Mya in the Late Pliocene, and only few divergences occurred into the Pleistocene.
Considering Baillonius bailloni as Pteroglossusbailloni (Kimura et al., 2004), this species is part of the viridis superspecies group (sensu Haffer, 1974), and the split of viridis from the other superspecies groups is the only common node in Nahum et al. (2003) and Eberhard and Bermingham (2005). Eberhard and Bermingham (2005) estimated that the viridis group separated from other groups of Pteroglossus around 3 Mya, which is three times younger than the age proposed by Nahum et al. (2003). These differences can be explained in light of different calibration approaches taken in both studies. Nahum et al. (2003) applied a strict molecular clock, excluding taxa that evolved at a significantly higher or lower rate than the average, and calibrated the clock assuming the split between Galliformes and Piciformes to have occurred 100 Mya (Nahum et al., 2003). Given the lack of fossil or other reasonable molecular calibration data for the Ramphastidae, Eberhard and Bermingham (2005) applied the “standard” avian mitochondrial molecular clock rate of 2% sequence divergence per million years (Myr) (Shields and Wilson, 1987) to estimate divergence times for major nodes within Pteroglossus, based on uncorrected genetic distances.
Pereira and Baker (2006) demonstrated that avian rates of evolution are very heterogeneous across genes and across taxa and, in general, lower than the “standard” molecular clock rate. They also revisited the calibration point used to derive the “standard” avian molecular clock (Shields and Wilson, 1987) and concluded that the original calibration point was underestimated by 9.5 Myr. Hence, the application of the “standard” molecular clock in birds, including Pteroglossus, underestimates divergence times. It is therefore crucial that those estimates based on the “standard” molecular clock be revised.
We estimated divergence times among Pteroglossus by applying a Bayesian relaxed clock approach (Thorne and Kishino, 2002; Thorne et al., 1998) to a data set of mitochondrial DNA sequences. Because no Pteroglossus are known in the fossil record, we used non-Ramphastid fossils, as well as geological events assumed to have been an effective barrier leading to speciation among Neotropical taxa, and molecular divergence times obtained for other birds as time constraints. We also tested whether different types of time constraints were conflicting with each other, and whether using more distant outgroups and older time constraints would lead to overestimating divergence times within Pteroglossus. This study shows that speciation in Pteroglossus occurred in a temporal framework comparable to that of many Neotropical vertebrates with similar geographic distribution.
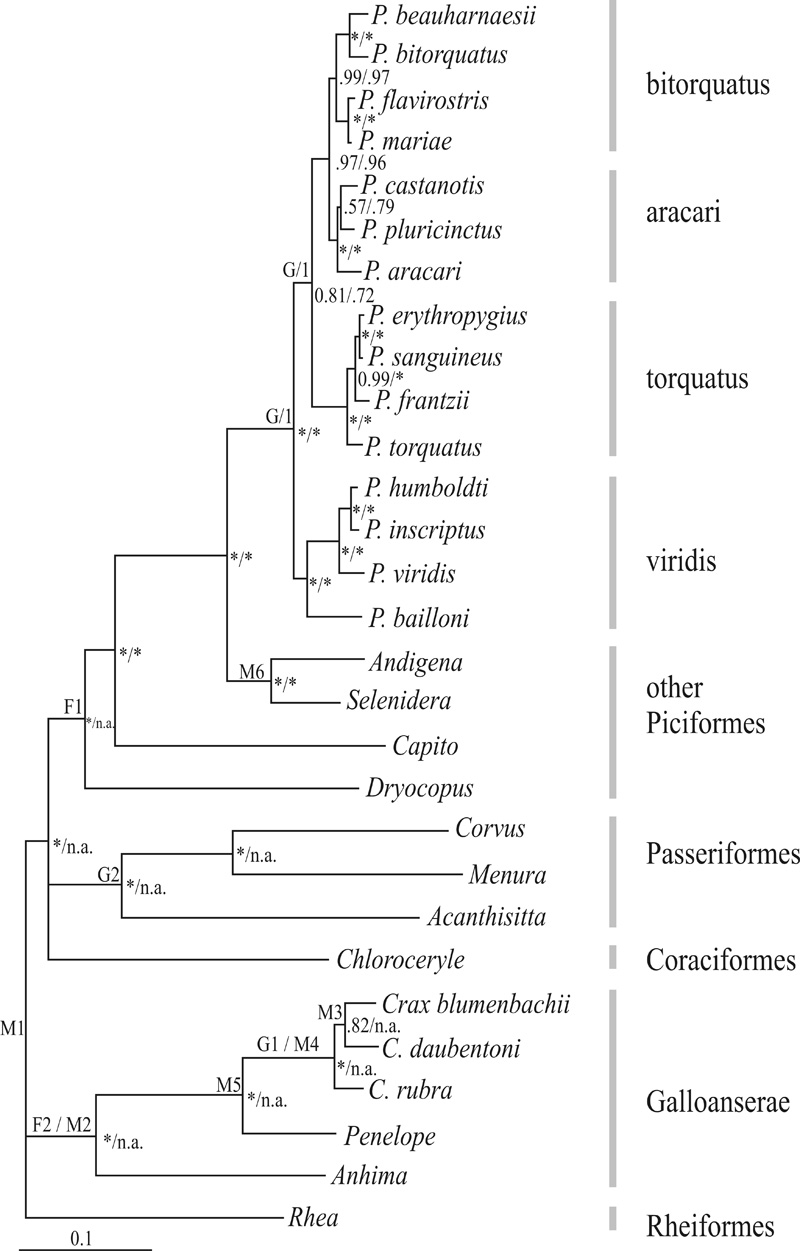
Figure 1 Multigene Bayesian consensus topology. Posterior probabilities for the analysis including all taxa or excluding Coraciiformes, Passeriformes and non-Ramphastid Piciformes are shown to the left and right of the slash, respectively. Posterior probabilities are indicated by * when 1.0. When taxa were not included in the analysis, posterior probabilities are indicated as not applicable (n.a.). Placement of fossil (F), geological (G) and molecular (M) time constraints are indicated by letters to the left of nodes and described in Methods. Grey bars to the right indicate Pteroglossus species groups and taxonomic affiliation of other species. Bar scale at bottom left represents expected number of substitutions per site.
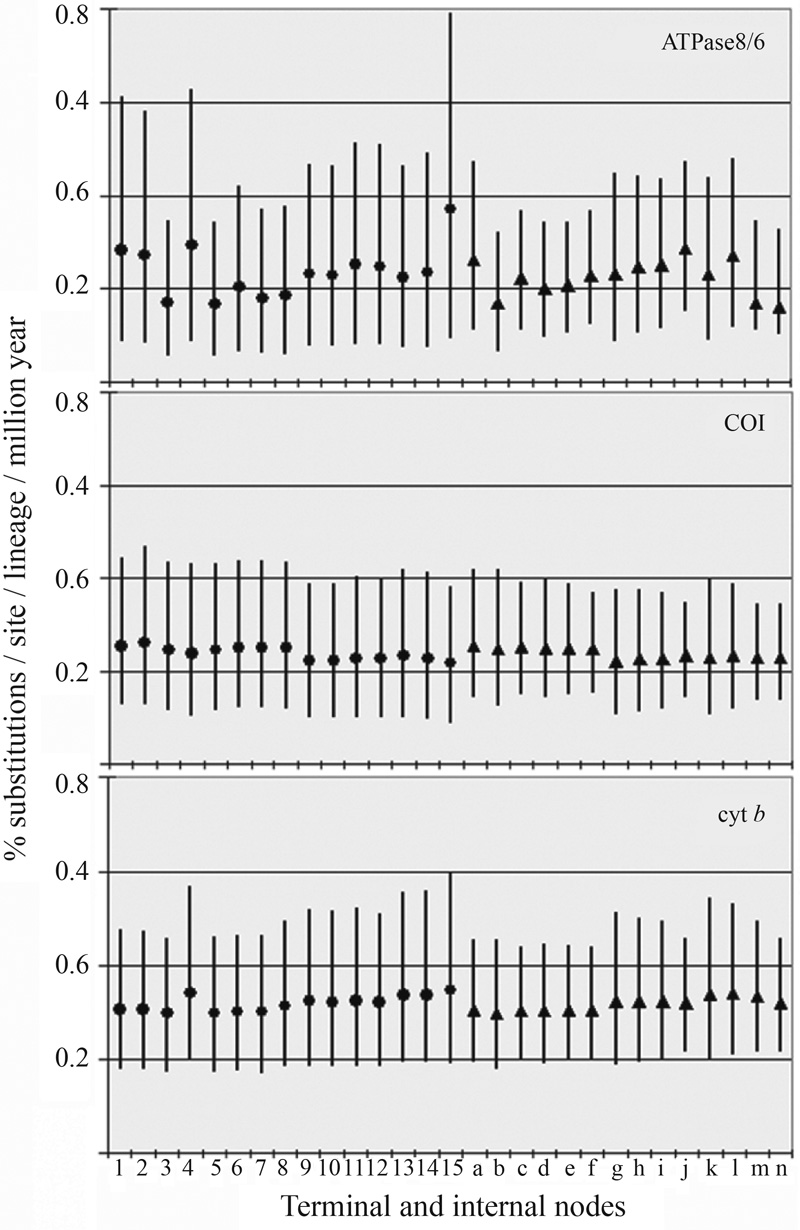
Figure 2 Bayesian posterior estimates of rates of evolution. Means are marked by filled circles numbered 1 to 15, representing each Pteroglossus species in Figure 1 from top to bottom, and marked by triangles for internal nodes as in Figure 3. Black bars are the estimated 95% credible intervals.
Figure 3 Chronogram and phylogenetic relationships among Pteroglossus. Node names as in Table 1 are indicated to the left of nodes. Grey bars at nodes are 95% credible intervals of the Bayesian posterior distribution of divergence times. Grey bars to the right are species groups as defined in this text. Geologic time scale is given below in million years ago (Mya).
The following Pteroglossus DNA sequences for ATPase8/6, COI and cyt b were retrieved from GenBank and used in the present study: AY661304, AY661305, AY661307, AY661309, AY661312, AY661313, AY661316, AY661318, AY661321, AY661323, AY661326, AY661328, AY661330, AY661332, AY661336, AY661267, AY661268, AY661270, AY661272, AY661275, AY661276, AY661279, AY661281, AY661284, AY661286, AY661289, AY661291, AY661293, AY661295, AY661299, AY661339, AY661340, AY661342, AY661344, AY661346, AY661347, AY661350, AY661352, AY661355, AY661357, AY661360, AY661362, AY661364, AY661366, AY661370, AY661373, AY661374, AY661375, AY661376, AY661377, AY661378, AY661379, AY661380, AY661381, AY661382, AY661383, AY661384, AY661385, AY661386, AY661387. Similarly, we retrieved DNA sequences from GenBank for other Ramphastidae and Piciformes (EU604306, AY959801, AF100555, AY661337, AY661300, AY661371, AY661372, EU604307, AY897017, AF123525, NC_008546), Coraciiformes (AF441612, AF441590, U89183), Passeriformes (AY325307, NC_002069, NC_007883), and more distant taxa (Anseriformes and Galliformes [Galloanserae] - EF373438, AY140729, AY140735, AY143688, AF165498, AF165474, AY143682, AF165492, AF165468, AY141905, AY141915, AY141925, AY141902, AY141912, AY141922), to cover the same gene regions sampled for Pteroglossus. The choice of non-Ramphastid taxa was based on their potential utility for imposing time constraints in the dating analyses as described below. The inclusion of Coraciiformes and Passeriformes was also based on the possible close relationships of these two groups and Piciformes, as suggested by molecular and morphological cladistic analyses (Ericson et al., 2006; Gibb et al., 2007; Livezey and Zusi, 2007). The final alignment was 2,158 base pairs (bp) long.
Prior to phylogenetic inference, we partitioned the data by gene fragments and performed selection of the best-fitting DNA substitution model according to the Akaike Information Criteria (AIC) as implemented in MrModeltest 2.0 (Nylander, 2004). We applied a Metropolis-coupled Markov chain Monte Carlo (MCMC) approach implemented in MrBayes 3.1.2 (Ronquist and Huelsenbeck, 2003) to infer the phylogenetic relationships among aracaris under two simultaneous independent runs, each starting with a different random tree. Each run had one cold and five heated chains to allow better mixing of the MCMC chain and minimizing the chance of being trapped in local optima. We also assumed a priori among-partition rate variation in DNA substitution models and assumed each gene partition to evolve according to the best-fitting model chosen by the AIC. All trees were considered equally likely. We rooted the tree with Rheaamericana (GenBank accession number NC_000846). We used the following priors to all partitions: unconstrained: exponential (10.0) for branch lengths, flat Dirichlet (1,1,1,1) for stationary base frequencies, flat Dirichlet (1,1,1,1,1,1) for the nucleotide substitution ratio, uniform distribution (0,200) for the shape parameter of the gamma distribution of rate variation, and uniform distribution (0,1) for the proportion of invariable sites. MCMC samples were taken every 1000th cycle. We considered that runs had reached convergence when the average standard deviation of the split frequencies between both simultaneous runs was smaller than 0.01. We also plotted the log likelihood of sampled topologies against Markov chain cycles to determine the burnin period in which the MCMC chain had reached a stationary status. Post-burnin samples from both simultaneous, independent runs were used to construct a 50% majority rule consensus tree. We considered nodes receiving ≥ 0.95 posterior probability scores to be strongly supported. To ensure that inclusion of very distant outgroups needed to calibrate the relaxed molecular clock would not influence the relationships within Pteroglossus, a second analysis of phylogenetic inference using Ramphastidae taxa only and rooting the tree with Capito was performed, using similar conditions as described above.
To evaluate the tree topologies obtained by Bayesian inference in MrBayes and a tree in which Pteroglossus bailloni was forced to be a separate sister genus (following the classical systematics of the group), we applied the approximately unbiased (AU) test (Shimodaira, 2002) as implemented in the program CONSEL version 0.1f (Shimodaira and Hasegawa, 2001). The AU test uses a multiscale bootstrap technique and site log-likelihoods when computing p-values for the topologies being tested. In contrast to tests that are more conservative, the multiscale bootstrap technique removes the bias of including more trees in the confident set as the number of trees being tested increases. The distribution of posterior probabilities for each alternative topology is obtained by counting the number of times the hypothesis is supported by the replicates.
Estimates of the Bayesian posterior distribution of divergence times were performed using the Multidivtime package (Thorne and Kishino, 2002; Thorne et al., 1998), which assumes a stochastic model of change in rates of DNA substitution over time. For each data partition, branch lengths and variance-covariance matrices were estimated in the program Estbranches (part of the Multidivtime package), based on maximum likelihood estimates of the transition/transversion ratio, nucleotide frequencies and gamma-distributed rates of substitution previously obtained for the Bayesian tree topology under the F84 + Γ model of DNA substitution in PAML 3.14 (Yang, 1997). This is the most complex model of DNA substitution that can be used with Multidivtime.
Three distinct sets of analyses were performed including all Pteroglossus and Capito species, varying the outgroup and the non-Ramphastidae taxa used. For taxon set 1, other Piciformes and Passeriformes were used as outgroups, and the tree was rooted with Coraciiformes; taxon set 2 included all taxa as in the taxon set 1 plus Galloanserae as the most distant outgroups and rooting the tree with Rhea americana; and finally, in taxon set 3, Galloanserae was the only outgroup to Ramphastidae, and the tree was rooted with Rhea americana. Because the method requires an outgroup to root the tree and imposes that the rate of change in the DNA substitution rate at the root node is the same at the beginning and at the end of that branch (Thorne et al., 1998), the taxon used to root the tree is not included in the final Bayesian posterior estimates of divergence times and rates of DNA substitution.
The Bayesian dating method was used, assuming a burnin period = 3000, sample frequency = 100, number of samples = 10,000 for analyses of all three taxon sets. The following gamma priors were used: for taxon sets 1 and 3, which had the same root and Galloanserae as the most distant outgroup, we set the expected time between tip and root (rttm) ± standard deviation (SD) = 122.2 ± 20 Mya, based on Bayesian estimates of divergence times derived from a mitogenomic data for vertebrates using multiple fossil constraints spread throughout the tree (Pereira and Baker, 2006), rate of the root node (rtrate) = 0.00327 substitutions per site per million years (s/s/Myr), as estimated from the data set as the median of the tip-to-root branch lengths for all genes. For taxon set 2, we used rttm = 108.0 ± 20 Mya, also based on Pereira and Baker (2006); rtrate and SD = 0.00358 s/s/Myr. For all three taxon sets, the SD for rtrate was set as the same value estimated for rtrate to reflect the prior uncertainty of SD. It seems of little practical importance to specify these priors, because they do not seem to greatly affect the Bayesian posterior distribution and because sequence data and temporal constraints should determine the overall rate and the age of the root (Pereira and Baker, 2006; Yang and Yoder, 2003). The prior for the rate change between ancestral (brownmean) and descendant nodes was set so that rttm x brownmean = 1, following the suggestion that this is a meaningful value for real and simulated data sets (Wiegmann et al., 2003). Because a priori information for rate change is unknown, a large SD value was chosen, as suggested by Thorne and Kishino (2002), which allows a gene to have a priori a large variation in rate change over time. Convergence of the MCMC algorithm was assessed by running multiple analyses, each starting with a different randomly selected initial state, and comparing the Bayesian posterior distribution of divergence times, branch lengths and the proportion of successful changes of those parameters along the Markov chain.
Temporal constraints in molecular dating. Unfortunately, there is no known fossil of Pteroglossus or other Ramphastid that could be used to set a minimum age for this genus. Hence, we could only set time constraints based on fossil data available for outgroups, geological events assumed to have been a vicariant barrier for other avian and non-avian groups with similar geographic distribution as Pteroglossus, or molecular time estimates derived from other studies. For time constraints based on the fossil record, we imposed a minimum age of 30 Mya for the separation of Picidae (Dryocopus) and Ramphastidae (Pteroglossus) (F1 in Figure 1) for taxon sets 1 and 2, based on Rupelramphastoides knopfi (Mayr, 2005), and the split between Anseriformes and Galliformes (taxon sets 2 and 3; F2 in Figure 1) at 65 Mya, based on anseriform Vegavis iaai (Clarke et al., 2005). For the geological time constraints in all taxon sets, we assumed that clades containing sister taxa with cis- and trans-Andean distribution (G1 in Figure 1) likely split when the northern end of the Cordillera of the Andes rose to present-day altitudes in the last 13 to 2 Mya (Gregory-Wodzicki, 2000; Lundberg et al., 1998). Many studies have suggested that this geological event is a major vicariant barrier that led to the speciation of many groups of vertebrates with similar geographic distribution in Central and South America (see Results and Discussion). For taxon sets 1 and 2, we also used the minimum age of 82 Mya for the split between the New Zealand wren Acanthisitta from other Passeriformes (Ericson et al., 2006) (G2 in Figure 1), assuming that the former was isolated when New Zealand broke off and drifted away from Australia around 82-85 Mya. For taxon set 3, we also imposed molecular time constraints, based on published time estimates. We fixed the separation of Galloanserae (Anhima, Penelope and Crax) from Ramphastidae at 122.2 Mya (M1 in Figure 1) and the separation between Anseriformes and Galliformes (M2 in Figure 1) at 105 Mya (Pereira and Baker, 2006). We also constrained divergence times in Galliformes to lie within the 95% confidence interval of the time estimates of Pereira and Baker (2004). In this case, we set the separation between Crax blumenbachii and C. daubentoni (M3 in Figure 1) to a minimum of 5.0 and a maximum of 7.6 Mya and the split between those two species and C. rubra between 5.4 and 8.2 Mya (M4 in Figure 1), for which the uplift of the northern Andes is the major vicariant event that led to their diversification. Similarly, we set the Crax – Penelope split (M5 in Figure 1) at 26.9-40.6 Mya (Pereira et al., 2002), and the divergence time between Andigena and Selenidera (M6 in Figure 1) to lie within the standard deviation estimated by Nahum et al. (2003), i.e., 23.9-31.7 Mya. The aforementioned time constraints were used in combination or separately for each taxon set described above, if the appropriate node to be constrained was included in that taxon set. We also performed two additional analyses for taxon set 3, one using molecular time constraints only, and the other geological time constraints only. The Bayesian dating method seems to be robust to variation in time constraint, because much of the temporal information should be extracted from the sequence data (Pereira and Baker, 2006). A comparison among these multiple analyses using different sets of time constraints and outgroups allowed us to evaluate the influence of types of time constraints and choice of outgroups in the Bayesian posterior distribution of divergence times among Pteroglossus.
The best-fitting models of DNA substitution were the GTR for ATPase8/6 and COI, and HKY for cytb. All gene partitions also required a proportion of invariable sites and gamma-distributed rate variation across sites. The AIC weights, which measure the uncertainty in model selection, were 1.0, 0.95 and 0.89 for ATPase8/6, COI and cyt b, respectively. These results suggest none to very little uncertainty in model selection. After seven million cycles, the split frequency between both simultaneous MCMC runs was 0.002. Assuming a conservative burnin period of 501 trees, our results indicated that all parameters reached convergence between both runs. The Bayesian consensus tree obtained from 6720 post-burnin trees revealed four major clades of Pteroglossus, based on clade age and allopatric distribution of a clade's members (Figure 1): (1) viridis group – P. bailloni, P. viridis, P. inscriptus and P. humboldti; (2) torquatus group – P. torquatus, P. frantzii, P. sanguineus, and P. erythropygius; (3) aracari group – P. aracari, P. pluricinctus and P. castanotis; and (4) bitorquatus group – P. bitorquatus, P. beauharnaesii, P. flavirostris and P. mariae. Tree topology of the Pteroglossus clade was identical when Ramphastid taxa only were included in the analysis and Capito was used to root the tree and more distant outgroups were excluded from the analysis (Figure 1). Bayesian posterior probabilities were similar and very high for the majority of nodes, except that the support for the sister relationship between P. castanotis and P. plurinctus increased with the exclusion of non-Ramphastid outgroups. The phylogenetic relationships recovered in both Bayesian analyses performed by us were identical to those reported and discussed in an earlier study (Eberhard and Bermingham, 2005); hence, the phylogenetic and taxonomic implications will not be repeated here. However, we noted that our analyses recovered nodes with higher posterior probabilities across the tree compared to those in Eberhard and Bermingham (2005), including the association of the saffron toucanet Pteroglossusbailloni with the viridis group (1.0 versus 0.68). The higher posterior probability observed in our study may be the result of running the Markov chain for more cycles and assuming a more realistic model in which genes have a priori heterogeneous rates of DNA evolution (e.g., Pereira and Baker 2006). The phylogenetic hypothesis recovered here and by Eberhard and Bermingham (2005) differs from that of Kimura et al. (2004) because the latter had limited taxon and character sampling, yielding overall lower tree resolution and node support (Huelsenbeck et al., 1996; Pereira et al., 2002).
All of the 90 alternative topologies within the 95% credible set of trees sampled showed the saffron toucanet P. bailloni as a member of the Pteroglossusviridis group and not as a sister lineage to all other Pteroglossus. To further assess the placement of the saffron toucanet, we also applied a topological test to evaluate whether the differences seen between our consensus topology and a topology where the saffron toucanet is forced to be a separate sister lineage to all other Pteroglossus groups is statistically significant. The AU test failed to exclude both topologies from the 95% confidence set; it indicated, however, that the consensus topology obtained here is more likely to represent their phylogenetic relationships (p = 0.916) than the one forcing the saffron toucanet to be a sister genus to Pteroglossus (p = 0.084). In other words, in 91.6% of the replicates performed by the AU test, the saffron toucanet is embedded within Pteroglossus. Thus, the results reinforce the renaming of Baillonius bailloni as Pteroglossusbailloni, following molecular (Kimura et al., 2004), vocalization (Haffer, 1974; Short and Horne, 2001), and anatomical data (Hofling, 2004; Pires, 2008; Sick, 1997).
We approximated the posterior distribution of rates of evolution using a Bayesian approach that takes into account uncertainties in branch lengths and time constraints (Thorne and Kishino, 2002; Thorne et al., 1998). The posterior rates of evolution for ATPase 8/6, COI and cyt b were on average 0.23, 0.24 and 0.32% substitutions per site per lineage per million years (s/s/l/Myr), respectively. These rates are largely variable across time and taxa, especially for the ATPase 8/6 (Figure 2). These figures and the variation observed are in agreement with Bayesian estimates (Pereira and Baker, 2006) showing that all mitochondrial genes evolve at a slower pace than 1.0% s/s/l/Myr (or 2% sequence divergence per million year) assumed by the “standard” mitochondrial molecular clock hypothesis (Brown et al., 1979; Shields and Wilson, 1987; Wilson et al., 1985). Therefore, the use of the “standard” mitochondrial molecular clock (Eberhard and Bermingham, 2005) to estimate divergence times within Pteroglossus is inadequate.
The Bayesian posterior distribution of divergence times for Pteroglossus was obtained using three taxon sets differing in the composition of non-Ramphastidae taxa included. Also, we imposed time constraints based on the fossil record, geological events assumed to have been vicariant barriers leading to cladogenesis within Neotropical taxa, and molecular time estimates obtained from multiple genes and time constraints. The results of these analyses indicated that outgroup sampling has little influence on the Bayesian posterior distribution of divergence times among Pteroglossus when a variety of time constraints are used in combination (Table 1). For example, the mean posterior distribution of node ages derived from taxon set 1 that included a Piciformes plus three Passeriformes did not differ more than 0.5 Myr from the mean posterior distribution derived from taxon set 3 that had only Galloanserae as non-Ramphastidae outgroups. The size and distribution of the posterior 95% credible interval were very similar among the analyses of the three different taxon sets (Table 1).
To evaluate the contribution of the different types of time constraints used, we performed additional analyses of Bayesian molecular dating, using only one of each type of time constraints. The results are summarized in Table 1 and indicate that the geological or molecular time constraints used independently from each other converged to similar mean Bayesian posterior estimates of divergence times within Pteroglossus, regardless of the taxon set considered in the analysis. Although we do not advocate that molecular and geological time constraints will behave similarly for dating other groups and taxonomic levels, similar results have been reported previously for other Neotropical birds (Pereira and Baker, 2004). The results of the molecular dating within Pteroglossus also suggest that secondary molecular time estimates can be useful as calibration points or time constraints if they were originally obtained based on other reliable time constraints (contra Graur and Martin, 2004). We have reasons to believe that the secondary molecular time constraints used to estimate divergence times among Pteroglossus are reliable. The split between Galloanserae and the remaining birds set at 122 Mya was obtained from a mitogenomic Bayesian approach that used five avian and seven non-avian fossils spread throughout the tree (Pereira and Baker, 2006). The same estimate was obtained when only four fossils included in the 95% credible interval were used (Pereira and Baker, 2006), or when only the eight fossils that fall outside the 95% credible interval were used (SLP, unpublished). Additionally, the molecular time constraints imposed among curassows were independently derived from geological and secondary molecular constraints (Pereira and Baker, 2004).
Conversely, the Bayesian posterior distribution of divergence times derived from the use of fossil constraints alone resulted in much older dates for all nodes within Pteroglossus, especially when Galloanserae was included in the analysis (Table 1). This finding is not surprising because the fossils used as minimum age constraints represent much deeper divergences (i.e., split between Ramphastidae and Picidae and between Anseriformes and Galliformes) than those expected for Pteroglossus.
Taken together, the above results indicate that the combination of different types of time constraints reduces the effects of overestimating divergence times caused by the use of much deeper fossil constraints. Hereafter, we will consider the estimates from the molecular set of time constraints and most inclusive taxon sampling as the best estimates for the divergence times among Pteroglossus (Figure 3).
A biogeographic hypothesis for the evolution of Pteroglossus
Our Bayesian posterior estimates of divergence times (Table 1) are about three times older than those of Eberhard and Bermingham (2005) and place the beginning of the radiation within Pteroglossus into the Late Miocene instead of the Late Pliocene (Figure 3). Also, the Bayesian posterior estimates of divergence times rule out a major influence of the Pleistocenic glaciation – interglaciation cycles in the speciation of this group, as previously suggested (Eberhard and Bermingham, 2005; Haffer, 1974).
The 95% credible intervals (CI) of the Bayesian posterior estimates of divergence times (Table 1; Figure 3) and the allopatric distribution of species within the same subclades can be combined to suggest a biogeographic hypothesis for the radiation of Pteroglossus, based on major geological and physiographic paleoevents that occurred since the Miocene. For example, the initial cladogenic events among Pteroglossus that took place around 11 and 8 Mya (based on the 95% CI) coincide with extensive marine transgression into low-lying areas of South America, in the present-day La Plata, Paraná, Orinoco and Amazon River basins (Lundberg et al., 1998). Also, a major upheaval of the Cordillera of the Andes occurred about 12.9 and 11.5 Mya, as suggested by sedimentological and paleomagnetical data (Hoorn, 1994), reaching about half of its modern-day elevations (Gregory-Wodzicki, 2000) and creating a continuous mountain range in the northern region of South America (Hoorn, 1994). The northern uplift influenced the flow patterns of paleobasins and created paleolakes before the current drainage system was established (Hoorn, 1994; Lundberg et al., 1998). These paleoevents likely fragmented the Neotropical forest, isolating the ancestors of the viridis group in the highlands of the Brazilian and Guiana Shields, and the ancestors of the torquatus and aracari/bitorquatus groups on opposite sides of the Andes. Although P. bailloni is isolated nowadays from other members of the viridis group by the Brazilian savanna biome, palynological data do not indicate the presence of savanna-like vegetation prior to the Late Miocene (Hoorn, 1994). Therefore, this species is likely to represent an ancient stock that became isolated in the current Atlantic Forest due to an extensive marine transgression in the La Plata and Paraná River basins in the Mid to Late Miocene and failed to adapt and invade the Brazilian savanna that developed between the Amazon and the Atlantic Forests during the Miocene (Lundberg et al., 1998; Pennington et al., 2004).
The viridis, aracari and bitorquatus groups are sympatric with each other in most of their Amazonian distribution, but species within groups tend to exhibit allopatric distributions. Pteroglossus viridis and P. aracari are found in the Guiana Shields, on the north bank of the Amazon River, while their respective sister groups are found on the south bank of the Amazon River (P. inscriptus and P. humboldti) and in western Amazonia (P. castanotis and P. pluricinctus). The estimated divergence time for this species group between 5 and 2 Mya falls within a period of time after which the Amazon River basin had very much established its present-day easterly flow towards the Atlantic Ocean (Lundberg et al., 1998), major orogenic transformation brings the Andes to present-day elevations (Gregory-Wodzicki, 2000; Hooghiemstra and Van der Hammen, 1998), and a Pliocene sea rise of about 100 meters higher than present-day level causes a marine transgression around 5 Mya that lasts about 800,000 years (Haq et al., 1987). These same paleoevents are likely to have influenced the split between P. beauharnaesii/P. bitorquatus and P. flavirostris/P. mariae. However, P. beauharnaesii is the only species to exhibit sympatric distribution with the three other species of its group. This suggests that ecological and/or other biological factors likely played a major role in the speciation of the bitorquatus group.
The torquatus group has an exclusively trans-Andean distribution. Their present distributional range includes areas of endemism in the Pacific lowlands and Isthmus of Panama that coincide with areas of endemism presumed to have been isolated during the marine transgressions of the Pliocene and Pleistocene (Nores, 2004). For example, the split of P. torquatus, followed by P. frantzii, from the ancestors of P. erythopygius/P. sanguineus between 4.3 and 1.0 Mya is bracketed by the closing of the Isthmus of Panama (Lundberg et al., 1998) and the 5-Mya Pliocene sea level rise (Klammer, 1984). The split between P. erythopygius and P. sanguineus between 0.1 and 1.7 Mya is our only estimate that coincides with Pleistocene glacial-interglacial periods. However, the specific status of these two taxa has yet to be genetically determined by sampling specimens throughout their range of distribution, as some authors consider them to be subspecies of P. torquatus (Short and Horne, 2001).
The above geological events we put forward as major vicariant forces driving the speciation among Pteroglossus aracaris are likely to have influenced the evolution of the Neotropical biota with comparable geographic distribution in tropical America (Bush, 1994; Nores, 1999, 2004; Wesselingh and Salo, 2006). Similar patterns of temporal divergence have been independently suggested from molecular data for a growing number of congeneric species, including curassows and piping-guans (Grau et al., 2005; Pereira and Baker, 2004), parrots (Ribas et al., 2007), trogons (Moyle, 2005), monkeys (Collins and Dubach, 2001; Cortes-Ortiz et al., 2003), vesper mice and spiny rats (Galewski et al., 2005; Salazar-Bravo et al., 2001), bats (Lim, 2007; Stadelmann et al., 2007), catfishes (Montoya-Burgos, 2003), and geckos (Gamble et al., 2008). Instead of applying the “standard” molecular clock, the present study and those cited above independently relied on fossil, geological or a reasonable molecular time constraints to estimate the age of diversification within those groups of vertebrates. By comparing the spatial and temporal patterns of radiation of multiple Neotropical groups under an integrated approach among phylogenetics, geology and paleoecology (Bush, 1994), we start to unfold the intricate biological and physical aspects that shaped the biodiversity of the Neotropics as we currently understand it.
Acknowledgments
Financial support was provided by the following Brazilian agencies: Fundação de Amparo à Pesquisa do Estado de São Paulo (FAPESP), Conselho Nacional de Desenvolvimento Científico e Tecnológico (CNPq) and Coordenação de Aperfeiçoamento de Pessoal de Nível Superior (CAPES). Valuable suggestions by one of the anonymous reviewers were incorporated.
References
Brown W.M., George Jr M., Wilson A.C. (1979) Rapid evolution of animal mitochondrial DNA. Proc Natl Acad Sci USA 76:1967-1971.
Bush M.B. (1994) Amazonian speciation: A necessarily complex model. J Biogeogr 21:5-17.
Clarke J.A., Tambussi C.P., Noriega J.I., Erickson G.M., Ketcham R.A. (2005) Definitive fossil evidence for the extant avian radiation in the Cretaceous. Nature 433:305-308.
Collins A.C., Dubach J.M. (2001) Nuclear DNA variation in spider monkeys (Ateles). Mol Phylogenet Evol 19:67-75.
Cortes-Ortiz L., Bermingham E., Rico C., Rodriguez-Luna E., Sampaio I., Ruiz-Garcia M. (2003) Molecular systematics and biogeography of the Neotropical monkey genus, Alouatta. Mol Phylogenet Evol 26:64-81.
Eberhard J.R., Bermingham E. (2005) Phylogeny and comparative biogeography of Pionopsitta parrots and Pteroglossus toucans. Mol Phylogenet Evol 36:288-304.
Ericson P.G., Anderson C.L., Britton T., Elzanowski A., Johansson U.S., Kallersjo M., Ohlson J.I., Parsons T.J., Zuccon D., Mayr G. (2006) Diversification of Neoaves: Integration of molecular sequence data and fossils. Biol Lett 2:543-547.
Galewski T., Mauffrey J.F., Leite Y.L., Patton J.L., Douzery E.J. (2005) Ecomorphological diversification among South American spiny rats (Rodentia, Echimyidae): A phylogenetic and chronological approach. Mol Phylogenet Evol 34:601-615.
Gamble T., Simons A.M., Guarino R.C., Vitt L.J. (2008) Tertiary climate change and the diversification of the Amazonian gecko genus Gonatodes (Sphaerodactylidae, Squamata). Mol Phylogenet Evol 46:269-277.
Gibb G.C., Kardailsky O., Kimball R.T., Braun E.L., Penny D. (2007) Mitochondrial genomes and avian phylogeny: Complex characters and resolvability without explosive radiations. Mol Biol Evol 24:269-280.
Pereira S.L., Silveira L.F., Hofling E., Wajntal A. (2005) Molecular phylogenetics and biogeography of Neotropical piping guans (Aves, Galliformes): Pipile Bonaparte, 1856 is synonym of Aburria Reichenbach, 1853. Mol Phylogenet Evol 35:637-645.
Haffer J. (1974) Avian speciation in tropical South AmericaMassachusettsCambridge390
Haffer J. (1997) Alternative models of vertebrate speciation in Amazonia: An overview. Biodiversity and Conservation, 6:451-476.
Haq B.U., Hardenbol J., Vail P.R. (1987) Chronology of fluctuating sea levels since the Triassic. Science 235:1156-1167.
Hofling E. (2004) Recent anatomical studies on neotropical birds. Ornitol Neotrop 15:73-81.
Hooghiemstra H., Van der Hammen T. (1998) Neogene and Quaternary development of the Neotropical rain forest: The refugia hypothesis, and a literature overview. Earth-Sci Rev 44:147-183.
Hoorn C. (1994) An environmental reconstruction of the palaeo-Amazon River system (Middle-Late Miocene, NW Amazonia). Palaeogeogr Palaeoclimat Palaeoecol 112:187-238.
Huelsenbeck J.P., Bull J.J., Cunningham C.W. (1996) Combining data in phylogenetic analysis. Trends Ecol Evol 11:152-158.
Kimura R.K., Pereira S.L., Grau E.T., Höfling E., Wajntal A. (2004) Genetic distances and phylogenetic analysis suggest that Baillonius Cassin, 1867 is a Pteroglossus Illiger, 1811 (Piciformes, Ramphastidae). Ornitol Neotrop 15:527-537.
Klammer G. (1984) The relief of extra-Andean Amazon basin. The Amazon: Limnology and Landscape Ecology of a Mighty Tropical River and Its BasinSioli H.DordrechtDr. W. Junk47-83.
Lim B.K. (2007) Divergence times and origin of neotropical sheath-tailed bats (Tribe Diclidurini) in South America. Mol Phylogenet Evol 45:777-791.
Livezey B.C., Zusi R.L. (2007) Higher-order phylogeny of modern birds (Theropoda, Aves, Neornithes) based on comparative anatomy. II. Analysis and discussion. Zool J Linn Soc 179:1-95.
Lundberg J.G., Marshall L.G., Guerrero J., Horton B., Malabarba M.C.S.L., Wesselingh F. (1998) The stage for Neotropical fish diversification: A history of tropical South American rivers. Phylogeny and Classification of Neotropical FishesMalabarba L.R., Reis R.E., Vari R.P., Lucena Z.M.S., Lucena C.A.S.Porto AlegreEditora Universitaria PUCRS13-48.
Mayr G. (2005) A tiny-barbet like bird from the lower Oligocene of Germany: The smallest species and earliest substantial fossil record of the Pici (woodpeckers and allies). The Auk 122:1055-1063.
Montoya-Burgos J.I. (2003) Historical biogeography of the catfish genus Hypostomus (Siluriformes, Loricariidae), with implications on the diversification of Neotropical ichthyofauna. Mol Ecol 12:1855-1867.
Moyle R.G. (2005) Phylogeny and biogeographical history of Trogoniformes, a pantropical bird order. Biol J Linn Soc 84:725-738.
Nahum L.A., Pereira S.L., Fernandes F.M.D., Matioli S.R., Wajntal A. (2003) Diversification of Ramphastinae (Aves, Ramphastidae) prior to the Cretaceous/Tertiary boundary as shown by molecular clock of mtDNA sequences. Genet Mol Biol 26:411-418.
Nores M. (1999) An alternative hypothesis for the origin of Amazonian bird diversity. J Biogeogr 26:475-485.
Nores M. (2004) The implications of Tertiary and Quaternary sea level rise events for avian distribution patterns in the lowlands of northern South America. Global Ecol Biogeogr 13:149-161.
Nylander J.A. (2004) MrModeltest 2.0. Program distributed by the authorUppsala UniversityEvolutionary Biology Centre
Pennington R.T., Lavin M., Prado D.E., Pendry C.A., Pell S.K., Butterworth C.A. (2004) Historical climate change and speciation: Neotropical seasonally dry forest plants show patterns of both tertiary and quaternary diversification. Phil Trans R Soc Lond B Biol Sci 359:515-537.
Pereira S.L., Baker A.J. (2004) Vicariant speciation of curassows (Aves, Cracidae): A hypothesis based on mitochondrial DNA phylogeny. The Auk 121:682-694.
Pereira S.L., Baker A.J. (2006) A mitogenomics timescale for birds detects variable phylogenetic rates of molecular evolution and refutes the standard molecular clock. Mol Biol Evol 23:1731-1740.
Pereira S.L., Baker A.J., Wajntal A. (2002) Combined nuclear and mitochondrial DNA sequences resolve generic relationships within the Cracidae (Galliformes, Aves). Syst Biol 51:946-958.
Ribas C.C., Moyle R.G., Miyaki C.Y., Cracraft J. (2007) The assembly of montane biotas: Linking Andean tectonics and climatic oscillations to independent regimes of diversification in Pionus parrots. Proc Biol Sci 274:2399-2408.
Ronquist F., Huelsenbeck J.P. (2003) MrBayes 3: Bayesian phylogenetic inference under mixed models. Bioinformatics 19:1572-1574.
Salazar-Bravo J., Dragoo J.W., Tinnin D.S., Yates T.L. (2001) Phylogeny and evolution of the neotropical rodent genus Calomys: Inferences from mitochondrial DNA sequence data. Mol Phylogenet Evol 20:173-184.
Shields G.F., Wilson A.C. (1987) Calibration of mitochondrial DNA evolution in geese. J Mol Evol 24:212-217.
Shimodaira H. (2002) An approximately unbiased test of phylogenetic tree selection. Syst Biol 51:492-508.
Shimodaira H., Hasegawa M. (2001) CONSEL: For assessing the confidence of phylogenetic tree selection. Bioinformatics 17:1246-1247.
Short L.L., Horne J.F.M. (2001) Toucans, Barbets and HoneyguidesCapitonidae and Indicatoridae. Oxford University Press, New YorkRamphastidae554
Sick H. (1997) Ornitologia BrasileiraRio de JaneiroNova Fronteira823
Stadelmann B., Lin L.-.K., Kunz T.H., Ruedi M. (2007) Molecular phylogeny of New World Myotis (Chiroptera, Vespertilionidae) inferred from mitochondrial and nuclear genes. Mol Phylogenet Evol 43:32-48.
Thorne J.L., Kishino H. (2002) Divergence time and evolutionary rate estimation with multilocus data. Syst Biol 51:689-702.
Thorne J.L., Kishino H., Painter I.S. (1998) Estimating the rate of evolution of the rate of molecular evolution. Mol Biol Evol 15:1647-1657.
Wesselingh F.P., Salo J.A. (2006) A Miocene perspective on the evolution of the Amazon basin. Scripta Geologica 133:439-458.
Wiegmann B.M., Yeates D.K., Thorne J.L., Kishino H. (2003) Time flies, a new molecular time-scale for brachyceran fly evolution without a clock. Syst Biol 52:745-756.
Wilson A.C., Cann R.L., Carr S., George M., Gyllensten U., Helm-Bychowski K., Higuchi R., Palumbi S.R., Prager E., Sage R.D. (1985) Mitochondrial DNA and two perspectives on evolutionary genetics. Biol J Linn Soc 26:375-400.
Yang Z. (1997) PAML: A program package for phylogenetic analysis by maximum likelihood. Comput Appl Biosci 13:555-556.
Yang Z., Yoder A.D. (2003) Comparison of likelihood and Bayesian methods for estimating divergence times using multiple gene loci and calibration points, with application to a radiation of cute-looking mouse lemur species. Syst Biol 52:705-716.
Internet Resources
Pires T.C.Filogenia de Ramphastidae (Aves, Piciformes), com base em caracteres morfologicos siringeais. Master's Thesis, Dept. Zoology, University of Sao Paulo (2008) Available from: http://www.teses.usp.br/teses/disponiveis/41/41133/tde-16062008-143347/
- Bayesian posterior estimates of divergence times among Pteroglossus. Mean, standard deviation (SD) and 95% credible intervals (95% CrI, in brackets) are given in million years for each taxon set analyzed and correspond to estimates using all geological, fossil and molecular time constraints (unless specified) applicable for that taxon set. Node labels as in Figure 3.
Received: November 30, 2007; Accepted: June 3, 2008
Sergio L. Pereira. Department of Natural History, Royal Ontario Museum, 100 Queen's Park, M5S 2C6 Toronto, ON, Canada. E-mail: sergio.pereira@utoronto.ca.
Publication Dates
-
Publication in this collection
19 Nov 2008 -
Date of issue
2008
History
-
Received
3011 -
Accepted
3062