Abstract
To understand the phylogenetic position of Larimichthys polyactis within the family Sciaenidae and the phylogeny of this family, the organization of the mitochondrial genome of small yellow croaker was determined herein. The complete, 16,470 bp long, mitochondrial genome contains 37 mitochondrial genes (13 protein-coding, 2 ribosomal RNA and 22 transfer RNA genes), as well as a control region (CR), as in other bony fishes. Comparative analysis of initiation/termination codon usage in mitochondrial protein-coding genes of Percoidei species, indicated that COI in Sciaenidae entails an ATG/AGA codon usage different from other Percoidei fishes, where absence of a typical conserved domain or motif in the control regions is common. Partitioned Bayesian analysis of 618 bp of COI sequences data were used to infer the phylogenetic relationships within the family Sciaenidae. An improvement in harmonic mean -lnL was observed when specific models and parameter estimates were assumed for partitions of the total data. The phylogenetic analyses did not support the monophyly of Otolithes, Argyrosomus, and Argyrosominae. L. polyactis was found to be most closely related to Collichthys niveatus, whereby, according to molecular systematics studies, the relationships within the subfamily Pseudosciaenidae should be reconsidered.
Larimichthys polyactis; mitochondrial genome; control region; partitioned Bayesian analysis; Sciaenidae
The complete mitochondrial genome of the small yellow croaker and partitioned Bayesian analysis of Sciaenidae fish phylogeny
Yuanzhi Cheng; Rixin Wang; Yuena Sun; Tianjun Xu
Laboratory for Marine Living Resources and Molecular Engineering, College of Marine Science, Zhejiang Ocean University, Zhoushan, Zhejiang, P.R. China
Send correspondence to Send correspondence to: Tianjun Xu College of Marine Science, Zhejiang Ocean University Wenhua Road 105 316000 Zhoushan, Zhejiang, P.R China E-mail: tianjunxu@163.com
ABSTRACT
To understand the phylogenetic position of Larimichthys polyactis within the family Sciaenidae and the phylogeny of this family, the organization of the mitochondrial genome of small yellow croaker was determined herein. The complete, 16,470 bp long, mitochondrial genome contains 37 mitochondrial genes (13 protein-coding, 2 ribosomal RNA and 22 transfer RNA genes), as well as a control region (CR), as in other bony fishes. Comparative analysis of initiation/termination codon usage in mitochondrial protein-coding genes of Percoidei species, indicated that COI in Sciaenidae entails an ATG/AGA codon usage different from other Percoidei fishes, where absence of a typical conserved domain or motif in the control regions is common. Partitioned Bayesian analysis of 618 bp of COI sequences data were used to infer the phylogenetic relationships within the family Sciaenidae. An improvement in harmonic mean -lnL was observed when specific models and parameter estimates were assumed for partitions of the total data. The phylogenetic analyses did not support the monophyly of Otolithes, Argyrosomus, and Argyrosominae. L. polyactis was found to be most closely related to Collichthys niveatus, whereby, according to molecular systematics studies, the relationships within the subfamily Pseudosciaenidae should be reconsidered.
Key words:Larimichthys polyactis, mitochondrial genome, control region, partitioned Bayesian analysis, Sciaenidae.
Introduction
Animal mitochondrial DNA, a 16-19 kb long circular molecule, comprises 37 genes encoding 22 transfer RNAs (tRNAs), 13 proteins, 2 ribosomal RNAs, and a putative control region (CR) (Brown, 1985; Boore, 1999). Due to its compactness, maternal inheritance, fast evolutionary rate compared to nuclear DNA, and the resulting short coalescence time, mitochondrial DNA sequence data have been widely used in phylogeny (Miya et al., 2003), taxonomic resolution (Poulin et al., 2004), and population genetic studies (Habib et al., 2010).
The small yellow croaker, Larimichthys polyactis,a very popular fish among consumers, is one of the most important commercial benthopelagic fishes in China and Korea. The species is extensively distributed in the Bohai, Yellow and East China Seas, global landing having reached 320 thousand metric tons in 2000 (Seikai National Fisheries Research Institute, 2001). Nevertheless, intense fishing has deflated catches in the Yellow and East China Seas, to such an extent that resources are now considered overexploited (Lin et al., 2008). In the past, the focus has been on catch statistics, size composition, early life history and feeding habits (Xue et al., 2004; Yan et al., 2006; Wan and Sun, 2006). However, over recent years, the genetic characteristics of the small yellow croaker have also come under investigation by means of molecular markers (Meng et al., 2003; Lin et al., 2009; Xiao et al., 2009), although, information is still limited, and the complete mitochondrial genome sequence, critical in studies of genome evolution and species phylogeny, continues unavailable. Thus, much additional work is required to furnish important genetic and evolutionary data, essential for species conservation, management and phylogenetic analysis.
Sciaenidae is a diverse and commercially important family, comprising 68 genera and about 311 species (Nelson, 2006). Despite specific studies of morphological and molecular phylogeny, instabilities of the phylogenetic relationships within the group have not, as yet, been resolved, the methods employed in previous research on phylogenetic reconstruction based on molecular data having been, to some extent, empirical and simple. The non-implementation of advanced methods, such as ML or BI, best-fit evolutionary models for specific data, and the statistical testing of the different topologies derived from the same data matrix, has probably contributed to mismodeling and systematic error in analysis. Mismodeling itself commonly occurs when a single model, inappropriate for multiple-gene regions involving several models of evolution, as stem and loop in RNA, or codon positions in protein genes, is employed for those multiple data partitions best explained by separate models of DNA evolution. Another form of mismodeling is the case,when multiple data partitions, defined by the same general model, differ drastically in the specific model parameter estimates that maximize the likelihood score (Reeder, 2003; Brandley et al., 2005). An overall solution would be to apply appreciate models and their specified parameter estimates to each data partition, and subsequently incorporate this into a single ML tree-search (Yang, 1996). Methods for reconstructing phylogeny, based on partitioned data using Bayesian/Markov chain Monte Carlo (MCMC) methods, are now available (Huelsenbeck and Ronquist, 2001; Nylander et al., 2004). Since it more accurately models the data, the use of partitionspecific modeling -in other words, partitioned Bayesian analysis -should reduce systematic error, thereby resulting in better likelihood scores and more accurate posterior probability estimates (Brandley et al., 2005).
In the present study, pre-defined complete mitochondrial genome sequences of the small yellow croaker were compared with those reported for Percoidei species, whereupon partitioned Bayesian analysis was applied to infer the phylogeny of Sciaenidae fishes.
Materials and Methods
Fish sample and DNA extraction
L. polyactis individuals were collected by trawling in the Zhoushan fishing grounds, East China Sea (Zhejiang Province, China). They were identified by morphology. Muscle tissue was removed and immediately preserved at -80 ºC. Total DNA was extracted as per standard phenol-chloroform method (Sambrook and Russell, 2001) and visualized on 1.0% agrarose gels.
PCR amplification and sequencing
As shown in Table S1, 11 sets of primers that amplify contiguous, overlapping segments of the complete mitochondrial genome of L. polyactis, were used. The primers were designed from reported complete mitochondrial genome sequences for the large yellow croaker (Cui et al., 2009). Worthy of note, these primers are also very useful for amplifying the mitochondrial genomes of two other Sciaenidae species, Miichthys miiuy and Collichthys lucidus. Of the 11 pairs of primers, six (1F/R, 4F/R, 6F/R, 7F/R, 8F/R, and 10F/R) are capable of perfectly amplifying the mitochondrial genomes of both species. The total length of amplified products is approximately 12,300 bp. PCR assays were carried out in a final volume of 50 /L, each containing 5.0 /Lofa10xTaq Plus polymerase buffer, 0.2 mM of dNTP, 0.2 /M of the forward and reverse primers, 2 units of Taq Plus DNA polymerase with proof-reading characteristic (TIANGEN, Beijing, China), and 1 /Lof DNA template. Cycling conditions were 94 ºC for 4 min, followed by 35 cycles of 94 ºC for 50 s, 60 ºC for 60 s and 72 ºC for 2-3 min, followed by 1 cycle of 72 ºC for 10 min, PCR was performed on a PTC-200 thermocycler (MJ Research, USA). The resultant PCR products, first electrophoresed on a 1% agarose gel to check integrity, were then visualized by the Molecular Imager Gel Doc XR system (BioRad), followed by purification using a QIAEX II Gel Extraction Kit (Qiagen). The purified fragments were ligated into PMD18-T vectors (Takara, Japan) used to transform to TOP10 E. coli cells, according to standard protocol. Positive clones were screened via PCR with M13+/-primers. Amplicons were sequenced using an ABI 3730 automated sequencer (Applied Biosystems) with M13+/primers.
Sequence analysis
The sequence fragments so obtained were edited in the Seqmen program (DNAstar, Madison, WI, USA) for contig assembly to obtain a complete mitochondrial genome sequence. Annotation of protein-coding and ribosomal RNA genes, and definition of their respective gene boundaries were carried out with DOGMA software (Wyman et al., 2004) through reference sequences of Percoidei, available in GenBank. tRNA genes and their secondary structures, were identified by means of tRNAscan-SE 1.21 software (Lowe and Eddy, 1997). Base composition, genetic distances, and codon usage were calculated in MEGA 4.0 software (Tamura et al., 2007). Putative OL and CR, and conserved motifs were identified via sequence homology and proposed secondary structure. The complete mitochondrial genome sequence, deposited in the GenBank database, can be accessed through Accession Number GU586227.
Phylogenetic analysis
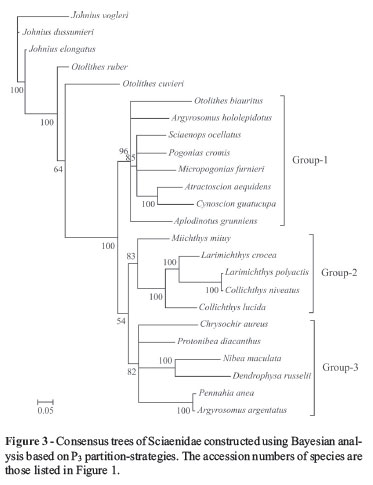
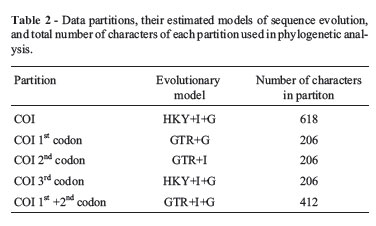
Multiple alignments of the COI sequences from 30 Sciaenidae species were performed using the MEGA 4.1 version. The data matrix of COI sequences was partitioned by codon position (Table 1). The appropriate model of sequence evolution for each partition (Table 2) was determined using the jModeltest program (Guindon and Gascuel, 2003; Posada, 2008), under the Akaike Information Criterion (AIC). Bayesian analysis for each data partitioning strategy consisted of two separate runs with four Markov chains in the MrBayes3.1 program (Huelsenbeck and Ronquist, 2001). Each run, comprising 10 million generations, was systematically sampled at every 100. The first 25% of the trees were discarded as part of a burn-in procedure, and the remainder employed in constructing a 50% majority rule consensus tree. The results for each partitioning strategy were then compared using the Bayes factor as an aid in accepting the best phylogeny hypothesis for the sequence data matrix.
Results and Discussion
Gene content, arrangement and base composition
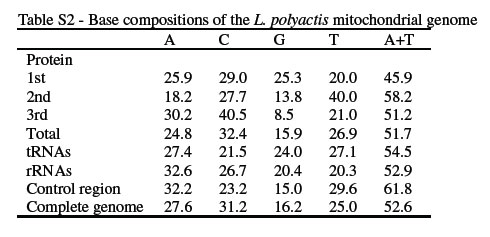
The complete mitochondrial genome of L. polyactis was 16, 470 bp long (Table 3), which is similar to those of not only teleost species but also terrestrial vertebrates. Its gene content conforms to the vertebrate consensus, by containing the highly conserved set of 37 genes encoding 2 ribosomal RNAs (rRNAs), 22 transfer RNAs (tRNAs) and 13 proteins, that are essential in mitochondrion respiration and adenosine triphosphate (ATP) production. Although, as in other vertebrates, most of the genes are encoded on the H-strand, besides ND6 and eight tRNAs (Glu, Ala, Asn, Cys, Tyr, Ser-UCN, Gln, and Pro) being also encoded on the L-strand, the genes are all similar in length to those of bony fishes (Oh et al., 2007, 2008). As reported in other vertebrates, there are four notable 'overlaps' between genes, as reported in other vertebrates, with the lengths of these overlaps are generally being fixed. Whereas ATPase 8 and ATPase 6 overlap by 10 bp, overlapping was also observed between ND4L and ND4 (seven bp), ND5 and ND6 (four bp), and ATPase 6 and COIII (one bp). The remainders are located between tRNA genes themselves, and between tRNA and protein-coding genes. The sizes of non-coding spacers range from 1 to 37 bp (Table 3). The largest of these, located between tRNA-Asn and tRNA-Cys, was recognized as the putative replicate origin of the L-strand|s. These non-coding spacers are interesting in the study of mtDNA evolutionary mechanisms. The base composition of L. polyactis was analyzed separately for rRNA, tRNA, and protein-coding genes (Table S2). In the latter, pronounced anti-G bias was observed at the third codon positions (8.5%), which are free from selective constraints on nucleotide substitution. Besides the A+T composition of the second codon position being relatively higher than in most Percoidei fishes, pyrimidines were over-represented in this position (61.5%). Already observed in other vertebrate mitochondrial genomes, this has been attributed to the hydrophobic character of the proteins (Naylor et al., 1995). L. polyactis tRNA genes are A+T rich (54.5%), as in other vertebrates, whereas rRNAs are A+C rich (59.3%), as in other bony fishes (Zardoya and Meyer, 1997; Cheng et al., 2010).
Protein-coding genes
As expected, 13 large open-reading frames were detected in the mitochondrial genome of L. polyactis. The T:C:A:G base composition of the mitochondrial 13 protein-coding-gene sequence, 26.9: 32.4: 24.8: 15.9, is summarized in Table S2. Bias of nucleotide frequencies is strand specific (Broughton and Reneau, 2006). Moreover, in contrast to H-stranded genes, in L-stranded ND6 genes, the most prominent anti-C bias is at the third position (7.5%). The lengths of 13 protein-coding genes of L. polyactis mitochondrial DNA were compared with the corresponding sequences of other Percoidei species, whereat it was found that these are conserved. Moreover, there is almost no variation among species. By comparing predicted initiation and termination codons of the 13 protein-coding genes among 23 percoidei species (Table S3), it was apparent that most use ATG as the initiation codon (92.6%), with GTG in second place. In a few species, initiation codons are even absent (shown by "?"). The situation in termination codons is also similar. TAA, TAG and incomplete TA-or T--are commonly used, but AGA and AGG rarely so. This condition is apparently common among vertebrate mitochondrial genome, and it also appears that TAA stop codons are created via posttranscriptional polyadenylation (Ojala et al., 1981). Furthermore, each protein has its preferable initiation and termination codons, although there are exceptions. For example, in most species, COII, COIII, Cytb, ND4L and ND4 choose ATG/T--, ATG/TA-, ATG/T--, ATG/TAA and ATG/T--, respectively. But in COI there are two types of initiation/termination codon usage. COI proteins in Sciaenidae fish mitochondrial DNA bear ATG/AGA as initiation and termination codons, whereas in other Percoidei fishes, this is not the case (they possess GTG/TAA, GTG/AGG or GTG/T--). Studies in insects have shown positive correlations between the incidence of canonical initiation and termination codons and the relative rate of gene evolution (Szafranski, 2009). Whether this relationship also applies to fishes requires confirmation.
Codons in the 13 protein-coding genes identified in L. polyactis are shown in Table S4. As regards amino acids with the fourfold degenerate third position, codons ending in C are mostly seen, followed by codons ending in A and T for alanie, proline, glycine, valine and threonine. However, for arginine and serine, A is more frequent than C. Among codons with twofold degenerate positions, C appears to be more used than T in the pyrimidine codon family, whereas the purine codon family ends mostly with A. Except for arginine, G is the least common third position nucleotide in all the codon families. All these features are very similar to those observed in vertebrates (Hu et al., 2010; Yang et al., 2010).
Ribosomal RNA gene and transfer RNA gene
As with other mitochondrial genomes, the genome contains a small (12S) and large (16S) subunits of rRNA, which are 950 bp and 1697 bp long, respectively (Table S2). As in the other vertebrates, they are located between tRNA-Phe and tRNA-Leu(UUR), and are separated by tRNA-Val (Figure S1, Table 3). When compared with other genes reported for Sciaenidae, and similar to other vertebrates, both rRNA genes are conserved either in A+T content or gene length and location. As with Gonostoma gracile (Miya and Nishida, 1999), preliminary assessment of the secondary structure of L. polyactis indicated that the present sequence could be reasonably superimposed on the proposed secondary structures of carp 12S and cow 16S rRNA (Gutell et al., 1993). Twenty-two tRNA genes, with lengths varying from 67 bp (tRNA-Cys and tRNA-Ser(AGY) to 75 bp(tRNA-Lys), were interspersed throughout the entire genome. As reported in some other vertebrates (Miya et al., 2003; Kim and Lee, 2004; Oh et al., 2007), with the known exception of the tRNA-Ser (AGY) gene, all tRNA gene transcripts can be folded into typical cloverleaf secondary structures (Figure S2). Besides harboring anticodons identical to those used in other vertebrate mitogenomes, they conserve the aminoacyl, DHU (dihydrouridine), anticodon and TtC (thymidine-pseudouridine-cytidine) stems. As shown in the rock bream (Oh et al., 2007) and Pseudolabrus fishes (Oh et al., 2008), the tRNA-Ser (AGY) found in the L. polyactis mitochondrial genome bore no complete DHU arm. Similar to usual tRNAs (Ohtsuki et al., 2002), aberrant tRNAs can also fit into the ribosome by adjusting their structural conformation and function.
Main non-coding regions of Percoidei species
The putative OL was confirmed in L. polyactis. When compared with other Percoidei fishes, they were almost identical and are located in a cluster of five tRNA genes (the WANCY region) between the tRNA-Asn and tRNA-Cys gene. The putative OL, besides serving as the initiation site of Light-strand replication, is capable of folding into a stable stem-loop secondary structure with 13 bp in the stem and 11 bp in the loop. Furthermore, there is a C-rich sequence in the loop, whereby RNA primer synthesis can be initiated. This C-rich sequence has also been found in the OL loop of other fishes, such as Gadus morhua (Johansen et al., 1990) and Oncorynchus mykiss (Zardoya et al., 1995). This feature supports the hypothesis that in vertebrates, primer synthesis is most probably initiated by a polypyrimidine tract (Taanman, 1999), and not by a stretch of thymines, as previously suggested (Wang and Clayton, 1985). The conserved sequence motif, 5'-GCCGG-3', was found at the base of the stem within tRNA-Cys. This motif seems to be involved in the transition from RNA to DNA synthesis (Hixson and Brown, 1986).
The mitochondrial control region is located between tRNA-Pro and tRNA-Phe in mitochondrial DNA. Besides being the most variable region, it also contains certain conserved motifs that are associated with the initiation of DNA replication and transcription (Zhao et al., 2006). The control region of L. polyactis was identified and compared with those of other Percoidei fishes. They are also located between the two tRNAs (Pro and Phe), and range in size from 533 bp (Parargyrops edita, EF107158) to 1354 bp (Pagrus major, AP002949), all having an overall base composition rich in A and T (A+T= 60%). The variation in length is largely due to the number of conserved domains inserted in these species. Long tandem repeats were recognized in Monodactylus argenteus and Pagellus bogaraveo, with lengths of 56 bp and 183 bp, respectively. Slippage and mispairing during mitogenome replication may explain tandem repeats in the control region (Brought and Dowling, 1997). Although this region is a unique and highly variable area in mitochondrial DNA, conserved domains and motifs are recognizable by multiple homologous sequence alignment and recognition site comparison. Control regions are also divided into a typical tripartite structure with an extent termination association sequence (ETAS), central conserved-block domains (CSB-F, CSB-D, and CSB-E), and conserved sequence block domains (CSB-1, CSB-2, and CSB-3) (Sbisa et al., 1997). The conserved ETAS motif in most fishes is TACAT, with one palindromic sequence, ATGTA. In Coreoperca kawamebari, there is some variation in ETAS having the conserved TGCAT motif. The consensus sequences of ETAS in Percoidei fishes was identified as TACAT-TATGTAT---CACCAT----ATATTAAC CAT, where "-" indicating nucleotide variations such as transitions, transversions, or deletions, similar to reported in sinipercine fishes (Zhao et al., 2006). CSB domains that are associated with the initiation of mitochondrial DNA replication, and other important functions of control regions, were detected. Consensus sequences have been summarized in Table S5. While all these conserved blocks can be easily identified in most of the Percodei species, the incomplete structure of control regions with the absence of conserved domains, was also detected (Table 4). Such obvious insertions and deletions implied the rapid evolution of the control region in Percoidei fishes, a possible source of information for dissecting the structure-function-evolution relationships of control regions.
Effect of partitioning on harmonic mean -lnL, topology, posterior probabilities and bayes factors
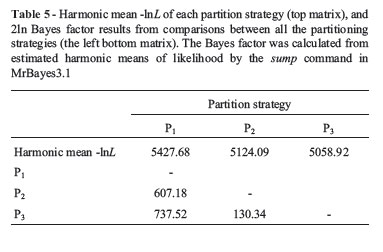
Harmonic mean -lnL was used when measuring the aptitude of data partitioning in defining the entire data set. Partitioning the COI data set by codon position greatly improved harmonic mean -lnL (Table 5). The same results were reported (Brandley et al., 2005; Brown and Lemmon, 2007), when partitioning by codon position and RNA gene specific stems and loops. The inference is that, as the different data partitions may evolve quite variably, partitioning can be considered as a useful method for accommodating heterogeneity in the processes of molecular evolution. Consensus tree topologies inferred from the three analyses differed, yet all of these difference involved alternative placements of weakly supported nodes (Bayesian posterior probabilities < 95%). These distinct differences were dependent on whether the COI sequences were partitioned. The most dramatic differences could be noted, not only in the deep nodes in the tree, but also in the relationships among the three main groups (Groups1, 2 and 3 in Figures 1-3). No obvious differences were observed in posterior probabilities among analyses depending on different partition-strategies All Bayes-factor estimates were much higher than the criterion for strong evidence against a hypothesis. According to the Bayes factors, analysis employing the P3 partition-strategy provided a decisively better explanation of the data than the remainder (Table 5 and Table 6). Thus, as this is the preferred hypothesis of the phylogeny of Sciaenidae fishes based on the present data, subsequent discussion will be limited to this tree (Figure 3).

The phylogeny of the Sciaenidae family
Based on the characters of the gas bladder, sagitta, and mental pores, Zhu et al. (1963) divided the family into seven subfamilies, viz., Johniinae, Megalonibinae, Bahabinae, Sciaeninae, Otolithinae, Argyrosominae and Pseudosciaeniae. In this study, phylogenetic analysis revealed three distinct monophyletic groups (Groups1, 2 and 3), thus very different from the results of Zhu et al. (1963). Monophyly of the genera Otolithes and Argyrosomus is not supported. The proposition (Zhu et al., 1963) of grouping Argyrosomus and Nibea into the subfamily Argyrosominae is also without support, for, based on the phylogenetic tree presented herein, Argyrosomus and Nibea have been placed into two distinct groups (Figure 3). Even though monophyly of Pseudosciaeniae is supported, herein, Bayesian posterior probability is relatively weak. Notably, within the subfamily Pseudosciaeninae, L. polyactis was found to be most closely related to Collichthys niveatus, and then to its congeneric species, L. crocea. Although previous molecular phylogenetic analyses had the same opinion on the phylogenetic positions of Otolithes, Argyrosomus, and Argyrosominae, the phylogentic relationships within the subfamily Pseudosciaeninae are still far from clear (Meng et al., 2004; Xu et al., 2010). Based on different data and methods, once again our results suggested that Collichthys and Larimichthys may be merged into a single genus. These results are consistent with Chen (Chen QM, 2007, Dissertation, Jinan University, China) and Tong et al. (2007), where, respectively, non-monophyletic Larimichthys and Collichthys were recovered. Nevertheless, Cheng et al. (2011) recently recovered monophyletic Collichthys and Larimichthys, thus, in common with the morphological results of Zhu et al. (1963). Sampling errors, scarce data and mismodeling may have contributed to these disputes. Thus, the inclusion of further data from the mitochondrial and nuclear genomes, more accurate evolutionary models, and extensive taxonomic sampling, with careful identification integrated with information on morphological characters, is required for reconstructing the phylogeny of Sciaenidae.
Acknowledgments
This study was supported by the Nation Nature Science Foundation of China (31001120), Zhejiang Provincial Natural Science Foundation of China (Y3100013) and Important Science and Technology Specific Projects of Zhejiang Province (2011C14012).
Supplementary Material
The following online material is available for this article:
Figure S1 -Gene map of the L. polyactis mitochondrial genome
Figure S2 -Sequences of L. polyactis mitochondrial tRNA genes, represented in the clover-leaf form.
Table S1 -PCR primers in the analysis of the L. polyactis mitochondrial genome
Table S2 -Base composition of the L. polyactis mitochondrial genome
Table S3 -Comparison of predicted initiation and termination condons of the 13 mitochondrial protein-coding genes among 23 species of Percoidei.
Table S4 -Codon usage in L. polyactis mitochondrial protein-coding genes
Table S5 -Consensus sequences of conserved domains in control regions of Percoidei species.
This material is available as part of the online version of this article from http://www.scielo.br/gmb
Received: June 14, 2011; Accepted: October 24, 2011.
Associate Editor: Ana Tereza R. Vasconcelos
License information: This is an open-access article distributed under the terms of the Creative Commons Attribution License, which permits unrestricted use, distribution, and reproduction in any medium, provided the original work is properly cited.

Figure S1 - Click to enlarge

Figure S2 - Click to enlarge

Table S3 - Click to enlarge

Table S5 - Click to enlarge
- Boore JL (1999) Animal mitochondrial genomes. Nucleic Acids Res 27:1767-1780.
- Brandley MC, Schmitz A and Reeder TW (2005) Partitioned Bayesian analyses, partition choice, and the phylogenetic relationships of scincid lizards. Syst Biol 54:373-390.
- Brought RE and Dowling TE (1997) Evolutionary dynamics of tandem repeats in the mitochondrial DNA control region of minnow Cyprinella spiloptera Mol Biol Evol 14:1187-1196.
- Broughton RE and Reneau PC (2006) Spatial covariation of mutation and nonsynonymous substitution rates in vertebrate mitochondrial genomes. Mol Biol Evol 23:1516-1524.
- Brown WM (1985) The mitochondrial genome of animals. In: McIntyre RJ (ed) Molecular Evolutionary Genetics. Plenum Press, New York, pp 95-130.
- Brown JM and Lemmon AR (2007) The importance of data partitioning and the utility of Bayes factors in Bayesian phylogenetics. Syst Biol 56:643-655.
- Cheng YZ, Xu TJ, Shi G and Wang RX (2010) Complete mitochondrial genome of the miiuy croaker Miichthys miiuy (Perciformes, Sciaenidae) with phylogenetic consideration. Mar Genomics 3:201-209.
- Cheng J, Ma GQ, Miao ZJ, Shui BN and Gao TX (2011) Complete mitochondrial genome sequence of the spinyhead croaker Collichthys lucidus (Perciformes, Sciaenidae) with phylogenetic considerations. Mol Biol Rep (Epub).
- Cui ZX, Liu Y, Li CP, You F and Chu KH (2009) The complete mitochondrial genome of the large yellow croaker, Larimichthys cracea (Perciformes, Sciaenidae): Unusual features of its control region and the phylogenetic position of the Sciaenidae. Gene 432:33-43.
- Guindon S and Gascuel O (2003) A simple, fast and accurate method to estimate large phylogenies by maximumlikelihood. Syst Biol 52:696-704.
- Gutell RR, Gray MW and Schnare MN (1993) A compilation of large subunit (23S and 23S-like) ribosomal RNA structures. Nucleic Acids Res 21:3055-3074.
- Habib M, Lakra WS, Mohindra V, Khare P, Barman AS, Singh A, Lal KK, Punia P and Khan AA (2010) Evaluation of cytochrome b mtDNA sequences in genetic diversity studies of Channa marulius (Channidae, Perciformes). Mol Biol Rep 38:841-846.
- Hixson JE and Brown WM (1986) A comparison of the small ribosomal RNA genes from the mitochondrial DNA of the great apes and humans: Sequence, structure, evolution and phylogenetic implications. Mol Biol Evol 3:1-18.
- Hu J, Zhang DX, Hao JS, Huang DY, Cameron S and Zhu CD (2010) The complete mitochondrial genome of the yellow coaster, Acraea issoria (Lepidoptera, Nymphalidae, Heliconiinae, Acraeini): Sequence, gene organization and a unique tRNA translocation event. Mol Biol Rep 37:3431-3438.
- Huelsenbeck JP and Ronquist F (2001) MRBAYES: Bayesian inference of phylogeny. Bioinformatics 17:754-755.
- Johansen S, Guddal PH and Johansen T (1990) Organization of the mitochondrial genome of atlantic cod, Gadus morhua Nucleic Acids Res 18:411-419.
- Kass RE and Raftery AE (1995) Bayes factors. J Am Stat Assoc 90:773-795.
- Kim IC and Lee JS (2004) The complete mitochondrial genome of the rockfish Sebastes schlegeli (Scorpaeniformes, Scorpaenidae). Mol Cell 17:322-328.
- Lin LS, Chen JH and Li HY (2008) The fishery biology of Trichiurus japonicus and Larimichthys polyactis in the East China Sea region. Mar Fish 30:126-134.
- Lin SL, Ying YP, Han ZQ, Xiao YS and Gao TX (2009) AFLP analysis on genetic diversity and population structure of small yellow croaker Larimichthys polyactis Afr J Biotechnol 8:2700-2706.
- Lowe TM and Eddy SR (1997) tRNAscan-SE: A program for improved detection of transfer RNA genes in genome sequence. Nucleic Acids Res 25:955-964.
- Meng ZN, Zhuang ZP, Ding SX, Jin XS, Su YQ and Tang QS (2004) Molecular phylogeny of eight Sciaenid species (Perciformes, Sciaenidae) in the China Sea based on mitochondrial 16S rRNA sequence. Prog Nat Sci 14:514-521 (in Chinese with abstract in English).
- Miya M and Nishida M (1999) Organization of the mitochondrial genome of a deep-sea fish, Gonostoma gracile (Teleostei, Stomiiformes): First example of transfer RNA gene rearrangements in bony fishes. Mar Biotechnol 1:416-426.
- Miya M, Takeshima H, Endo H, Ishiguro NB, Inoue JG, Mukai T, Satoh TP, Yamaguchi M, Kawaguchi A, Mabuchi K, et al. (2003) Major patterns of higher teleostean phylogenies: A new perspective based on 100 complete mitochondrial DNA sequences. Mol Phylogenet Evol 26:121-138.
- Naylor GJ, Collins TM and Brown WM (1995) Hydrophobicity and phylogeny. Nature 373:555-556.
- Nelson JS (2006) Fishes of the World. 4th edition. John Wiley and Sons, New York, 600 pp.
- Nylander JAA, Ronquist F, Huelsenbeck JP and Nieves-Aldrey JL (2004) Bayesian phylogenetic analysis of combined data. Syst Biol 53:47-67.
- Oh DJ, Kim JY, Lee JA, Yoon WJ, Park SY and Jung YH (2007) Complete mitochondrial genome of the rock bream Oplegnathus fasciatus (Perciformes, Oplegnathidae) with phylogenetic considerations. Gene 392:174-180.
- Oh DJ, Kim SJ and Jung YH (2008) Comparison of the mitochondrial genomes of East Asian Pseudolabrus fishes. Mitochondrial DNA 19:453-460.
- Ohtsuki T, Kawai G and Watanabe K (2002) The minimal tRNA: Unique structure of Ascaris suum mitochondrial tRNAser-UCU having a short T arm and lacking the entire D arm. FEBS Lett 514:37-43.
- Ojala D, Montoya J and Attardi G (1981) tRNA punctuation model of RNA processing in human mitochondria. Nature 290:470-474.
- Posada D (2008) jModelTest: Phylogenetic model averaging. Mol Biol Evol 25:1253-1256.
- Poulin E, Cardenas L, Hernandez CE, Kornfield I and Ojeda FP (2004) Resolution of the taxonomic status of Chilean and Californian jack mackerels using mitochondrial DNA sequence. J Fish Biol 65:1160-1164.
- Reeder TW (2003) A phylogeny of the Australian Sphenomorphus group (Scincidae, Squamata) and the phylogenetic placement of the crocodile skinks (Tribolonotus): Bayesian approaches to assessing congruence and obtaining condence in maximum likelihood inferred relationships. Mol Phylogenet Evol 27:384-397.
- Sambrook J and Russell DW (2001) Molecular Cloning: A Laboratory Manual. Cold Spring Harbor Laboratory Press, New York.
- Sbisa E, Tanzariello F, Reyes A, Pesole G and Saccone C (1997) Mammalian mitochondrial D-loop region structure analysis: Identification of new conserved sequence and their functional and evolutionary implications. Gene 205:125-140.
- Seikai National Fisheries Research Institute (2001) Biological and Ecological Characteristics of Valuable Fisheries Resources from the East China Sea and the Yellow Sea, Comparison between the Chinese and Japanese Knowledges. Seikai National Fisheries Research Institute, Nagasaki, 503 pp.
- Szafranski P (2009) The mitochondrial trn-cox1 locus: Rapid evolution in Pompilidae and evidence of bias in cox1 initiation and termination codon usage. Mitochondrial DNA 20:15-25.
- Taanman JW (1999) The mitochondrial genome: Structure, transcription, translation and replication. Biochim Biophys Acta 1410:103-123.
- Tamura K, Dudley J, Nei M and Kumar S (2007) MEGA4: Molecular Evolutionary Genetics Analysis (MEGA) ver. 4.0. Mol Biol Evol 24:1596-1599.
- Tong X, Du B, Yu DH, Gong SY, Guo YH, Huang GJ and Li LH (2007) Sequence analysis of mitochondrial 16S rRNA gene fragment in Chups croaker (Nibea coibor). Mar Fish Res 28:85-91 (in Chinese with abstract in English).
- Wan RJ and Sun S (2006) The category composition and abundance of ichthyoplankton in the ecosystem of the Yellow Sea and the East China Sea. Acta Zool Sin 52:28-44 (in Chinese with abstract in English).
- Wang TW and Clayton DA (1985) In vitro replication of human mitochondrial DNA: Accurate initiation at the origin of light-strand synthesis. Cell 42:951-958.
- Wyman SK, Jansen RK and Boore JL (2004) Automatic annotation of organellar genomes with DOGMA. Bioinformatics 20:3253-3255.
- Xiao YS, Zhang Y, Gao TX, Takashi Y, Yabe M and Sakurai Y (2009) Genetic diversity in the mtDNA control region and population structure in the small yellow croaker Larimichthys polyactis Environ Biol Fish 85:303-314.
- Xu TJ, Cheng YZ, Sun YN, Shi G and Wang RX (2010) The complete mitochondrial genome of bighead croaker, Collichthys niveatus (Perciformes, Sciaenidae): Structure of control region and phylogenetic considerations. Mol Biol Rep 38:4673-4685.
- Xue Y, Jin XS, Zhang B and Liang ZL (2004) Diet composition and seasonal variation in feeding habits of small yellow croaker Pseudosciaena polyactis Bleeker in the central Yellow Sea. J Fish Sci China 3:237-243.
- Yan LP, Hu F, Ling JZ and Li SF (2006) Study on age and growth of Larimichthys polctis in the East China Sea. Per Ocean Univ China 36:95-100 (in Chinese with abstract in English).
- Yang R, Wu XB, Yan P, Su X and Yang BH (2010) Complete mitochondrial genome of Otis tarda (Gruiformes, Otididae) and phylogeny of Gruiformes inferred from mitochondrial DNA sequences. Mol Biol Rep 37:3057-3066.
- Yang Z (1996) Maximum likelihood models for combined analyses of multiple sequence data. J Mol Evol 42:587-596.
- Zardoya R and Meyer A (1997) The complete DNA sequence of the mitochondrial genome of a 'living fossil', the coelacanth (Latimeria chalumnae). Genetics 146:995-1010.
- Zardoya R, Garrido-Pertierra A and Bautista JM (1995) The complete nucleotide sequence of the mitochondrial DNA genome of the rainbow trout, Oncorhynchus mykiss J Mol Evol 411:942-951.
- Zhao JL, Wang WW, Li SF and Cai WQ (2006) Structure of the mitochondrial DNA control region of the sinipercine fishes and their phylogenetic relationship. Acta Genet Sin 33:793-799.
- Zhu YT, Lo YL and Wu HL (1963) A Study on the Classication of the Sciaenoid Fishes of China, with Description of New Genera and Species. 1st edition. Shanghai Science and Technology Press, Shanghai, pp. 13-14.
Send correspondence to:
Publication Dates
-
Publication in this collection
20 Jan 2012 -
Date of issue
2012
History
-
Received
14 June 2011 -
Accepted
24 Oct 2011