Abstract
Herein, three-dimensional analyses of large strain consolidation applied to tail ings disposal in mining pits is studied. The main goal is to estimate filling time and, ac cordingly, the capacity of the pit. Other useful results, such as dry density profiles and water pore pressure generation are also obtained. Two different slimes from the iron ore beneficiation are considered: a low plastic silt-clay material, and a 10 times more permeable silt-like soil. The consolidation constitutive relationships were obtained by performing HCT tests (Hydraulic Consolidation Test). The analyses were carried out using an algorithm that produces approximate solutions of the three-dimensional anal ysis using the computer program CONDES0. Two types of analyses were performed limiting the exact solution, one called upper bound and the other, lower bound. For purposes of this study, sensitivity analyses were also performed, including "instanta neous" consolidation, double drainage, and varying tailings production. Simulations of the co-disposal of the two different slimes were also addressed, where simultaneous rising and sharing of the tailings during reservoir occupation were sought by trial and error. In addition, prediction of the deposit surface profile in the long-term run was included. It was obtained from the filling of the pit with the Slime 01 for the lower bound 1054 days and for the upper bound, 1219 days. By comparing the slimes, Slime 02 offers the greater capacity. In the scenario of co-disposition, Slime 01 occupies 43% of the area and Slime 02, 57% of the area of the pit. Having already analyzed scenarios with constant and variable production of Slime 01 a greater capacity of the pit was ob tained for a constant production. Finally, there is a small difference in the pit capacity when the analyses are made considering the impermeable base and the permeable base.
Keywords:
large strain consolidation; three dimensional analyses; mining pit; fine tailings
1. Introduction
Disposal of slurries in the min ing pit has become a handy solution for companies in regions where strict regulations are enforced, discouraging the use of dams for tailings storage facilities (TSF). However, not enough attention has been given to precise cal culations on its storage capacity, and it is very often based on densities obtained from previous experiences or column sedimentation tests. Models considering large strain consolidation are required especially when it comes to the disposal of silt clayey tailings, or slimes, when high settlements (meters range) are expected and also the nonlinearity of material properties are considered.
Pit filling analyses with slimes very often require a tridimensional ap proach of large strain consolidation. In practice, however, two- and three-dimensional large strain consolidation solutions (Jakubick et al., 2003, apud Gjerapic et al.,2008GJERAPIC, G., JOHNSON, J., COFFIN, J., ZNIDARCIC, D. Determination of Tailings Impoundment Capacity via Finite-Strain Consolidation Models, 2008.) are rarely con sidered, due to the lack of an adequate constitutive model, excessive computa tional times, and numerical difficulties (Gjerapic et al., 2008).
In this context, Gjerapic et al., (2008GJERAPIC, G., JOHNSON, J., COFFIN, J., ZNIDARCIC, D. Determination of Tailings Impoundment Capacity via Finite-Strain Consolidation Models, 2008.), have addressed the tridimen sional problem of large strain consoli dation through an algorithm that uses unidimensional large strain consolida tion solutions. For this purpose, the 3-D volume is discretized in columns, where a series of computations are done con sidering unidimensional consolidation, and the whole behavior is obtained by summing up the geometries of adjacent columns, and having as premises that the lateral drainage and displacements are negligible. This approximate ap proach also uses the idea of bordering solutions to the real or exact solution, something like “upper bound” and “lower bound” limits.
The upper bound solution uses the central or the tallest column for the consolidation computations. Accord ingly, this solution implies that lateral adjacent columns settles at the same rate to the central column, or in other words, the lateral column foundations experi ence the same settlement that the slimes of the tallest column have at the same elevation. This hypothesis renders an overestimation of the pit capacity. The amount of this overestimation depends on material properties and geometry.
The lower bound solution con siders all columns to be placed on fixed terrain and that columns settle individually according to their height, and therefore the tallest column shows more settlement, meaning that it takes more material to attend the require ment of surface levels off during pit filling. This rationale applies also to adjacent columns from the inner ones to the outer counterparts. The lower bound solution requires much more computational effort to reach its solu tion, but it is closer to the real or exact solution. The upper bound solution is more frequently used for sensitive analyses and the lower bound is used to find the design filling pit capacity. Gjerapic et al., (2008GJERAPIC, G., JOHNSON, J., COFFIN, J., ZNIDARCIC, D. Determination of Tailings Impoundment Capacity via Finite-Strain Consolidation Models, 2008.) presents the methodology for each type of solution. The following presents some important characteristics of their study:
-
Geometry of the tailings im poundment is assumed to resemble an inverted cone;
-
Compressibility and permeabil ity relationships for the consolidation model are defined as follows
where e denotes the void ratio, σ’ is the effective stress and k stands for the hydraulic conductivity. A, B, C, D and Z are material parameters typically deter mined from laboratory measurements (Liu and Znidarcic, 1991LIU, J.C. & ZNIDARCIC, D. (1991). Modeling One-Dimensional Compression Characteristics of Soils. Journal of Geotechnical Engineering, ASCE, v.117, n. 1, p. 164-171,1991.).
-
tailings production rate (QS) is known;
-
step-wise constant relationship for the rate of the rise in a specific stage, qi, is a function of the tailings height, h:
where ρw denotes the water density and e0 stands for the initial void ratio, e0=AZB. Within each stage there is a mid-point elevation, fi, at which the rate of the rise must change from qi to qi+1 in order for the volume calculated from the filling rates to correspond to the volume of the impoundment at the end of that stage.
-
Impoundment volume can be calculated by using the corrected mid-point elevations, fi:
-
With the calculated mid-point elevations and the rates of the rise, the impoundment is envisioned as consisting of n one-dimensional columns with the cor responding areas ALBi = Ai-Ai1 (i=1, 2, ...., n), where A0=0. The maximum height for each of these columns can be expressed as HLBi=Hn- fi-1. Note that the impoundment volume is also equal to the sum of individual column volumes, i.e.:
Besides implementing the Gjera pic et al., algorithm in a real case, this research has advanced by considering more scenarios such as variable (in time) tailings production (QS) rate, and also co-disposal of two materials with different consolidation properties and production rates. In the first case, the rate of rising changes not only at discretized elevations (fi), but also in different times, according to a production plan. In the co-disposal case, the solution was obtained by trial and error, where the percentage of the areas that are occupied by each type of material during filling render that they raise at the same rate until they reach the final elevation at the same time (Oliveira Filho, 2017).
2. Materials and methods
2.1 Sample characterization
Two samples of tailings from the beneficiation of an iron ore were used in this study. The sample named Slime 01 was taken from a collection point located in a tailings dam in the state of Minas Gerais. The second sample, denominated
Slime 02, is composed by the blending of Slime 01 and the thinnest part of a sandy tailings from the beneficiation of the same ore.
Initially, mineral and geotechnical characterization of these materials were carried out. The most relevant results are presented in Table 1, and the others can be found in Pinho (2018)PINHO, M. Q. Aplicação de análises tridimensionais de adensamento a grandes deformações na disposição de rejeitos em cava de mineração. Dissertação de mestrado. Universidade Federal de Ouro Preto. p.113, 2018..
2.2 Consolidation tests
2.2.1 Determination of the curve e00 vs. epulp
The void ratio at zero effective stress (void ratio, e00) was determined by obtaining the curve e00 vs. epulp. Slimes were homogenized, placed in small con tainers, and left to rest for approximately 24 hours. After this period, the superna tant water was removed by syphoning and the material left in the container was evaluated for water content (w), and void ratio determination (e). For Slime 01, void ratio e00 equals to 3.19, and for Slime 02, 1.79.
2.2.2 Hydraulic Consolidation Test (HCT)
Constitutive relationships for large strain consolidation were obtained by performing Hydraulic Consolidation Tests (HCT) as proposed by Imai (1980IMAI, G. Settling behavior of clay suspension. Soils and Foundation, Japanese Society of Soil Mechanics and Foundation Engineering, v. 20, n. 02, 1980.), Zin darcic and Liu (1989). The HCT is a system formed by a flow pump, pressure control panel, triaxial cell, differential pressure transducer, data acquisition system and a load system.
The experimental part of the pro cedure consists of three distinct phases providing data for the test analysis. These include the determination of the zero effec tive stress void ratio, e00, the steady-state stage of the seepage induced consolidation test, and the step loading test with the direct permeability measurements at high effective stresses (Abu-Hejleh et al., 1996).
A flow rate of 0.03 ml/min was ap plied during the seepage consolidation phase and the test was finalized when stability condition was achieved with no further settlement and pressure difference in the specimen, ΔP, became constant. The step loading test took the specimen to consolidate at 86 kPa for approximately 20 hours, and then the final height of the specimen was determined. The third stage of the test which corresponds to the measurement of the permeability of the already consolidated specimen, was per formed using flow rates of 0.03 ml/min, 0.06 ml/min, 0.09 ml/min and 0.12 ml/ min. In the end of the permeability test, the specimen was removed and its dry mass determined.
The analysis of the test was performed using the SICTA program developed by Abu-Hejleh & Znidarcic (1992). Then, the empirical parameters A, B, C, D and Z of the consolidation of the constitutive relation ships were determined for a given sample.
2.3 Three-dimensional consolidation analysis at large deformations
2.3.1 Methods for numerical simulations of pit filling
In general, the three-dimensional consolidation study follows the strategy of the analysis proposed by Gjerapic et al., (2008GJERAPIC, G., JOHNSON, J., COFFIN, J., ZNIDARCIC, D. Determination of Tailings Impoundment Capacity via Finite-Strain Consolidation Models, 2008.), which uses an algorithm that includes the CONDES0 program for unidimensional consolidation computations developed by Yao & Znidarcic (1997YAO, T. C., ZNIDARCIC, D. User's manual for computer program CONDES0. Boulder, Colorado: Department of Civil, Environmental and Architectural Engineering, University of Colorado, p. 98, 1997.). Three solutions are presented to deal with the problem: one that evaluates the maximum pos sible capacity of a tailings deposit considering a hypothetical situation of instantaneous consolidation (only compressibility matters), and two oth ers that consider the phenomenon of the material consolidation for evaluation of pit capacity, as well as the upper and lower bound solutions.
2.3.2 General assumptions of the consolidation analysis
The main premises of the analyzes are described as follows:
-
Continuous filling at rates according to the geometry of the problem (elevation x area x volume curves) and a production plan.
-
Analyses performed until the consolidating slimes reach the maximum project elevation.
-
Slimes are in the fluid state which implies that their surface level is off when at repose, i.e. the reservoir rises evenly throughout its area.
-
As a base case, drainage occurs only at the top, and the impoundment has an impermeable base.
-
Vertical discretization of the fill ing columns is done by layers according to the depth of the pit and the desirable level of detail.
-
Discrete problem results (notable points) are established at each layer change and/or change in the production rate.
-
The primary results are elevation curves (nominal, sedimented, and con solidated heights) versus time and elevation curves (profiles), versus void ratio for dif ferent times.
3. Results and discussions
3.1 Material consolidation properties
The results obtained in the HCT (Hydraulic Consolidation Test) to obtain the constitutive relationships for Slime 01 and Slime 02 are presented in the Table 2.
With the material parameters, the compressibility and permeability curves were determined and are shown in Figures 1 and 2, respectively.
The HCT results show that Slime 01 is ten times more permeable than Slime 02, and this contrasting permea bility is a factor that impacts enormous ly the pit capacity as will be seen later in the analyses.
3.2 Problem definition and scenarios
The material properties are the ones seen in Figures 1 and 2. A hy pothetical mining pit was used. Its elevation varies from 100 to 160 m; therefore, it has a depth of 60 m. Figure 3 shows the Elevation - Area - Volume curves for the fictitious mining pit used in this study, and Figure 4 exhibits the vertical discretization of the filling col umn every 10 meters up to a height of 60 m (Elevation 160 m), thus totaling 6 layers.
The tailings production plan was based on a large company that owns sev eral iron ore mines. Constant or varying tailings production rates were considered in different cases. Besides the impermeable boundary in the base case, bottom drainage was also examined. Finally, a co-disposal scenario is part of the study, as its evaluated pit capacity in case Slime 01 and Slime 02 are discharged simultaneously at opposing points in the reservoir, each one creating its own body obtained by sharing surface areas without mixing and raising at same rate. In Table 3, the characteristics of each proposed scenario are presented as follows:
The results of the analyses per formed according to each scenario are presented below. The focus of this work is the solution (3D consolidation) lower bound, where Scenario 1 is con sidered the "base scenario".
In addition, the analysis in which it is considered for the base scenario has been demonstrated, as well as the consolidation in infinite time, i.e., after the filling of the pit at the height of 60 m has been completed, obtain ing the “settlement curve” of the age of the pit for the calculation of each tailings column.
3.3 Base scenario results
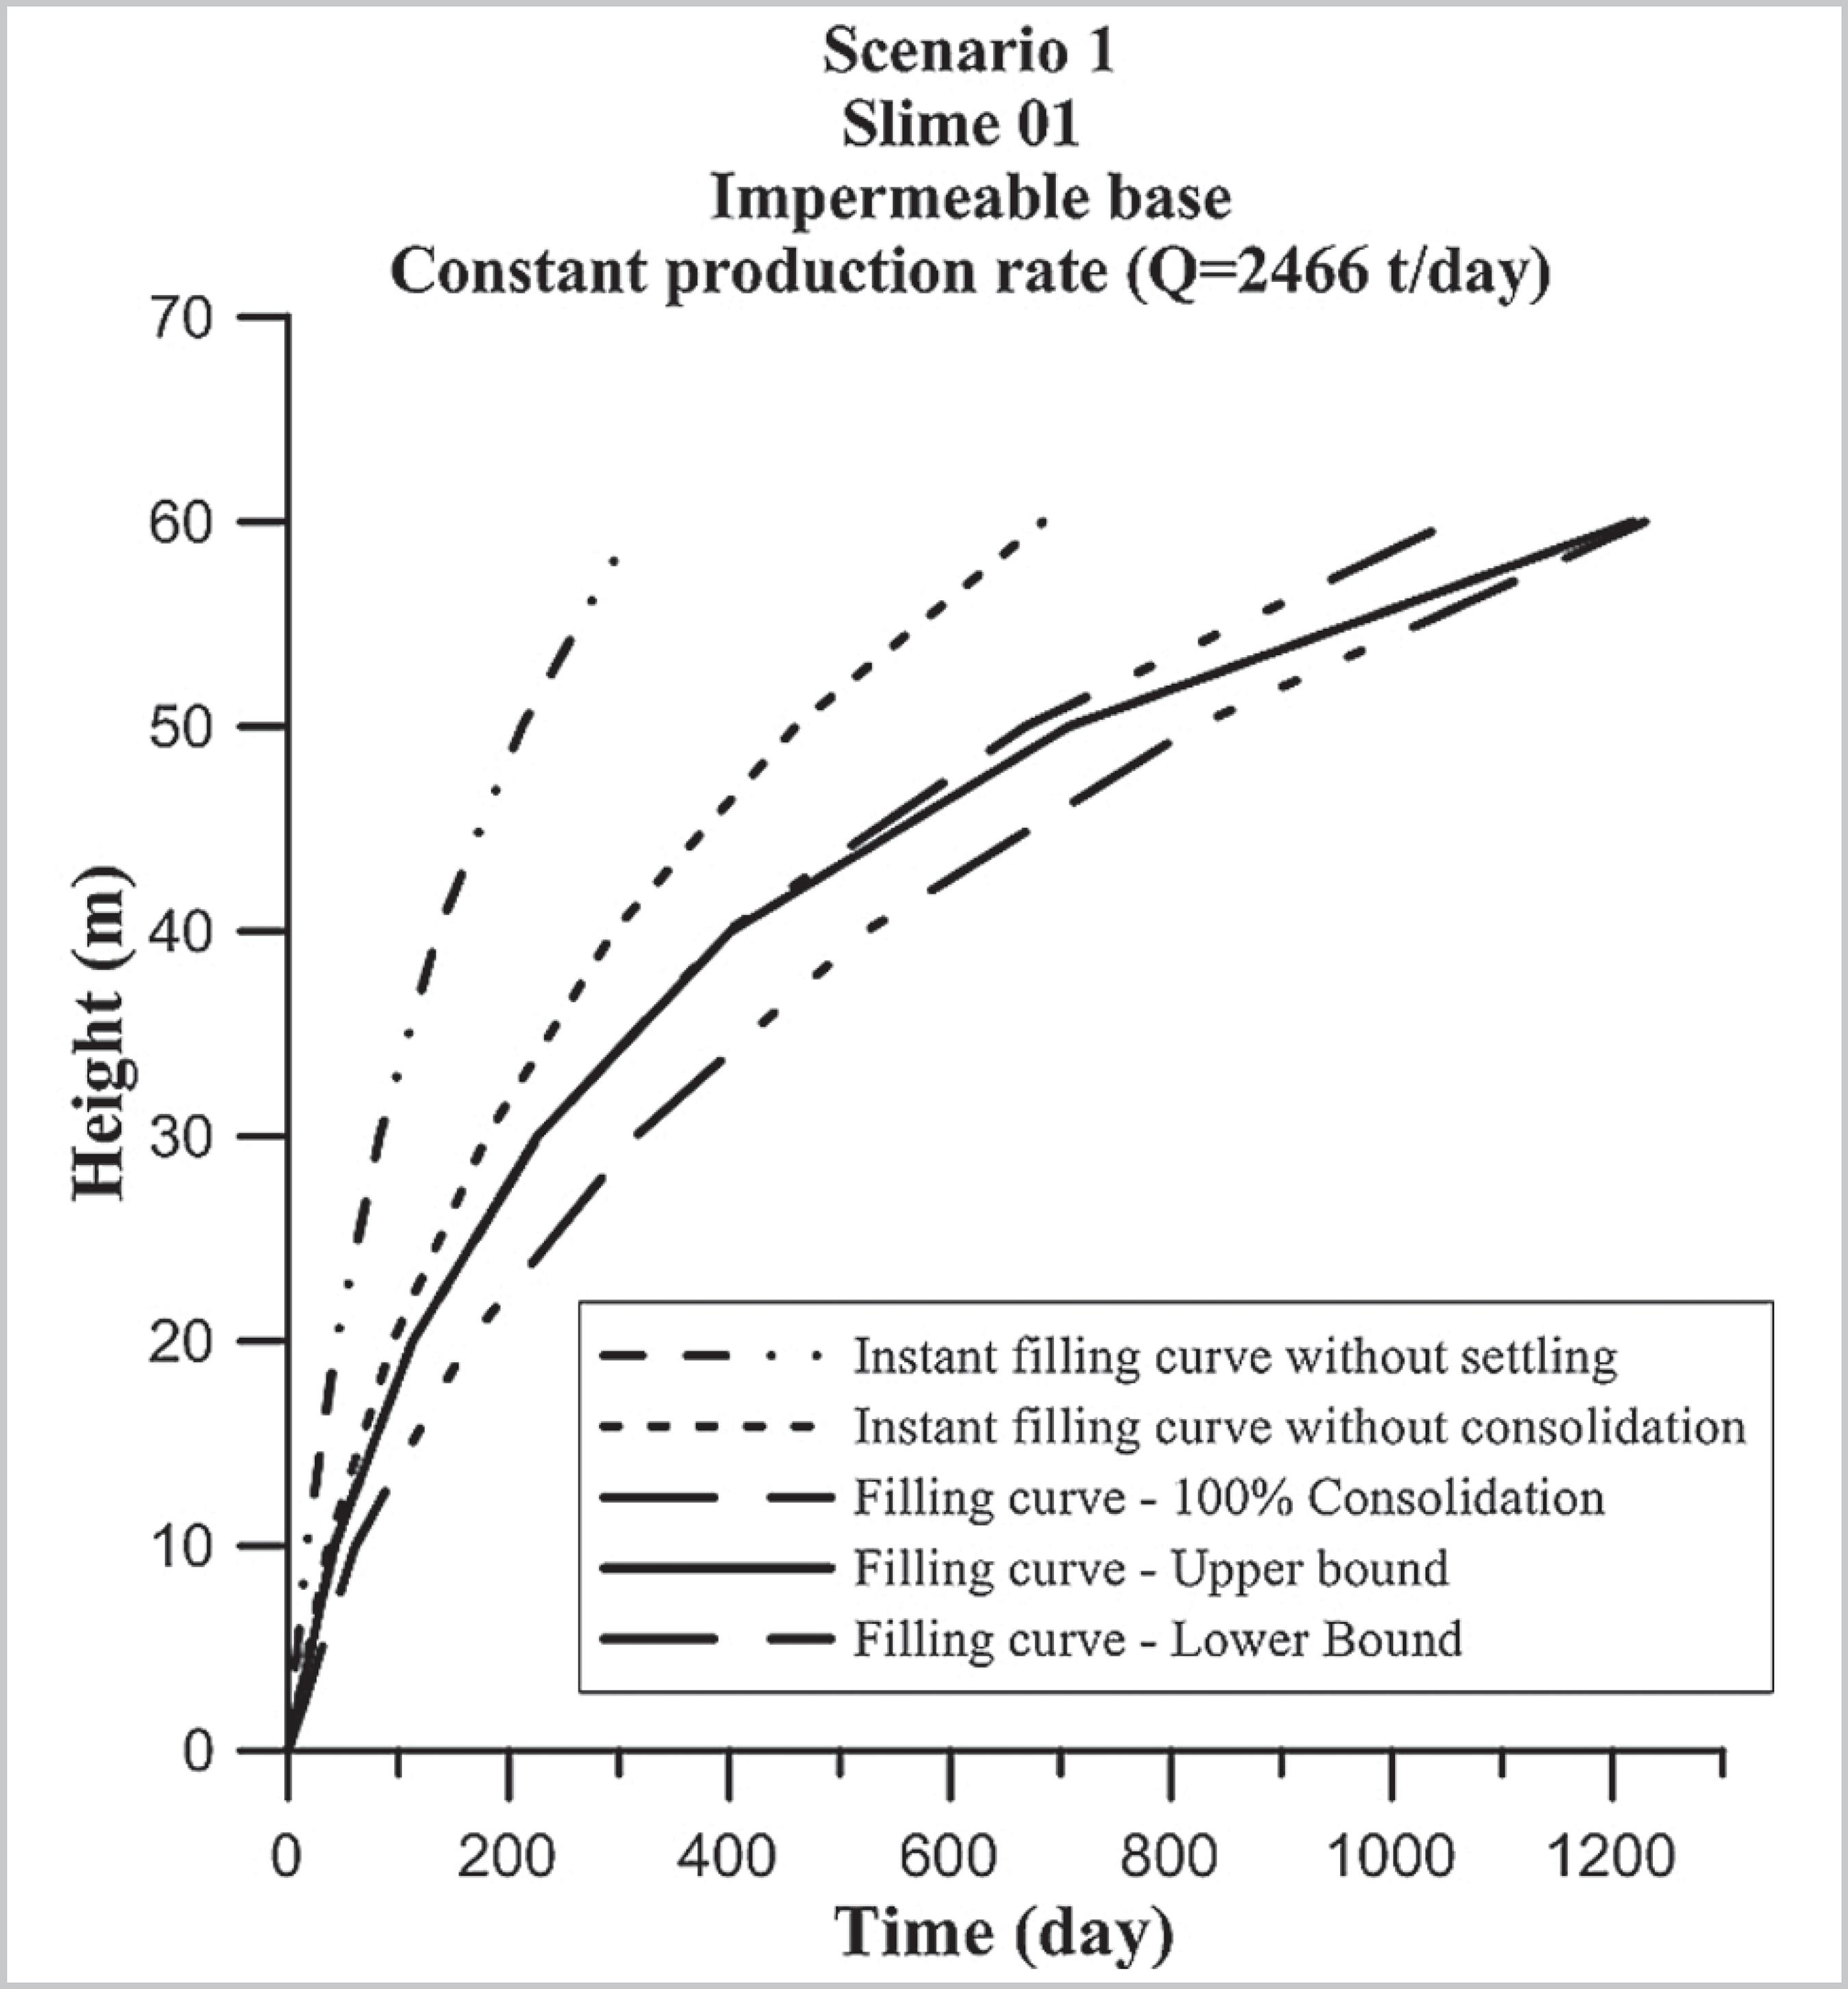
Figure 5 presents the results obtained for Scenario 1, considered as the base scenario, in which the filling of the pit was analyzed us ing Slime 01. Table 4 shows the time required to fill the pit until it reaches the height of 60 m for each type solution presented.
Notice that the lower limit solution presents a filling time lower than the upper limit solution. This result is expected since the upper limit solution overestimates the pit capacity, as it considers that all tailings columns of the pit settle at the same rate as the central or tallest column. On the other hand, the lower bound solution is more conservative, by considering that the sides of the pit are fixed. However, this last assumption is much closer to real terrains made of excavated pits. Figure 6 illustrates the filling sequence of the pit according to the lower bound solution and the filling rates in each step.
Filling sequence of the pit according to the lower bound solution and the filling rates in each step.
The analysis for the base case also investigated deposit elevations a long time after its capacity was reached. Figure 7 illustrates the de posit surface in the long run. Because the discretized columns have differ ent solids height, their consolidation settlements will be also different in the long run.
3.4 Other proposed scenario results
In Figure 8, a comparison is made of lower bound solutions for Slimes 01 and 02. Filling time for Slime 01 is 672 days and for Slime 02, it is 847 days. Note that filling the pit with the most permeable tail ings (Slime 02) provides greater capacity than with Slime 01. Co-disposal solutions for the filling of two different materials in the pit is presented in Figure 9. This highly non-linear problem is evaluated for a hy pothetical scenario where the production rate of Slime 01 corresponds to 75% of the production rate of Slime 02, both disposed at the same solids content, 36%. The trial and error solutions were obtained with a 43% area for Slime 01 against 57% area for Slime 02. At these percentages, both material bodies rise at same rate.
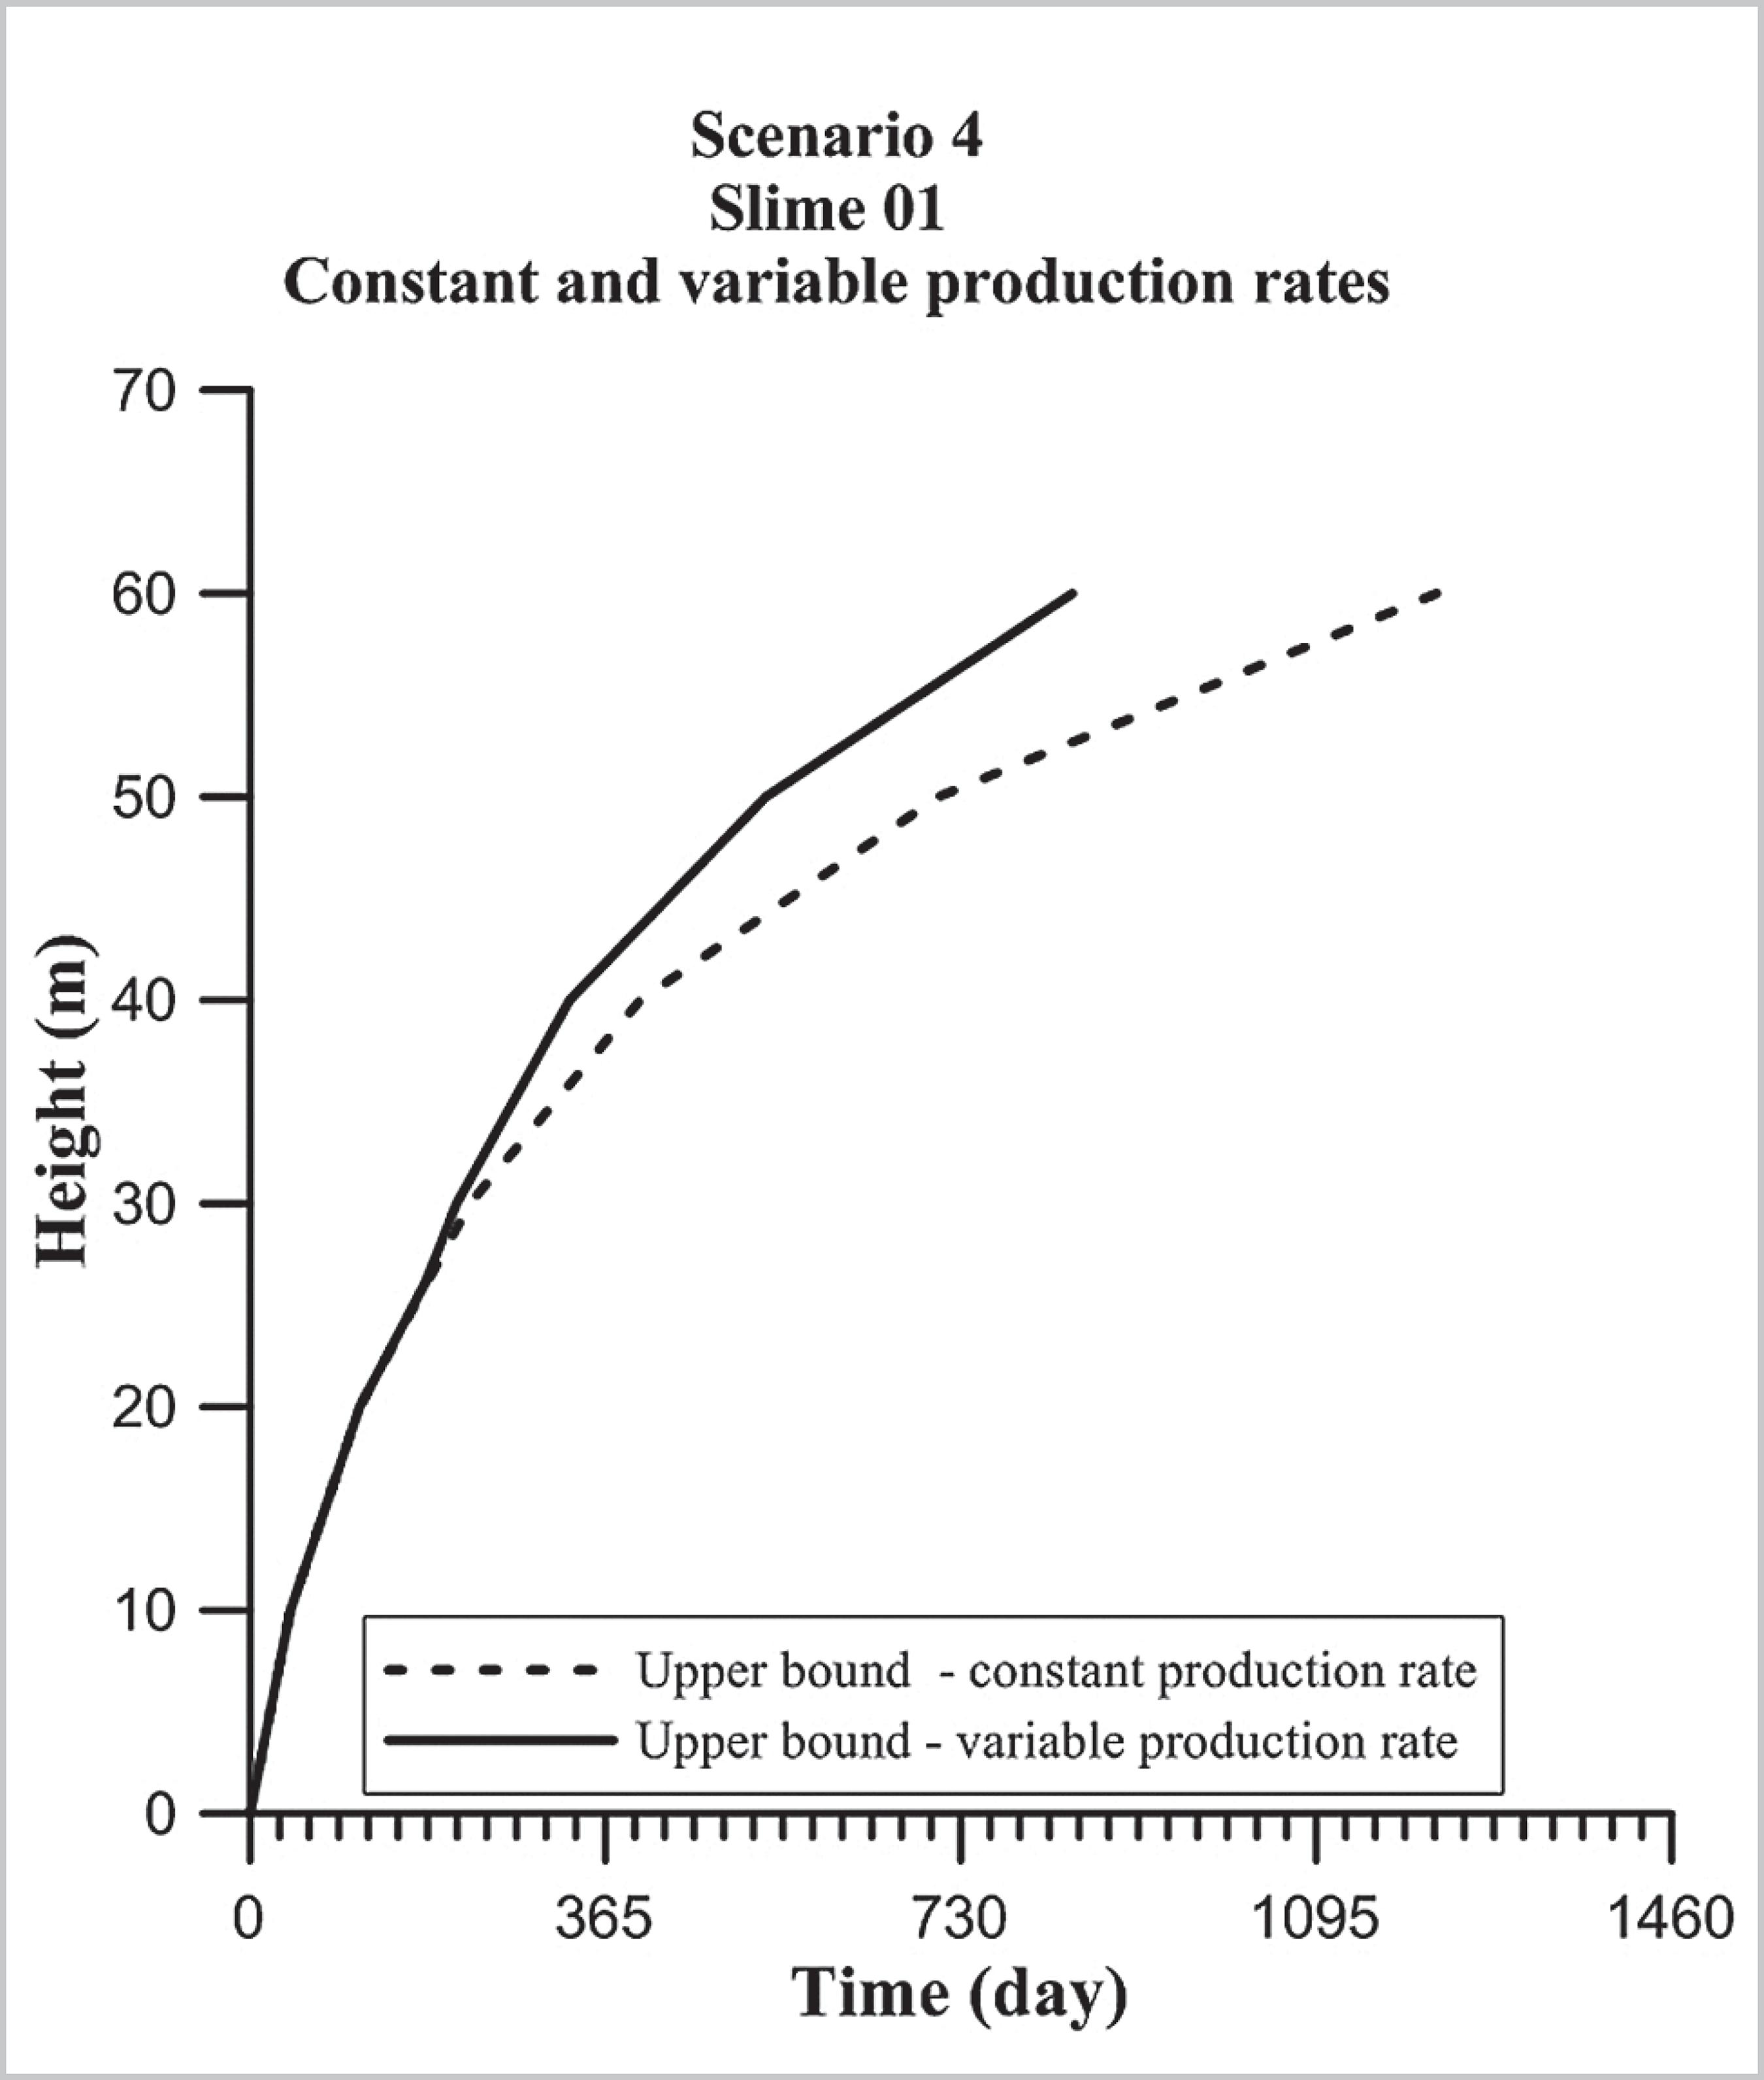
Scenario 4, which explores varia tion in the rate of production, has its results shown in Figure 10. In this case, only the upper bound analyses were performed. It was assumed that the beneficiation plant produces Slime 01 at a constant rate (2466 t/day) over the years and in the other analysis, after 180 days, the production rate would increase by 33.3% i.e., 3287 t/day. The idea was to show how to accommodate this common constraint in the analy sis. In this case, changes in the filling rate happen not only at the discretized elevations, but also according to the production plan (new concentrator, for example). In the example, time spent to fill the pit is lower for the solution considering the variable production rate (844 days) over the years. That is, in a scenario where the rate of tailings production develops over the years, the capacity of the pit decreases.
In the last simulation, the drain age condition at the base of Scenario 5 is examined to verify its impact in the pit capacity. The results are shown in Figure 11. It is seen that a permeable bottom extends the filling time from 1054 to 1102 days. This is not a sub stantial gain in capacity (less than 5%). This finding is important, since it shows that most of the water output happens on the surface of the deposit. Even if the deposit is lined, its filling time is not very impaired.
4. Conclusions
In this research, the pit tailings dis posal has been examined with focus on the three-dimensional large strain consolida tion modeling. Its scope was to implement an existent algorithm to efficiently address practical questions regarding filling time to reach the capacity of the pit, dry density profiles, pore pressure generation, among other issues.
Two fine tailings produced by the iron ore beneficiation plant were consid ered in the project. One of them can be classified as a cohesive material, but with low plasticity (non-clay minerals) and the other is a fine silt-like soil, which is ten times more permeable. The pit geometry consists of a hypothetical inverted cone shape structure, with a depth of 60 m, which was discretized vertically, while the tailings production plan was based on the average output of a medium min ing organization.
The modeling algorithm developed at the University of Colorado, USA, al lows an approximate solution of the 3-D problem by discretizing the pit volume in layers and columns, thus, rendering upper and lower bound solutions, using a one-dimensional large strain consolida tion model implemented in the CONDES software. The upper bound limit evalu ates the consolidation only at the central or tallest column and admits that all other columns settle at the same rate as the cen tral one. This approach overestimates the capacity of the pit. On the other hand, the lower bound considers the consolidation of all the columns, but it assumes that the column foundations are fixed.
The base case considered an imper meable bottom and simulated discharge of the cohesive tailings. The lower bound has shown a filling time of 1054 days against 1219 days for the upper bound. Consequently, with the knowledge that the lower bound premises are more realistic, one can use this result in a tail ings disposal plan. Other analyses have investigated additional issues such as the filling with a more permeable slime, co-disposal of the two tailings forming different bodies sharing the available pit volume, permeable bottom (double drainage), and a constant and variable production plan.
This type of analysis is of vital importance for the mining tailings plan ning, since the whole set of scenarios per formed produced substantial resources of useful design information.
Acknowledgments
It shall be recognized general support of UFOP by the Graduate Program on Mineral Engineering, stu dents Stephanie, Otávio and Kennedy, CNPq, Dobroslav Znidarcic for his help in the analyses.
References
- ABU-HEJLEH, A. N. E., ZNIDARCIC, D. User manual for computer program SICTA. Department of Civil, Environmental and Architectural Engineering, University of Colorado, Boulder, Colorado, p. 101, 1992.
- ABU-HEJLEH, A. N., ZNIDARCIC, D., BARNES, B. L. Consolidation Characteristics of Phosphatic Clays. Journal of Geotechnical Engineering, ASCE, v. 122, n. 4, p. 295-301, 1996.
- GJERAPIC, G., & ZNIDARCIC, D. A Mass-Conservative Numerical Solution for Finite-Strain Consolidation Soil Deposition . In: Geo-Denver 2007 Conf. Proc. Paper. Denver: GPS 157, 2007.
- GJERAPIC, G., JOHNSON, J., COFFIN, J., ZNIDARCIC, D. Determination of Tailings Impoundment Capacity via Finite-Strain Consolidation Models, 2008.
- IMAI, G. Settling behavior of clay suspension. Soils and Foundation, Japanese Society of Soil Mechanics and Foundation Engineering, v. 20, n. 02, 1980.
- LIU, J.C. & ZNIDARCIC, D. (1991). Modeling One-Dimensional Compression Characteristics of Soils. Journal of Geotechnical Engineering, ASCE, v.117, n. 1, p. 164-171,1991.
- OLIVEIRA FILHO, W. L. Análises 3D da Cava de Alegria Sul. Relatório de Pesquisa (3-D Analyses of the Alegria South Cave- Research Report). Ouro Preto, 2017.
- PINHO, M. Q. Aplicação de análises tridimensionais de adensamento a grandes deformações na disposição de rejeitos em cava de mineração Dissertação de mestrado. Universidade Federal de Ouro Preto. p.113, 2018.
- YAO, T. C., ZNIDARCIC, D. User's manual for computer program CONDES0. Boulder, Colorado: Department of Civil, Environmental and Architectural Engineering, University of Colorado, p. 98, 1997.
- ZNIDARCIC, D. & LIU, J. C. Consolidation Characteristics Determination for Dredged Materials. Proc., 22nd Annu. Dredging Seminar, Ctr. for Dredging Studies, Texas A&M Univ., College Station, Tex., p. 45-65, 1989.
- ZYL, D. V., ZNIDARCIC, D., GJERAPIC, G. Modeling Aspects of Tailings Disposal Facility Design - Prediction of Storage Capacity . In: Tailings and Mine Waste ‘12 Conference, Keystone: 2012.
Publication Dates
-
Publication in this collection
22 June 2020 -
Date of issue
Jul-Sep 2020
History
-
Received
26 Dec 2018 -
Accepted
14 Apr 2020