Abstracts
PURPOSE: Auditory-perceptual evaluation of dysphonia may be influenced by the type of speech/voice task used to render judgements during the clinical evaluation, i.e., sustained vowels versus continuous speech. This study explored (a) differences in listener dysphonia severity ratings on the basis of speech/voice tasks, (b) the influence of speech/voice task on dysphonia severity ratings of stimuli that combined sustained vowels and continuous speech, and (c) the differences in inter-rater reliability of dysphonia severity ratings between both speech tasks. METHODS: Five experienced listeners rated overall dysphonia severity in sustained vowels, continuous speech and concatenated speech samples elicited by 39 subjects with various voice disorders and degrees of hoarseness. RESULTS: Data confirmed that sustained vowels are rated significantly more dysphonic than continuous speech. Furthermore, dysphonia severity in concatenated speech samples is least determined by the sustained vowel. Finally, no significant difference was found in inter-rater reliability between dysphonia severity ratings of sustained vowels versus continuous speech. CONCLUSION: Based upon the results, both types of speech/voice tasks (i.e., sustained vowel and continuous speech) should be elicited and judged by clinicians in the auditory-perceptual rating of dysphonia severity.
Auditory perception; Voice quality; Evaluation; Dysphonia; Phonetics
OBJETIVO: A avaliação perceptivo-auditiva da disfonia pode ser influenciada pelo tipo de tarefa utilizada para eliciar o julgamento clínico, como vogais sustentadas versus fala. Este estudo explorou a classificação da intensidade de disfonia, analisando (a) as diferenças encontradas entre os resultados das tarefas de voz e fala, (b) a influência da tarefa usando estímulos combinados de vogais sustentadas e fala, e (c) as diferenças na confiabilidade interavaliadores de acordo com as tarefas analisadas. MÉTODOS: Cinco avaliadores experientes classificaram a intensidade da disfonia em amostras de vogais sustentadas e fala encadeada de 39 sujeitos com vários distúrbios vocais e diferentes graus de alteração. RESULTADOS: Os dados confirmaram que as vogais sustentadas foram avaliadas como mais desviadas em relação às tarefas de fala. Além disso, a intensidade da disfonia em amostras de fala concatenada é menos influenciada pela vogal sustentada. Finalmente, não houve diferenças na confiabilidade interavaliadores entre as classificações da intensidade da disfonia quando comparados os resultados da análise de vogais sustentadas e fala. CONCLUSÃO: Com base nos resultados, os dois tipos de tarefas (vogal sustentada e fala) devem ser utilizados para o julgamento clínico na avaliação perceptivo-auditiva da intensidade da disfonia.
Percepção auditiva; Qualidade vocal; Avaliação; Disfonia; Fonética
ORIGINAL ARTICLE
Sustained vowels and continuous speech in the auditory-perceptual evaluation of dysphonia severity
Vogais sustentadas e fala encadeada na avaliação perceptivo-auditiva da intensidade da disfonia
Youri MarynI; Nelson RoyII
IOtorhinolaryngology and Head & Neck Surgery, Speech-Language Pathology and Audiology, Sint-Jan General Hospital - Bruges, Belgium; Speech Therapy and Audiology, Faculty of Health Care, University College Ghent - Ghent, Belgium
IIDivision of Otolaryngology-Head & Neck Surgery, Department of Communication Sciences & Disorders, University of Utah - Salt Lake City, USA
Correspondence address Correspondence address: Youri Maryn Sint-Jan General Hospital Speech-Language Pathology and Audiology Ruddershove 10, 8000 Brugge, Belgium E-mail: youri.maryn@azsintjan.be
ABSTRACT
PURPOSE: Auditory-perceptual evaluation of dysphonia may be influenced by the type of speech/voice task used to render judgements during the clinical evaluation, i.e., sustained vowels versus continuous speech. This study explored (a) differences in listener dysphonia severity ratings on the basis of speech/voice tasks, (b) the influence of speech/voice task on dysphonia severity ratings of stimuli that combined sustained vowels and continuous speech, and (c) the differences in inter-rater reliability of dysphonia severity ratings between both speech tasks.
METHODS: Five experienced listeners rated overall dysphonia severity in sustained vowels, continuous speech and concatenated speech samples elicited by 39 subjects with various voice disorders and degrees of hoarseness.
RESULTS: Data confirmed that sustained vowels are rated significantly more dysphonic than continuous speech. Furthermore, dysphonia severity in concatenated speech samples is least determined by the sustained vowel. Finally, no significant difference was found in inter-rater reliability between dysphonia severity ratings of sustained vowels versus continuous speech.
CONCLUSION: Based upon the results, both types of speech/voice tasks (i.e., sustained vowel and continuous speech) should be elicited and judged by clinicians in the auditory-perceptual rating of dysphonia severity.
Keywords: Auditory perception; Voice quality; Evaluation; Dysphonia; Phonetics.
RESUMO
OBJETIVO: A avaliação perceptivo-auditiva da disfonia pode ser influenciada pelo tipo de tarefa utilizada para eliciar o julgamento clínico, como vogais sustentadas versus fala. Este estudo explorou a classificação da intensidade de disfonia, analisando (a) as diferenças encontradas entre os resultados das tarefas de voz e fala, (b) a influência da tarefa usando estímulos combinados de vogais sustentadas e fala, e (c) as diferenças na confiabilidade interavaliadores de acordo com as tarefas analisadas.
MÉTODOS: Cinco avaliadores experientes classificaram a intensidade da disfonia em amostras de vogais sustentadas e fala encadeada de 39 sujeitos com vários distúrbios vocais e diferentes graus de alteração.
RESULTADOS: Os dados confirmaram que as vogais sustentadas foram avaliadas como mais desviadas em relação às tarefas de fala. Além disso, a intensidade da disfonia em amostras de fala concatenada é menos influenciada pela vogal sustentada. Finalmente, não houve diferenças na confiabilidade interavaliadores entre as classificações da intensidade da disfonia quando comparados os resultados da análise de vogais sustentadas e fala.
CONCLUSÃO: Com base nos resultados, os dois tipos de tarefas (vogal sustentada e fala) devem ser utilizados para o julgamento clínico na avaliação perceptivo-auditiva da intensidade da disfonia.
Descritores: Percepção auditiva; Qualidade vocal; Avaliação; Disfonia; Fonética.
INTRODUCTION
Voice quality has been described as a poorly defined term "that includes all the leftover perceptions after pitch, loudness and phonetic category have been identified"(1). Consequently, it includes all perceptual dimensions of the spectral envelope and its changes in time(2). Voice quality is often viewed on a continuum with normal voice quality at one end of the continuum, and extreme dysphonia, at the other end. However, there are myriad types of voice qualities. For instance, disordered voice may be the result of insufficient vocal fold adduction during phonation, resulting in audible air leakage through the glottis. The auditory-perceptual correlate of this air turbulence is breathiness(2-4). Voice quality may also be disordered as a consequence of irregularity in the vibration of the vocal folds. In this case, irregular fluctuations in the frequency, the amplitude and/or the oscillation pattern of the vocal fold vibrations give rise to the auditory perception of roughness(2-4). Voice quality is thus a perceptual construct arising from the many cognitive processes and responses upon hearing a voice signal(5). The primary approach to assess voice quality in the clinic is the auditory-perceptual evaluation of the type (i.e., voice quality) and severity (i.e., degree) of dysphonia. Listener rating protocols to standardize and quantify this evaluation have been established and popularized including the ordinal four-point scales (i.e., Grade or G, Roughness or R, Breathiness or B, Asthenicity or A, and Strain or S) of the Committee for Phonatory Function Tests of the Japanese Society of Logopedics and Phoniatrics(3), and the hybrid scales from the Consensus Auditory-Perceptual Evaluation of Voice (i.e., CAPE-V) of the Special Interest Division 3 on Voice and Voice Disorders from the American Speech-Language-Hearing Association(6,7).
It is widely acknowledged however that listener judgements of type and severity of dysphonia can vary considerably. This variability has been attributed to factors related to poor inter- and intra-rater consistency, as well as the type of rating scale employed. But another source of variability, the type of speech to be rated - i.e., voice produced during sustained vowels or continuous speech - can seemingly contribute to variability in the auditory-perceptual assessment of voice quality as well(8-10). Whereas sustained vowels are held relatively constant at subglottal, glottal and supraglottal levels, continuous speech is characterized by temporal and spectral variations caused by voice onsets, voice terminations, vocal pauses, voiceless phonemes, phonetic context, prosodic fluctuations in F0 and intensity, speech rate, etc. The vocal behavior differs substantially between these two voice/speech tasks potentially leading to perceived differences in type and severity of dysphonia(10-14). However, there are conflicting reports in the literature in regards to the influence of voice context on listener ratings of dysphonia type and severity.
For instance, two studies(15,16) found no statistically significant differences in perceived dysphonia severity between sustained vowels and continuous speech, whereas three other studies(8-10) indicated that dysphonia, and especially breathiness, was perceived more severely in sustained vowels than in continuous speech.
One possible explanation is that in the sustained vowel context, dysphonia is the most prominent perceptual feature and less complicated by other non-vocal phenomena (e.g., prosodic fluctuation, phonetic context and phonological use of dysphonia). Thus the listener can focus almost exclusively on voice quality alone, and any deviation from the listener's expectation of a stable, relatively invariant voice signal would therefore be perceptually salient, leading to higher dysphonia severity ratings. Whereas in continuous speech, the listener has to extract the voice signal from a context that is characterized by fluctuations in other nonvocal phenomena and vocal deviations would therefore be less perceptually salient, leading to lower severity ratings. Auditory-perceptual ratings of dysphonia severity in continuous speech sounds can thus be hypothesized to be more difficult and to have more variability than in sustained vowel sounds. However, this is not supported by the data of De Bodt(9) and Bele(17). They both found that voice quality is rated least variable in continuous speech.
In summary, severity of dysphonia may be perceived distinctly in different voice/speech contexts, and consequently both continuous speech and sustained vowels can play unique roles in the clinical assessment of voice. Continuous speech elicits varying voicing patterns and sounds that are relatively representative of daily voice use. Sustained vowels, on the other hand, evoke more controlled, reasonably stable and somewhat less natural phonation. For a more comprehensive dysphonia assessment it has been argued that combining continuous speech and sustained vowels in the clinic would survey both contexts, and provide a more ecologically valid assessment of dysphonia severity (i.e., one that is truly representative of daily speech and voice use patterns)(13,14).
However, it is not known how clinicians arrive at a final dysphonia severity rating (i.e., G or Grade) of a person's voice in the clinical setting. It could be by rating its single factors: sustained vowel (i.e., GSV) or continuous speech (i.e., GCS). Alternatively, it could be that the listener attends to the most dysphonic speech type (i.e., listeners habitually choose the highest G-score, or GWORST), or the least dysphonic speech type (i.e., the listeners more frequently select the lowest G-score, or GBEST). Another conceivable option is that the dysphonia severity of sustained vowel and continuous speech are averaged, without computational weighting of their G-ratings, and according to the formula GAVERAGE = (GSV + GCS)/2. Alternatively, the auditory-perceptual system might apply a bivariate model in which the separate G-ratings are weighted as following: GMODEL = b±(ai×GSV)±(a j×GCS).
To address these issues, we aimed to answer the following research questions. First, in an extension of earlier research(8-10,15,16), we were interested in determining if there is a difference between the auditory-perceptual ratings of overall dysphonia severity in sustained vowels (i.e., GSV) versus continuous speech (GCS)? Second, what determines the eventual rating of concatenated signals wherein continuous speech and sustained vowels are combined (i.e., GCS+SV): the sustained vowel (i.e., GSV), the continuous speech (i.e., GCS), the least dysphonic or best of these two (i.e., GBEST), the most dysphonic or worst of these two (i.e., GWORST), the average of these two (i.e., GAVERAGE), or a statistically based model of these two (i.e., GMODEL)? Third, in extension of previous research(9,17): is there a difference in the raters' reliability between GSV and GCS?
METHODS
Subjects
The voice-disordered subjects were recruited from the ENT caseload of the Sint-Jan General Hospital in Bruges (Belgium). They were referred for clinical voice assessment by staff otolaryngologists. The group consisted of 39 participants and presented various organic and non-organic etiologies and various degrees in dysphonia severity. There were 25 females and 14 males, and ages ranged from 16 to 86 years with a mean of 47 years. This study consisted of a retrospective and non-interventional re-analysis of earlier recordings, and therefore no advise/consent of our Ethics Committee was needed(18).
Sound recordings
At the beginning of a standard voice assessment, every subject was asked to sustain the vowel [a:] for at least five seconds and to read aloud a phonetically balanced text(19) using a comfortable pitch and loudness. Both voice samples were recorded using an AKG C420 head-mounted condenser microphone (AKG Acoustic Harman Pro., Munich, Germany) and digitized at 44100 samples per second and 16 bits of resolution using the Computerized Speech Lab, CSL model 4500 (KayPentax, Lincoln Park, USA). The recordings were saved in wav-format. The vowel samples used in this study were edited to include only the middle three seconds. The read text/continuous speech samples were edited to include only the first two sentences. Finally, the voice samples were concatenated in the following order using the computer program Praat (Institute of Phonetic Sciences, Amsterdam, The Netherlands): text segment, a pause of two seconds, followed by the three second sustained vowel segment. An example of the resulting concatenated waveform is given in Figure 1. A total of 117 sound files were used/created in this study (i.e., 39*two sentences, 39*mid-vowel segments, and 39*concatenated files).
Auditory-perceptual ratings
Five listeners, with at least five years of experience in clinical voice quality assessment, rated all 117 randomly presented sound files on the ordinal four-point scale 'Grade' or 'G' (i.e., 0 = normophonia, 1 = minor dysphonia, 2 = moderate dysphonia, 3 = serious dysphonia). This perceptual experiment took place in a single rating session in a relatively quiet room. For each sound file, an average G-score (i.e., G-) was computed from the G-scores of the five judges.
To improve calibration among listeners, the degrees of dysphonia were discussed and agreed upon at the start of the rating session(20). Furthermore, three representative samples per level of G were selected from the dataset of previous studies and presented to the raters to minimize variability between their judgments. All raters, except the first author of this paper, were blinded to the research questions in this study.
Statistical methods
All statistical analyses were completed using SPSS for Windows version 12.0 (SPSS Inc., Chicago, Illinois, USA). To address the first research question (i.e., is there a statistically significant difference between G-CS and G-SV?), the nonparametric Wilcoxon signed ranks test was applied to assess the difference between the pairs of ordinal G-CS- and G-SV-data.
Prior to answering the second question, and operating under assumption that the auditory-perceptual system employs both GCS and GSV, linear regression analysis was used to create a two-factor model with G-CS+SV as the dependent variable and with G-CS and G-SV as independent variables. This method resulted in the following equation based on the unstandardized coefficients of the linear regression: G-MODEL = 0.08856+(0.663× G-CS)+(0.252× G-SV) To answer the second question (i.e., what determines the eventual G-CS+SV?), Wilcoxon signed ranks test statistics, Spearman rank-order correlation coefficients (i.e., rs) and coefficients of determination (i.e., rs2) were calculated between G-CS+SV and the variables G-CS, G-SV, G-BEST, G-WORST, G-AVERAGE and G-MODEL.
To address the third question (i.e., are listener ratings of G on sustained vowels as reliable as ratings of G on continuous speech?), between-rater single-measure intraclass correlation coefficients (i.e., ICC) on GSV and GCS were computed for all ten pairs of raters. Afterwards, the difference between the sets of ICC-data was examined by means of the nonparametric Wilcoxon signed ranks test for paired variables. A significant outcome on this test reflects task-dependent differences in the reliability of G. All results were considered to be statistically significant at p<0.05.
RESULTS
Difference between G-CS and G-SV
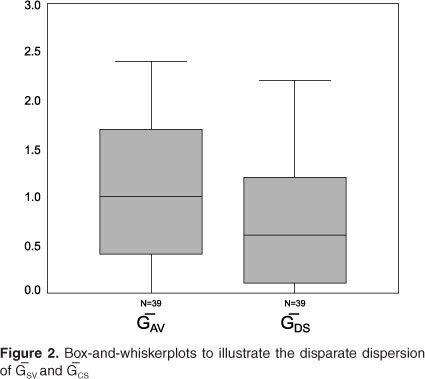
The G-CS-scores resulted in a mean of 0.76, a standard deviation of 0.69 and a range between 0.0 and 2.2. The G-SV-scores ranged between 0.0 and 2.6 and showed a mean of 1.03 with a standard deviation of 0.72. These statistics are summarized in Figure 2. In 66.7% of cases, G-SV>G-CS was found, G-CS>G-SV occurred in 12.8%, and in 20.5% G-SV equalled G-CS. The Wilcoxon signed ranks test indicated a statistically significant difference between G-CS and G-SV scores (p=0.002). Despite this difference, correlational analysis yielded rs=0.769 and rs2=0.591, indicating a reasonably strong association between G-CS and G-SV, accounting for 59.1% of the variation in scores.
Determination of G-CS+SV
Table 1 summarizes the results. The highest rs-values were found between G-CS+SV and G-MODEL (i.e., rs=0.946), and between G-CS+SV and G-AVERAGE (i.e., rs=0.934). The extremely strong associations between these variables are plotted in Figure 3. Furthermore, a strong association of rs=0.929 was also found between G-CS+SV and G-CS. The lowest rs was yielded between G-CS+SV and G-SV (i.e., rs=0.831). The coefficients of determination revealed that the variance in G-CS+SV is best accounted for in 89.5% and 87.2% by G-MODEL and G-AVERAGE, respectively. The least amount of variance (i.e., 69.1%) was explained by G-SV. Additional testing by means of the Wilcoxon signed ranks test revealed that G-CS+SV differs significantly (i.e., p<0.05) as compared to G-SV, G-CS, G-BEST, and G-WORST. However, no statistically significant difference was found with G-MODEL (i.e., p=0.364) and G-AVERAGE (i.e., p=0.131). Consequently, G-CS+SV and G-AVERAGE as well as G-CS+SV and G-MODEL are to be considered equivalent on a statistical basis.
Differences in inter-rater reliability
Table 2 summarizes the inter-rater single-measure ICC's upon which difference testing was based. The ICC's of the GSV-ratings ranged from 0.610 to 0.791, with a mean of 0.709. In the case of the GCS-ratings, the ICC's had a mean of 0.713 and varied between 0.489 and 0.811. A nonsignificant Wilcoxon signed ranks test showed that the reliability of rating G in sustained vowels is not statistically different from the reliability of rating G in continuous speech (p=0.646).
DISCUSSION
Judgement of voice quality and dysphonia severity is an auditory-perceptual phenomenon, in which a cognitive response follows auditory sensation of the voice signal(5). The auditory-perceptual method is therefore considered to be the gold standard for assessing voice quality in the clinic. To refine this method, it is useful to better understand possible sources of variability in listener judgements. One potential source of variability is the influence of different speech tasks or voice contexts in the perception dysphonia severity(8-10).
Voice produced in at least two types of contexts - sustained vowel and continuous speech - are often elicited clinically to evaluate voice quality and dysphonia severity. However, there are vocal-physiological differences between these two speech tasks, and thus differences in vocal quality and in type and severity of dysphonia can be anticipated. A study(8) investigated this difference and identified small, but statistically significantly higher G-scores in sustained vowels as compared to continuous speech. The three listeners in another(9) also rated G (as well as Breathiness, or B) in sustained vowels of 451 subjects significantly higher than in continuous speech. Additionally, the three judges in yet another study(10) estimated dysphonia to be significantly higher in sustained vowels than in continuous speech. The results of the present study confirm these findings. The absolute difference between mean G-CS and mean G-SV was 0.33, corresponding to approximately 10% of the total G-scale which ranges between 0 and 3. Collectively, these findings confirm that G-SV≠G-CS, and the size in which G-SV>G-CS, warrants sampling at least a sustained vowel and a set of continuously spoken sentences in the clinical protocol for voice quality and dysphonia assessment. With the first research question showing a significant difference between the two contexts, the second question is discussed below.
If continuous speech and sustained vowels are to be combined in dysphonia severity ratings, which speech type/context contributes most to the 'combined G-score' (i.e., G-CS+SV)? Is the listener mainly influenced by a specific type of speech (i.e., the sustained vowel or continuous speech), or alternatively is the listener principally affected by the severity of dysphonia (i.e., consistently choosing the least or most dysphonic speech type)? Or, is there a cognitively more sophisticated process occurring, in which the listener weights the G's of both speech tasks to arrive at an averaged or some other algorithm/modeled judgment? To the best of our knowledge, these questions have never been studied before. First, we found that G in continuous speech explained more of the variation in G-CS+SV than G in sustained vowel. Continuous speech thus plays a more salient role in the clinical appraisal of dysphonia severity. This is probably due to the fact that, in the many and diverse conversations in their daily life, the raters are frequently confronted with all kinds of voice qualities in continuous speech, whereas they are only occasionally faced with sustained vowels(21). One important exception is listening to music, and especially classical singing, in which long vocalizations are regularly present. However, this kind of phonation is not representative of the voice use patterns of the majority of help-seeking voice-disordered patients. Clinically-relevant perceptions of (disordered) voice quality are thus typically processed in the context of continuous speech. Second, the perceptual system does not seem to work on the basis of immutable heuristics such as 'always the worst of the two' or 'always the best of the two', regardless the type of speech. The proportions of these heuristics in the explanation of the variance in G-CS+SV were 84.6% and 77.6%, respectively - and do not exceed the proportion of choosing one specific type of speech. Additionally, the ratings of sustained vowels, continuous speech fragments, the least dysphonic speech type, and the most dysphonic speech type differed from G-CS+SV. This implies that perceptual strategies and decision-making depend on more than these relatively simple heuristics. Third, G-MODEL (i.e., a linear regression-based model for G-CS+SV, in which both G-CS and G-SV participate, but G-CS 2.6 times more than G-SV) correlated best with and was not statistically different from G-CS+SV, explaining 89.5% of its variation. Similar results were found between G-AVERAGE and G-CS+SV. From these results it can be inferred that the central/cognitive auditory-perceptual system works on the basis of some kind of statistical procedure taking all information into account and weighting it to summarize into one single impression/rating of G.
This study also investigated the differences in the inter-rater reliability between the sustained vowels and continuous speech. Both types of speech were rated on G by five experienced clinicians/speech-language pathologists. In contrast to the findings of other studies(9,17), the inter-rater ICC's for the sustained vowels and the continuous speech samples were not significantly different. This finding is in agreement with another research(15), which also showed no effect of sample type on inter-rater consistency of G.
CONCLUSION
The factor 'types of speech elicited in the clinical voice assessment' can generate variability/noise in the auditory-perceptual evaluation of dysphonia severity. The two speech tasks considered in the present study - i.e., sustained vowels and continuous speech - yielded significant differences in their ratings of degree of dysphonia severity. For completeness, it is therefore important to solicit both speech/voice types in the clinical voice protocol. Listeners process them with equivalent reliability, but weigh them differently to arrive at a final impression of dysphonia severity.
Received: 11/15/2011
Accepted: 3/19/2012
Study carried out at Otorhinolaryngology and Head & Neck Surgery, Speech-Language Pathology and Audiology, Sint-Jan General Hospital - Bruges, Belgium.
Conflict of interests: None.
- 1. Titze IR. Principles of voice production. Englewood Cliffs (NJ): Prentice Hall; 1994.
- 2. Kreiman J, Gerratt BR. Validity of rating scale measures of voice quality. J Acoust Soc Am. 1998;104(3 Pt 1):1598-608.
- 3. Hirano M. Disorders of human communication 5: clinical examination of voice. Wien: Springer-Verlag; 1981. Psycho-acoustic evaluation of voice; p. 81-4.
- 4. Kreiman J, Gerratt B. Measuring vocal quality. In: Kent RD, Ball MJ, editors. Voice quality measurement. San Diego: Singular Publishing Group; 2000. p. 73-101.
- 5. Shrivastav R. The use of an auditory model in predicting perceptual ratings of breathy voice quality. J Voice. 2003;17(4):502-12.
- 6. Kempster GB, Gerratt BR, Verdolini Abbott K, Barkmeier-Kraemer J, Hillman RE. Consensus auditory-perceptual evaluation of voice: development of a standardized clinical protocol. Am J Speech Lang Pathol. 2009;18(2):124-32.
- 7. Zraick RI, Kempster GB, Connor NP, Thibeault S, Klaben BK, Bursac Z, et al. Establishing validity of the Consensus Auditory-Perceptual Evaluation of Voice (CAPE-V). Am J Speech Lang Pathol. 2011;20(1);14-22.
- 8. Wolfe V, Cornell R, Fitch J. Sentence/vowel correlation in the evaluation of dysphonia. J Voice. 1995;9(3):297-303.
- 9. De Bodt M. A framework for voice assessment: the relation between subjective and objective parameters in the judgement of normal and pathological voice [Thesis]. Antwerpen: University of Antwerp, Faculty of Medicine; 2008.
- 10. Zraick RI, Wendel K, Smith-Olinde L. The effect of speaking task on perceptual judgment of the severity of dysphonic voice. J Voice. 2005;19(4):574-81.
- 11. Askenfelt AG, Hammarberg B. Speech waveform perturbation analysis: a perceptual-acoustical comparison of seven measures. J Speech Hear Res. 1986;29(1):50-64.
- 12. Parsa V, Jamieson DG. Acoustic discrimination of pathological voice: sustained vowels versus continuous speech. J Speech Lang Hear Res. 2001;44(2):327-39.
- 13. Maryn Y, Corthals P, Van Cauwenberge P, Roy N, De Bodt M. Toward improved ecological validity in the acoustic measurement of overall voice quality: combining continuous speech and sustained vowels. J Voice. 2010;24(5):540-55.
- 14. Maryn Y, De Bodt M, Roy N. The Acoustic Voice Quality Index: toward improved treatment outcomes assessment in voice disorders. J Commun Disord. 2010;43(3):161-74.
- 15. de Krom G. Consistency and reliability of voice quality ratings for different types of speech fragments. J Speech Hear Res. 1994;37(5):985-1000.
- 16. Revis J, Giovanni A, Wuyts F, Triglia J. Comparison of different voice samples for perceptual analysis. Folia Phoniatr Logop. 1999;51(3):108-16.
- 17. Bele IV. Reliability in perceptual analysis of voice quality. J Voice. 2005;19(4):555-73.
- 18. Federal Agentschap voor Geneesmiddelen en Gezondheidsproducten en Belgisch Raadgevend Comité voor Bio-ethiek. Leidraad over niet-interventionele studies [Guide for non-interventional studies]. Brussels: Federaal Agentschap voor Geneesmiddelen en Gezondheidsproducten, en Belgisch Raadgevend Comité voor Bio-ethiek [Federal Agency for Medicines and Health Products, and Belgian Advisory Committee on Bioethics]; 2007.
- 19. Van de Weijer JC, Slis IH. Nasaliteitsmeting met de nasometer. Logop Foniatr. 1991;63(5):97-101.
- 20. Chan KM, Yiu EM. The effect of anchors and training on the reliability of perceptual voice evaluation. J Speech Lang Hear Res. 2002;45(1):111-26.
- 21. Yiu E, Worrall L, Longland J, Mitchell C. Analysing vocal quality of connected speech using Kay's computerized speech lab: a preliminary finding. Clin Linguist Phon. 2000;14(4):295-305.
Publication Dates
-
Publication in this collection
01 Aug 2012 -
Date of issue
2012
History
-
Received
2011 -
Accepted
2012