Abstracts
In this project, we link fluid flow simulation results to time-lapse seismic through rock physics and modeling. Our goal is to examine the main effects of permeability barriers on seismic response using fluid flow simulations to generate pressure and saturation fields. To explore this problem, we have carried out water and gas injection numerical experiments in a simple reservoir model which has vertical and horizontal variations of porosity as well as permeability barriers. In each experiment, we change the barrier permeability values. By using fluid substitution theory, Gassmann and patchy models, and Batzle and Wang's empirical relationship we model the main seismic parameters, such as acoustic impedance and compressional velocity. After that, we generate synthetics seismograms and some contrast sections to compare the seismic images prior and after fluid injection events in subsequent time periods to analyze possible differences in the seismic parameters due to changes in barriers properties. The results show that barriers can increase fluid pore pressure changing the bulk modulus in the regions with barriers. The results also show that water flow does not have significant impact on seismic response when the barrier is present. On the other hand, gas flow and the degree of impermeability of the barrier can help us to understand how the barriers act on the seismic response and thus to reduce uncertainty. Finally, this paper presents a methodology to examine barriers effects on seismic response.
time-lapse seismic modeling; flow simulation; permeability barrier
No presente trabalho, fazendo-se uso de uma abordagem integrada de simulação de fluxo em reservatórios, física de rochas e modelagem sísmica time-lapse , investigam-se os principais efeitos das barreiras de permeabilidade na resposta sísmica, através da simulação de injeção de fluidos. Com o propósito de analisar os efeitos, realizaram-se alguns experimentos sintéticos de injeção de água e gás em um modelo simples de reservatório com variações laterais e verticais de porosidade e barreira de permeabilidade. O modelo básico foi construído levando-se em consideração alguns cenários de permeabilidade da barreira. Mediante a teoria da substituição de fluidos, e utilizando-se algumas relações empíricas que dão conta das propriedades da fase fluída em função da pressão e da temperatura, avaliaram-se, a partir de uma perspectiva dinâmica, atributos sísmicos, tais como: velocidade e impedância acústica. Posteriormente, gerou-se sismogramas sintéticos e algumas seções de contraste para comparar as imagens das seções sísmicas obtidas no início da produção com as imagens em tempos subseqüentes de modo a avaliar possíveis diferenças nos parâmetros sísmicos devido a mudanças nas propriedades da barreira de permeabilidade. Análises dos resultados revelaram que a injeção de água não induz efeitos significativos em presença de barreiras. Por outro lado, a injeção de gás e o grau de impermeabilidade da barreira podem nos ajudar a compreender melhor a maneira como a barreira de permeabilidade atua na resposta sísmica. Observou-se também que a presença de barreiras pode induzir um aumento de pressão no reservatório, modificando o módulo bulk dos fluidos em regiões concomitantes à barreira de permeabilidade.
modelagem sísmica time-lapse; simulação de fluxo; barreiras de permeabilidade
Time-lapse seismic modeling assisted by numerical reservoir simulation of water and gas flooding scenarios in oil reservoirs
Carlos ClaudinoI; Fredy ArtolaII; Wilson FigueiróIII; Vladimir AlvaradoIV
ICPGG-UFBA, Centro Pesquisa em Geofísica e Geologia da Universidade Federal da Bahia, Instituto de Geociências, Rua Barão de Jeremoabo, s/n, 40170-290 Federação, Salvador, BA, Brazil. Phone: +55 (71) 3283-8500/3283-8548; Fax: +55 (71) 3283-8501/3283-8551 - E-mail: carlos_claudino1@hotmail.com
IISchlumberger-Venezuela, Data & Consulting Services DCS, Av. Intercomunal, Torre BVC PH, Barcelona, Anzoategui, 4019A, Venezuela. Phone: +58 281 5005719 (office), +58 412 1882706 (cel.); Fax: +58 281 2868355 - E-mail: fartola@caracas.oilfield.slb.com
IIICPGG-UFBA, Centro Pesquisa em Geofísica e Geologia da Universidade Federal da Bahia, Instituto de Geociências, Rua Barão de Jeremoabo, s/n, 40170-290 Federação, Salvador, BA, Brazil. Phone: +55 (71) 3283-8520; Fax: +55 (71) 3283-8501/3283-8551 - E-mail: figueiro@cpgg.ufba.br
IVUniversity of Wyoming, College of Engineering and Applied Science, Department of Chemical & Petroleum Engineering, Dept. 3295, 1000 E. University Avenue, Laramie, WY, 82071, USA. Phone: +1-307-766-6464; Fax: +1-307-766-6777 - E-mail: valvarad@uwyo.edu
ABSTRACT
In this project, we link fluid flow simulation results to time-lapse seismic through rock physics and modeling. Our goal is to examine the main effects of permeability barriers on seismic response using fluid flow simulations to generate pressure and saturation fields. To explore this problem, we have carried out water and gas injection numerical experiments in a simple reservoir model which has vertical and horizontal variations of porosity as well as permeability barriers. In each experiment, we change the barrier permeability values. By using fluid substitution theory, Gassmann and patchy models, and Batzle and Wang's empirical relationship we model the main seismic parameters, such as acoustic impedance and compressional velocity. After that, we generate synthetics seismograms and some contrast sections to compare the seismic images prior and after fluid injection events in subsequent time periods to analyze possible differences in the seismic parameters due to changes in barriers properties. The results show that barriers can increase fluid pore pressure changing the bulk modulus in the regions with barriers. The results also show that water flow does not have significant impact on seismic response when the barrier is present. On the other hand, gas flow and the degree of impermeability of the barrier can help us to understand how the barriers act on the seismic response and thus to reduce uncertainty. Finally, this paper presents a methodology to examine barriers effects on seismic response.
Keywords: time-lapse seismic modeling, flow simulation, permeability barrier.
RESUMO
No presente trabalho, fazendo-se uso de uma abordagem integrada de simulação de fluxo em reservatórios, física de rochas e modelagem sísmica time-lapse , investigam-se os principais efeitos das barreiras de permeabilidade na resposta sísmica, através da simulação de injeção de fluidos. Com o propósito de analisar os efeitos, realizaram-se alguns experimentos sintéticos de injeção de água e gás em um modelo simples de reservatório com variações laterais e verticais de porosidade e barreira de permeabilidade. O modelo básico foi construído levando-se em consideração alguns cenários de permeabilidade da barreira. Mediante a teoria da substituição de fluidos, e utilizando-se algumas relações empíricas que dão conta das propriedades da fase fluída em função da pressão e da temperatura, avaliaram-se, a partir de uma perspectiva dinâmica, atributos sísmicos, tais como: velocidade e impedância acústica. Posteriormente, gerou-se sismogramas sintéticos e algumas seções de contraste para comparar as imagens das seções sísmicas obtidas no início da produção com as imagens em tempos subseqüentes de modo a avaliar possíveis diferenças nos parâmetros sísmicos devido a mudanças nas propriedades da barreira de permeabilidade. Análises dos resultados revelaram que a injeção de água não induz efeitos significativos em presença de barreiras. Por outro lado, a injeção de gás e o grau de impermeabilidade da barreira podem nos ajudar a compreender melhor a maneira como a barreira de permeabilidade atua na resposta sísmica. Observou-se também que a presença de barreiras pode induzir um aumento de pressão no reservatório, modificando o módulo bulk dos fluidos em regiões concomitantes à barreira de permeabilidade.
Palavras-chave: modelagem sísmica time-lapse , simulação de fluxo, barreiras de permeabilidade.
INTRODUCTION
Once a gas or an oil reservoir has been discovered and declared, it is essential to characterize the reservoir as accurately as possible, not only to estimate reserves, but also to establish the most effective development strategy through a recovery process, (Selley, 1998). In recent years, the oil industry has managed to increase the productivity of the fields by developing a number of techniques aimed at gathering reliable information on fluid dynamics in the reservoirs. Time-lapse seismic is among the list of techniques used to this end.
Time-lapse is used to investigate changes in reservoir properties due to production or injection of fluids into the reservoir.In this sense, time-lapse seismic sheds light on factors that influence reservoir dynamics, providing clues on potential structural barriers to fluid flow in the reservoir. The knowledge on barrier distribution is vital for development plans. These permeability barriers represent a serious problem, because depending on how impermeable these barriers are, they can become true limitations to fluid flow. In some cases, these barriers can be identified through geophysical methods, due to the contrast in lithology. However, in other cases, there is no significant variation in lithology, despite the fact that they present noticeable variations in transmissibility, which puts them outside of detection limit of conventional geophysical methods. Changes in permeability or transmissibility are perhaps associated with poor connectivity or distribution of the sedimentary material, instead.
In the aforementioned situation, is it still possible to locate the position of fluid flow barriers by geophysical means? A connected question is: what is the impact of barriers on the main reservoir parameters? Although obvious answers are not available, knowledge of possible effects of these barriers are of the outmost importance, as they directly impact the effectiveness of recovery methods. This article summarizes a time-lapse seismic analysis in terms of propagation velocity and amplitude of the seismic wave in synthetic reservoir models. Several injection and production scenarios were simulated, while the heterogeneity of the synthetic model involves lateral and vertical variations of porosity and the introduction of permeability barriers of specific geometry.The objective of this work is to identify effects in the seismic response due to the presence of the barriers in the model. The article is organized as follows. After the introduction, a section on the model for fluid substitution is presented, namely Gassmanntheory. Then, a section on fluid flow simulation explains how the reservoir simulation was carried out, including the most important parameters considered in the model. Results follow, starting with simulated waterflooding scenarios, showing results in terms of saturation and pressure maps, velocity and acoustic impedance, and closing with synthetic seismograms. Immiscible gas injection simulations are presented using the same structure of results as waterflooding.
Fluid substitution
The process of fluid substitution in seismic studies is based mainly on the work of Biot (1956) and Gassmann (1951). However, Gassmann's theory for fluid substitution is the most commonly one used in the range of seismic frequencies. The theory is simple and widely used to calculate changes in the seismic propagation velocity due to saturation by different fluids in the reservoir (Knight et al., 1998; Mavko & Mukerji, 1998; Sengupta &Mavko, 2003).
Gassmann developed a formalism that allows one to estimate the effect of fluids saturation on the bulk modulus of the reservoir rock through the following equations:
where Ksat is the bulk modulus of the saturated rock, Kd is the dry rock bulk modulus (porous skeleton), Kfl corresponds to the bulk modulus of the fluid saturating the rock, K0 is the mineral matrix bulk modulus, µsat is the rigidity (or shear) modulus ofthe saturated rock, µd, in contrast, is the dry rock rigidity modulus and ø, porosity.
In the fluid substitution process, it is fundamental to understand the significance of the parameters in Gassmann equations. In this regard, fluids substitution introduces the idea of a fluid displacing another, i.e. a multiphase flow displacement process. However, as we look at Kfl (term associated to fluids) inGassmann equations, no explicit representation of multiphase fluid substitution is found. This way, as Gassmann equations are applied to a reservoir with more than one fluid phase, the parameters Kfl will represent the incompressibility of an effective fluid made up by the phases that saturate the reservoir rock. ForGassmann equations, pore pressure equilibrium is assumed, therefore the effective fluid is considered homogeneous and uniformly distributed in the pore space, allowing Kfl to be calculated through the harmonic mean, known as Reuss average:
where Kfl is the bulk modulus of the effective fluid, Ki and Si are the bulk modulus and the saturation of the ith phase, respectively. The effective fluid density is a simple volumetric mean of the phase's densities. However, pressure is not always at equilibrium in the pores. In fact, fluid injection can alter the equilibrium state, and moreover, there are situations in which there is preferential occupancy of the pore space, perhaps due to wettability, leading to phase segregation and lack of equilibrium in the pore pressure (Smith et al., 2003). In these situations, a modified patchy model (Sengupta & Mavko, 2003) can be employed to calculate the bulk modulus of the saturated rock (kMP), associated to a two-phase system through the following equation:
where sf1, sf2, kor and kwr are the effective saturation ofphase 1, effective saturation of phase 2, the saturated rock bulk modulus for phase 1 and the rock bulk modulus for phase 2, respectively, considering residual saturation values for both phases. According to Sengupta & Mavko (2003), in most cases of waterflooding, the saturation of the reservoir happens homogeneously, which would allow us to properly use Gassmann equations. On the other hand, in gas injection experiments the saturation process of the reservoir occurs predominantly in a heterogeneous fashion, for which the modified patchy model can be adopted. This behavior of saturation was also observed by Knight et al. (1998),as can be see in Figure 1.
Reservoir simulation
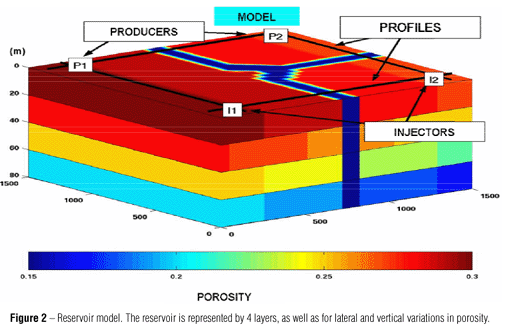
The reservoir model used for simulations consists of a box of 1500 m × 1500 m × 80 m. Figure 2 shows the reservoir model, including the location of the synthetic barriers and distribution of porosity. The numerical experiments were carried out for barrier permeability values equal to 1 mD, 10 mD and 50 mD, to evaluate the effect of transmissibility. A Cartesian grid with dimensions 30 × 30 × 4, i.e. gridblocks of 50 m × 50 m × 20 m, was used for the waterflooding simulations. On the other hand, gas injection was simulated using gridblocks of 50 m × 50 m × 5 m. However, results were upscaled to seismic scale, after completing the simulation. A finer grid in other directions could not be used due to the maximum number of gridblocks allowed in our version of the simulator. Values of porosity and permeability were assigned to each simulation gridblock to create the static model of the reservoir. Porosity varied linearly along each of the reservoir layers, between 15% and 30%. Horizontal permeability was distributed randomly in a range between 900 mD and 1000 mD, while vertical permeability was taken as 10% of the horizontal permeability value in every grid block. The initial reservoir pressure was set at 2,000 psi, while a mean temperature of 60ºC was assigned. The simulation was initialized at irreducible water saturation. Residual (irreducible) water saturation was taken as 20%, while residual oil saturation was 15%. The reservoir model was characterized by high porosity and low permeability. This characteristic configuration is no unheard of, e.g. the Weyburn Field (Brown, 2002; Davis et al., 2003; Yamamoto, 2004).
Fluid properties were calculated according to empirical relationships proposed by Batzle & Wang (1992). A constant flow rate of 75,000 ft3/day was imposed, with a water salinity of 150,000 ppm NaCl equivalent. The immiscible gas was injected at 75,000 ft3/day. In both cases, the injection time of all fluids was nine years, which will be reflected in most of the results presented.
The University of Texas compositional simulator, UTCHEM (2000), was used in all simulations. Gas flooding was simulated as an immiscible phase. To avoid effects of numerical dispersion, a high-order integration algorithm, Total Variation Diminishing (TVD), was used, combined with automatic time stepping. Capillary pressure was modeled through a Corey function inimbibition mode. Relative permeability curves were represented by imbibition curves in the Brooks-Corey model. Residual phase value and permeability exponents are summarized in Table 1.
Water injection case
Saturation and pressure maps
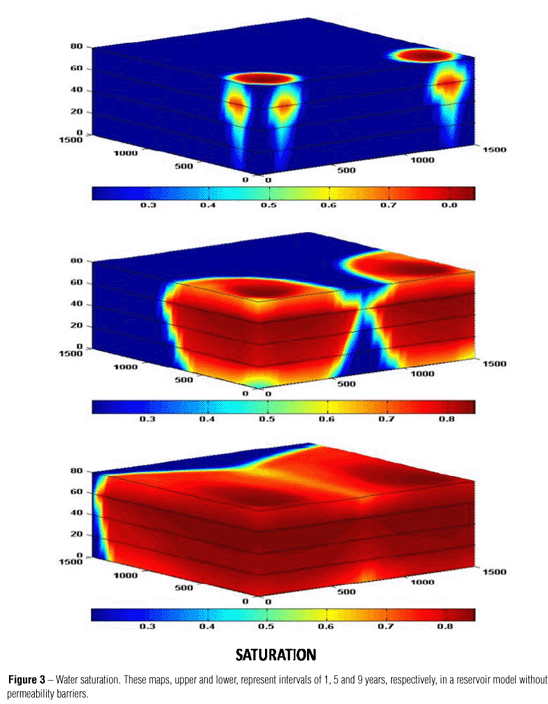
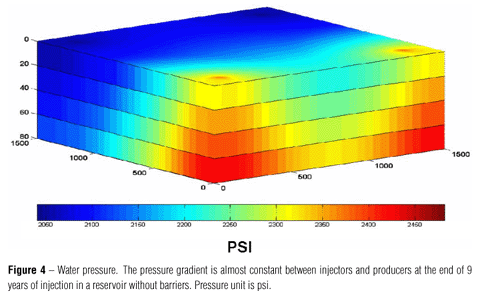
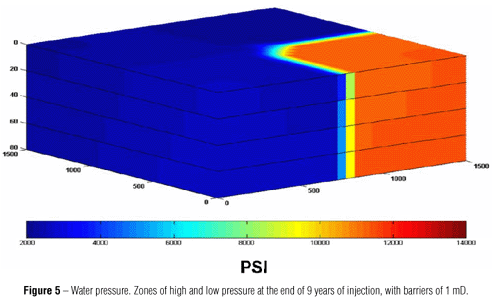
Pressure and saturation distributions are the main output of the simulation and the initial point for modeling purposes. Watersaturation distribution upon water injection was studied for the case of a water-wet reservoir. Figure 3 shows the saturation distribution in a reservoir model without barriers at three consecutive times in the simulation. It can be noticed that the fluid displacement front driven by the injection of water in wells I1 and I2 progresses homogeneously through the reservoir, reaching the producing wells after 9 years of waterflooding. The pressure changed smoothly for the duration of the injection period, in the case of the reservoir model without barriers (Fig. 4). The introduction of permeability barriers in the model confined the water injected between wells I2 and P2, leading to regions of low and high pressure in the model (Fig. 5).
Velocity and impedance maps
The saturation distribution in the model is relatively homogeneous, which is consistent with a water wet rock. Since water is the injection fluid, imbibition will favor a more homogeneoussaturation distribution. In consequence, Gassmann equations were used to model the velocity field, and thus the acousticimpedance field.
In the region around the injection well I2 there is a small variation of velocity during the 9 years in the simulation and this variation becomes more acute as the barrier becomes more impermeable, as can be seen in Figure 6. This occurs because pressure increases in the proximity of the injector I2. Figure 7 depicts the contrast in acoustic impedance, which reflects a behavior similar to that of wave velocity (the presented sequence corresponds to the time instants of 1, 5, and 9 years). The largest variation in impedance is observed for a permeability barrier of 1 mD. Despite clear effects shown so far, the value of variations is very small. Lumley et al. (1997) present a method of risk analysis for monitoring of reservoirs through 4D seismic. They analyzed a number of parameters in terms of impedance and concluded that in order to detect changes in the reservoir through seismic, the variation in impedance must be greater than 4%. Therefore, we should expect for the seismograms to show a detectable response.
Synthetic seismograms
Due to the simplicity of the current reservoir model, it was decided to generate seismograms from a convolutional model, where each trace T from the seismogram can be obtained through convolution of the source function F and a reflectivity function R.
In both injection scenarios, the seal rock at the top exhibits a density value of roughly 2.3 g/cm3 and a velocity of 3100 m/s. At the base, the seal rock has been assigned a density value of 2.45 g/cm3 and a velocity value of 3600 m/s. Since the impedance values of the seal rock are greater than the impedance associated with the reservoir rock, we should expect to have negative amplitudes in the upper part and positive at the bottom. Seismograms were generated on a plane between wells I2 and P2. From Figure 8, it can be seen that the fluid does not go across the barrier, as illustrated by the amplitude variations. This becomes clearer when the contrast section is analyzed (Fig. 9). One preliminary conclusion of these results is that although the effects of the barrier affect the seismic response, the location of the barrier is not obvious from the seismograms.
Gas injection case
Pressure and saturation maps
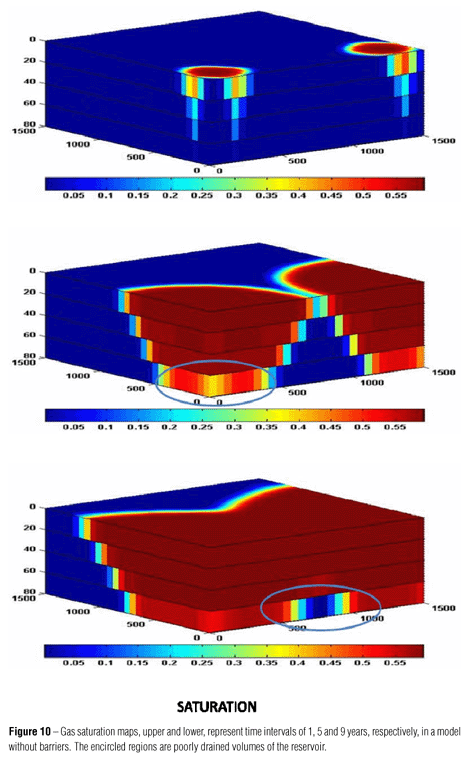
To contrast with the waterflooding case, gas injection in the same reservoir model used for waterflooding is presented. The simulation represents an immiscible gas injection process, since thereis not component exchange between the gas and the liquid hydrocarbon phase. As expected from gas properties in comparison with waterflooding behavior, the displacement front driven from the injection wells I1 and I2 are more irregular, i.e. more heterogeneous saturation distribution. Figure 10 shows saturation distribution in the reservoir model. As may be observed, gas naturally rises occupying primarily the upper layers in the reservoir, as expected from buoyancy forces or gravitationally driven flow.The latter effect leads to poor oil drainage mainly in the lower layers of the reservoir.
Despite the fact that gas and water are being injected at the same volumetric flow rate at bottomhole conditions, gas, as opposed to water, does not reach the production wells after 9 years. On the other hand, pressure maps in this case, are alike those of water injection.
Velocity and acoustic impedance maps
As described previously, the gas saturation distribution is more heterogeneous than that of water during waterflooding. Some characteristics of gas flooding contribute to the irregular gas saturation in the reservoir model. As opposed to waterflooding in a water-wet medium, gas is a non-wetting phase, so displacement oil is an unstable drainage process, due to unfavorable mobility ratio. The gas phase possesses a much lower viscosity ratio and therefore the displacement front results unstable. For this reason, a patchy model was utilized in this case.
A significant change in propagation velocity between wells I1 (injector) and P1 (producer) can be noticed (see Fig. 11), in contrast with the waterflooding scenario. Another interesting observation is that the velocity variation after 9 years of injectionturns out positive in the vicinity of well I2, as opposed to thewaterflooding case. Likewise, the acoustic impedance presents the same type of change, as can be observed in Figure 12. These two latter results can be explained from the increment in pressure and the high specific gravity of gas (1.54), assumed in the simulation model. However, the more significant effect comes from both the velocity and impedance maps, as an apparent existence of a barrier. Hubbert (1953) derived theoretical concepts for oil traps, showing that the limits of the reservoir rock are a barrier to hydrocarbon migration, due to the capillary pressure contrast.More specifically, there is a pressure difference necessary to displace oil from the reservoir rock through the seal rock. In our example (1 mD for the barrier permeability), the gas is confined in a high-pressure region, until pressure reaches a value high enough for a significant gas flux to occur. Under these circumstances, the gas bulk modulus increases, hence diminishing the contrast, leading to a velocity value almost undifferentiated from the initial time, priori to injection. However, as the bulk of the gas goes across the barrier, it encounters a low-pressure region, suffering expansion, hence diminishing the bulk modulus. As a result, the barrier induces a significant contrast in velocity, which allows us to identify it.
Synthetic seismograms
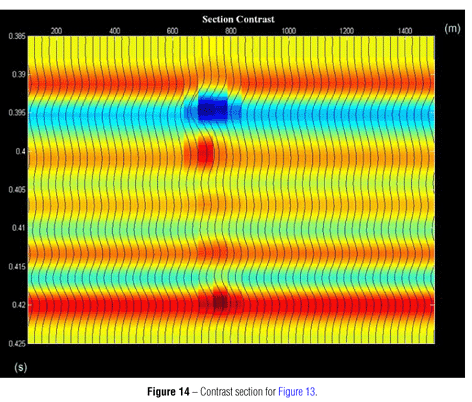
Figure 13 shows the lack of variation in the seismic amplitude in the vicinity of well I2, as shown in the analysis of the velocity and impedance maps. Figure 14 represents a contrast section of Figure 13, and reveals clearly the presence of a permeability barrier, not only at the top or the base of the reservoir, but also in between. This result shows that it is possible to identify permeability barriers in gas injection processes.
DISCUSSION
From the observation of saturation maps, it can be noticed that there exists a correlation between the effects of permeability barriers on fluid flow from well I1 and the remaining regions of the reservoir model. In practice, it appears that effects in one region of the reservoir will induce contrast in other regions of the same reservoir model.
The differences in gas and water breakthroughs in producing wells could be due to several factors. First, gas is a more compressible phase than liquids, therefore, although the volumetric injection rates are the same for water and gas (at bottomholeconditions), once the pressure increases, gas can be pocketed in the reservoir more significantly than more incompressible fluids or said in terms of fluid properties, the volume factor of the gas is greater. A second aspect has to do with buoyancy. Gas tends to rise more easily than liquids, because of density difference.Finally, relative permeability curves for gas will tend to imprint a different dynamics to gas flow than the equivalent case of water flooding.
The acoustic impedance maps show that variations of this attribute follow the same trend as those of the velocity maps.In addition to this, in our model, there would exist a possibility for identifying the barriers, if the same impedance patterns were established on both side of the barrier (low and high pressure), however with an impedance distribution different from that of the injection. This was confirmed with the contrast sections, in the case of gas flooding, in which case it was possible to locate the barriers.
CONCLUSIONS
The fluid flow simulation helped to highlight the effect of permeability barriers in the seismic response. Despite the simplicityof the adopted model, our study showed that permeability barriers have a great impact on the seismic response and this effect can be directly linked to the permeability of the barrier. The presence of barriers can lead to increased pressure values, often high enough to change the bulk moduli of the fluids during injection. In the case of waterflooding, where water saturates the reservoir in a relatively homogeneous fashion, the effects on the seismic response are observed mostly at high pressure. On the other hand, in contrast with waterflooding, gas injection tends to modify the seismic amplitude in regions of low pressure. As expected,buoyancy forces drive the gas toward the upper layers of a reservoir, leading to poorly drained regions, mostly associated with lower layers of the reservoir. The velocity map, in the case of high-gravity specific gravity used in the simulations, which normally show negative variations, can lead to positive velocity variations in the presence of low-permeability barriers during injection.
Gas injection can enable the identification of permeability barriers. The expansion of gas across the permeability barriers facilitates the discernment of the barrier. The value of the gas specific gravity is a key factor, since the higher the specific gravity, the greater the change in the bulk modulus as a function of pressure. To visualize this clearly, it is important to create contrast maps.
Although it is possible to locate the position of permeability barriers through time-lapse seismic in our model, caution is recommended. It is worth highlighting that the velocity maps were obtained through the patchy model, but without an adequate upscaling due to limitations of the simulator. Besides, in our approach to this problem, the effect of pressure on Kd was not considered, which could bring in additional effects in regions of low pressure and high porosity.
ACKNOWLEDGEMENTS
We would like to thank the Center for Petroleum and Geosystems Engineering at the University of Texas at Austin for having kindly provided access to a license of UTCHEM. Prof. FernandoMoraes (LENEP-UENF) is acknowledged for useful technical discussions. The ANP provided financial support.
Recebido em 8 novembro, 2007 / Aceito em 4 junho, 2008
Received on November 8, 2007 / Accepted on June 4, 2008
NOTES ABOUT THE AUTHORS
Carlos da Silva Claudino. B.Sc. in Physics, Rio de Janeiro State University and M.Sc. in Geophysics, Federal University of Bahia (UFBA). He has worked on Geophysics since 2004 and his main research interests involve reservoir simulation and seismic modeling.
Fredy Alex Villaorduña Artola. B.Sc. Geological Engineering (UNI-Peru); MSc Applied Geophysics, 1997 (UNB); Ph.D. Applied Geophysics, 2000 (UNB). He visited CPGG-UFBA as a postdoc researcher in 2001 and developed research projects at PUC-Rio during the period 2002-2006. Areas of interest are: Seismic Modeling, Seismic Anisotropy, Ray Theory, Multicomponent Seismology, Rock Physics, Time-Lapse Seismic Reservoir Monitoring, Geomechanics, Theoretical aspects of the Seismic Data Processing and Seismic Interpretation. He worked as Exploration Geophysicist with Graña y Montero Petrolera (1992-1995), as Processing Geophysicist with Petroleum Geo-Services PGS (2007). He is currently a Senior Geomechanics Specialist and Reservoir Geophysicist (International Mobile) with Schlumberger, Venezuela (Data & Consulting Services DCS).
Wilson Mouzer Figueiró. B.Sc. (1983) in Mathematics from Federal University of Rio de Janeiro (UFRJ). Since 1992, he has been Geophysics Professor with the Geophysics Department of the Geoscience Institute at the Federal University of Bahia (UFBA), where he teaches Mathematical Geophysics. He obtained his Ph.D. in Geophysics (1994) from UFBA. From 1997 to 1999, Figueiró did post-doctoral studies at the Earth-Atmosphere-Ocean Department of the Superior Normal School of Paris (DTAO-ENS), France. Now, he is researcher at the Geophysics and Geology Research Center (CPGG) of the UFBA. His main areas of interest are: Geophysical Inversion and Applied Mathematics to Geophysics.
Vladimir Alvarado Bastante. Ph.D. from the Department of Chemical Engineering and Materials Science, University of Minnesota, Minneapolis, MN (1996). He received a Masters in Exploration and Production from the Institut Français du Pétrole, Paris, France (2002). He has more than 17 years of experience in Petrophysics, Reservoir Engineering and Enhanced-Oil Recovery. He developed collaborative work on Time-lapse seismic during his stay at PUC-Rio, Brazil, between 2003 and 2005. He is currently an Assistant Professor with the Department of Chemical and Petroleum Engineering at The University of Wyoming, Laramie, WY; and a Senior Consultant with Norwest-Questa Engineering, Golden, CO.
- BATZLE M & WANG Z. 1992. Seismic properties of pores fluids. Geophysics, 57: 1396-1408.
- BIOT MA. 1956. Theory of propagation of elastic waves in a fluid-saturated porous solid low frequencies range. The Journal of the Acoustical Society of America, 28: 168-178.
- BROWN LT. 2002. Integration of rock physics and reservoir simulation for the interpretation of time-lapse seismic data at Weyburn Field, Saskatchewan. Thesis of Master of Science. Colorado School of Mines, 149 p.
- DAVIS TL, TERRELL MJ & BENSON RD. 2003. Multicomponent seismic characterization and monitoring of the CO flood at Weyburn Field, Saskatchewan. The Leading Edge, 22: 696-697.
- GASSMANN F. 1951. Über die Elastizität Poröser Medien: Vier. DerNatur. Gesellschaft, 96: 1-23.
- HUBBERT MK. 1953. Entrapment of petroleum under hydrodynamic conditions. Bulletin of the American Association of Petroleum Geologists, 37(8): 1954-2026.
- KNIGHT R, DVORKIN J & NUR A. 1998. Acoustic signatures of partial saturation. Geophysics, 63: 132-138.
- LUMLEY DE, BEHRENS RA & WANG Z. 1997. Assessing the technical risk of a 4-D seismic project. The Leading Edge, 16: 1287-1291.
- MAVKO G & MUKERJI T. 1998. Bounds on low-frequency seismic velocities in partially saturated rocks. Geophysics, 63: 918-924.
- SELLEY RC. 1998. Elements of Petroleum Geology. Second Edition,Academic Press. 470 p.
- SENGUPTA M & MAVKO G. 2003. Impact of flow-simulation parameters on saturation scales and seismic velocity. Geophysics, 68: 1267-1280.
- SMITH TM, SONDERGELDZ CH & RAI CS. 2003. Gassmann fluid substitutions: A tutorial. Geophysics, 68: 430-440.
- UTCHEM. 2000. Technical documentation for UTCHEM-9.0: A Three-Dimensional Chemical Flood Simulator, vol. 2, Texas, The University of Texas at Austin. 153 p.
- YAMAMOTO H. 2004. Using time-lapse seismic measurements to improve flow modeling of CO injection in the Weyburn Field: a naturally fractured, layered reservoir. Colorado School of Mines, Colorado, USA. Thesis of Doctor of Philosophy (Petroleum Engineering). 218 p.
Publication Dates
-
Publication in this collection
22 Sept 2008 -
Date of issue
June 2008
History
-
Accepted
04 June 2008 -
Received
08 Nov 2007


